Brand
Knowledge:
BACHELOR THESIS WITHIN: Marketing Management NUMBER OF CREDITS: 15 ECTS
PROGRAMME OF STUDY: Business Administration AUTHORS: Magdalena Kaminskaite, Simon Johansson JÖNKÖPING: 05 2019
An exploratory study on whether demographic factors affect
consumer brand knowledge of a company which practices a
standardized targeting strategy
Bachelor Thesis in Business Administration
Title: Brand Knowledge: An exploratory study on whether demographic factors affect consumer brand knowledge of a company which practices a standardized targeting strategy Authors: Magdalena Kaminskaite & Simon Johansson
Tutor: Johan Larsson Date: 2015-05-20
Key terms: Brand Equity, Brand Knowledge, Gaming Equipment Industry, Razer Inc., Standardized Marketing
Abstract
Globalization is here to stay, and with an increasing number of brands deciding to test their fortune abroad, the importance of branding increases alike. The choice of globalizing a brand comes with potential financial benefits but it is not done without considerable effort.
According to Kotler and Keller, the choice regarding differentiation to competitors is one of the main factors a brand must consider when expanding abroad (2009). One key factor that determines the level of success of international companies is the amount of brand knowledge (Guedes & da Costa Soares, 2005). Consumer brand knowledge and its importance for financial success has been extensively studied by researchers (Fill & Turnbull, 2016) and it has been found that solid brands continuously outperform their markets (Pirrie, 2006). The purpose of this study was to evaluate whether demographic factors such as age, gender and nationality significantly affect consumer brand knowledge. The chosen brand for the study was Razer that practices a standardized global targeting strategy. Razer is a company that produces gaming equipment for gamers. Gamers constituted the desired sample of the study due to their belonging within the brands target segment. A survey based on and constructed using the “Dimensions of Brand Knowledge” by Keller (1993) was issued online in Sweden and Lithuania on social media within groups that share the common interest of gaming. 540 responses were collected, and 8 hypotheses were tested using SPSS linear regression tests. Findings showed that brand recognition differed in regard to demographic factors of the respondents, supporting H2. However, the remaining aspects of brand knowledge did not differ regarding the combined demographic factors, therefore, the remaining hypotheses were rejected. These results may aid marketers and scholars in the comprehension of factors that may affect their global marketing efforts within the gaming industry and contribute to the current research done within the field of gaming equipment, which is quite understudied given its economic potential.
Table of Contents
... 1
1.
Introduction ... 1
1.1 Background and Relevance ... 1
1.2 Problem discussion ... 2 1.3 Purpose ... 4 1.4 Definitions ... 4 1.4.1 E-sports ... 4 1.4.2 Gamers ... 4 1.4.3 Gaming equipment ... 4 1.4.4 Brand Image ... 4 1.4.5 Brand Attitude ... 4 1.5 Delimitations ... 5
2.
Frame of Reference ... 5
2.1 Brand Equity ... 5 2.2 Brand Attitude ... 7 2.3 Framework ... 8 2.3.1 Brand Awareness ... 9 2.3.2 Brand Image ... 92.3.2.1 Types of brand associations ... 9
2.3.2.2 Favorability, strength and uniqueness of brand associations ... 10
2.4 Standardized marketing ... 11
3.
Method and Methodology ... 12
3.1 Research philosophy ... 12 3.2 Research approach ... 13 3.3 Sampling ... 13 3.4 Questionnaire design ... 15 3.5 Reliability ... 17 3.6 Validity ... 18 3.7 Ethical considerations ... 19
4.
Empirical Findings ... 20
4.1 Background of respondents ... 204.2 Dependent variable data ... 22
4.2.1 Brand Awareness ... 22
4.2.2 Brand Image ... 23
5.
Analysis & Interpretation ... 27
5.1 Introduction ... 27 5.2 Multicollinearity tests ... 27 5.3 Hypothesis tests ... 28 5.3.1 Brand Recall ... 28 5.3.2 Brand Recognition ... 30 5.3.3 Brand Benefits ... 31
5.3.4 Product related brand attributes ... 33
5.3.5 Non-product related brand attributes ... 34
5.3.6 Favourability of brand associations ... 35
5.3.7 Strength of brand associations... 36
5.4 Summary ... 39
6.
Conclusion ... 40
7.
Discussion ... 42
7.1 Limitations ... 42
7.2 Suggestions for Future Research ... 42
7.3 Contribution... 43
8.
Reference list ... 44
9.
Appendixes ... 49
9.1 Appendix 1 - Questionnaire ... 49
9.2 Appendix 2 – Scatter Plots and Normal P-plots ... 52
1. Introduction
_____________________________________________________________________________________
In this section the background and relevance of the chosen subject are presented and followed by a problem discussion and problem recognition. The purpose of the research is clearly stated, furthermore, a small section of definitions follow and finally, the delimitations of the study are discussed before concluding the introduction section of the paper.
______________________________________________________________________
1.1 Background and Relevance
The importance of having a strong brand and a thorough understanding of its identity has been acknowledged and researched by scholars continuously, with financial and competitive advantages being one of the major drivers (Fill & Turnbull, 2016). A strong brand equals increased revenue, hence a strategic brand manager should build the brand with long-term objectives in mind and use it as a leverage in product/service categories and markets (Aaker, 1991, 1996; Kapferer, 2004; Keller, 2003). Former to that, research suggests that firms with solid brands actually “consistently outperform their markets” (Pirrie, 2006). According to research regarding the drivers of the growing internalization, low taxes, production costs and the creation of scales of economy were established as the key reasons for companies to venture out of their national borders (Agrawal, 2016). With an increasing number of brands deciding to expand their markets and reach across borders, the importance of branding increases and companies must consider a greater amount of effort to differentiate themselves from their competitors (Kotler & Keller, 2009). One of the major factors that is directly linked to the success of a company deciding to go global is the possession of a strong brand which is according to Guedes and da Costa Soares (2005) achieved through an increased level of brand knowledge. This knowledge consists of brand awareness and image, which are the consumer sides of the brand (Alimen & Guldem Cerit, 2010). Previous studies examined the brand knowledge regarding brands belonging to the fashion industry and general consumer products (Alimen & Guldem Cerit, 2010; Esch et al., 2006). It was discovered that demographic
factors and usage do have an impact on the consumers brand knowledge (Alimen & Guldem Cerit, 2010).
When managing the consumers brand perception through marketing, a marketing mix is created and composed out of activities and decisions regarding the brands choice of product, place, price, promotion (Lamb, Hair & McDaniel, 2018). A standardized targeting strategy is one of the three basic global targeting strategies and the implementation of such a strategy includes minimal to no adaption of the 4 elements of the marketing mix (Keegan & Green, 2015). Apart from the savings obtained through not having to adapt to each market, this dual extension approach to marketing abroad indicates that marketing communications conducted in each market will be identical (Keegan & Green, 2015). In this study, the chosen brand of study is Razer. The company operates within the vastly growing gaming equipment industry. The company conducts their marketing using a standardized marketing strategy with a dual-extension approach to their product and communications across the entirety of their European markets (Appendix 3). Dual-extension is referred to as the extension of a brands product and communication, it includes minimal adaption to the marketing mix elements (Green, 2008). Through the usage of the dimensions of brand knowledge model created by Keller in 1993, the authors of this paper intend to find out whether demographic factors influence brand knowledge of the chosen brands target segment.
1.2 Problem discussion
Businesses today are not constrained by boundaries neither physically, nor virtually, therefore, majority of them tend to choose the path of internationalization (Altuntas & Turker, 2015). Internationalization within commerce, is referred to as the rising tendency of businesses to operate across their national borders (BusinessDictionary, 2019). What follows is the choice whether a standardized marketing strategy across different countries should be implemented, or should the marketing be adapted to the individual markets (Szymanski et al, 1993). It generally depends on the nature of the company, but now that both companies and consumers can utilize the internet to seek and purchase items online, the matter has become even more complex. Each industry and each region is different,
yet it remains crucial for marketers to understand and possibly be able to predict what the outcome of their marketing communications will be. This is when brand knowledge comes in (constituting of brand awareness and brand image) which companies can control by using suitable communication (Rajh, 2002).
Furthermore, it is of vital importance to establish the influencing factors that might impact the consumer brand knowledge, which could be either personal or environmental (Alimen & Guldem Cerit, 2010). A research conducted on fashion brands in Turkey made an analysis on the influence that gender, field of education and the consumption of a brand has on brand knowledge (Alimen & Guldem Cerit, 2010). The authors then suggested demographic factors as an aspect to be included in future research. Moreover, it was also suggested by previous research to conduct studies using the dimensions of brand knowledge model on a brands target segment and on that same brand in different countries (Alimen & Guldem Cerit, 2010). A study conducted on brand knowledge and relationships effect on current and future purchases found that current purchases were affected by brand image both directly and indirectly as well as by brand awareness (Esch et al., 2006). Furthermore, research on brand attitude has also been conducted on environmentally friendly production (Olsen, Slotegraaf & Chandukala, 2014), vacation resorts (Ahn, Back & Lee, 2018), luxury brands (Liu, Li, Mizerski & Soh, 2012) and other industries, yet gaming equipment field remains untouched. Comparative research of brand attitude has been conducted in countries, such as South Korea, Japan and the US (Shi, Li & Lim, 2017) or the US and Japan (Fang & Wang, 2018). Finally, a global study conducted by Dant et al. (2016) analyzed how two US fast-food industry brands are perceived by people from Brazil, India, China and South Africa. Research involving cross-country comparisons regarding the perception of brands in the eyes of the consumers has been done extensively across the globe. However, not a lot of research has been done in Europe, more specifically in Lithuania and Sweden. There are numerous factors that may influence brand knowledge; and the impact of demographic factors on a brands target segment arise as a rather wide and extensive gap in the current research which the authors intended to address.
1.3 Purpose
The purpose of this thesis was to delve deeper into consumer brand attitude and discover whether the usage of Razer’s standardized targeting strategy could result in a variation regarding the brand knowledge of its consumers in Sweden and Lithuania.
1.4 Definitions
1.4.1 E-sports
E-sports (electronic sports) is otherwise referred to as competitive computer gaming and is a phenomenon that has become a fundamental part of today’s youth culture (Wagner, 2006).
1.4.2 Gamers
A gamer is defined as a person that plays video games or participate in role playing games (Oxford Dictionary, 2019).
1.4.3 Gaming equipment
In this thesis, gaming equipment is mentioned at numerous occasions and are meant as a representation for gaming computers (PC) and gaming accessories such as keyboards, mice, mouse pads and headsets. It will not include such products as VR-equipment or consoles. The term gaming equipment will occasionally be referenced to as (GE). 1.4.4 Brand Image
Oxford University Press (2016) explain brand image as the perception of a brand in the mind of the consumer.
1.4.5 Brand Attitude
Brand attitude, according to Faircloth, Capella and Alford (2001) is a consumer’s general opinion of a brand.
1.5 Delimitations
This research is not a definite representation of how Razer is perceived by the population constituting the gamer community in the researched countries. Moreover, the research does not provide a finite solution to whether a specific global targeting strategy is more beneficial than another. Cultural differences between the examined countries are also excluded from the consideration. Furthermore, the demographic factors analysed are limited to age, gender and location and therefore does not provide an answer to the effect of demographics on brand knowledge as a group. Lastly, a final delimitation concerns the exclusion of brand attitude, user/usage image and brand personality of Keller's “Dimensions of Brand Knowledge” model. The necessary adaptation of the theoretical framework created by the authors does therefore not fully represent the entirety of aspects to be covered in the original model, due to the limited scope of the survey.
2. Frame of Reference
_____________________________________________________________________________________
In this section, key terminology and methodology is thoroughly explained to provide the reader with the necessary knowledge and by doing so facilitating the comprehension of the research. Terminology such as brand, branding, brand equity and Aaker's model for brand personality is elucidated. Furthermore, the framework used for the study is described, followed by hypotheses which are clearly stated with their connection to each aspect of the model they were derived from. The method used as guidance for the creation of the means to gather and analyze the obtained data is presented. Moreover, the global targeting strategy used by the chosen brand will be explained and facts concerning the target respondents, Razer and the nations included in the study are described. Included information was obtained using google scholar, JU Library and other sources deemed credible. The articles used are peer reviewed and an effort was made to include as recent articles as possible besides from a number of classics and articles needed for a more thorough comprehension.
2.1 Brand Equity
Before speaking of brand equity, it is important to comprehend what exactly a brand is and what benefits it provides. According to Black, Hashimzade and Myles (2017), a brand is a name that is used to identify a maker/distributor of goods. It allows easy identification
and is useful for both the user as well as the provider. Fill and Turnbull (2016) argue that brands are a composition of two things – the identity that managers aspire to portray and the images (understood by recipients) of the identities they perceive as articulated through user-generated content.
Brand equity is an important business aspect that has been discussed by scholars extensively. Even so, there is still no universe definition for it and different sources look and present it in different ways. Oxford University Press (2016) explains brand equity in marketing as the value of a brand despite its functional purpose. It is also added that the market share and profits can be larger as a result of good associations with the brand equity. Yoo, Donthu and Lee (2000) define brand equity as the difference in consumer choice between the subjected branded product and an unbranded product given the same level of features. The latter research identifies it as a comparison of products with the same qualities in all respects except the brand name. Brand equity is also often associated with people’s willingness to pay premium prices (e.g. Park & Srinivasan, 1994). Which is explained as when brand equity allows for an additional price then the enterprise can charge currently for the brand.
Because brand equity is such a broad topic, authors conducting studies on it in recent days tend to split the previously done research into sections according to which perspective is touched upon in the research. Oliveira, Silveira and Luce (2015) came up with sections such as consumer perception, monetary value, competition-monitoring, brand-switch probability, temporal perspective and whether the research presents the contribution of each of the drivers. Mirzaei, Gray and Baumann (2011) present a three-dimensional sorting model, including customer mindset outcomes, product market outcomes and financial market outcome.
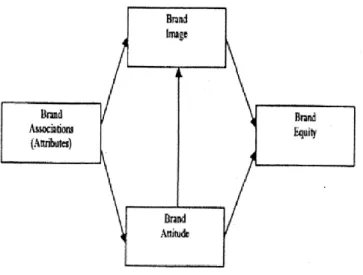
Even though existing research suggests that a positive brand image and attitude should enhance brand equity development, the empirical evidence is not conclusive (Faircloth, Capella & Alford, 2001). What is particularly troublesome is understanding why brand attitude often fails to affect buyer behavior. That same research provided an approach which combined two classic pieces by Aaker (1991) and Keller (1993) on brand equity (see Figure 1). The model suggests that there are 3 routes to the creation of brand equity. Direct ones through brand image or brand attitude and an indirect one that goes through brand attitude and then brand image. Faircloth, Capella and Alford (2001) suggest looking at brand equity simply as biased consumer actions towards an item; at brand image as perception related to the item; and finally, the brand attitude as an evaluation of the item. It is important to note that there is no single correct model to evaluate brand equity, as it is such a complex phenomenon. There is one aspect that is clear, which is that brand equity is a multidimensional construct and it is important to recognize the different dimensions when measuring it (Faircloth, Capella & Alford, 2001).
Figure 1: An approach to calculating brand equity. Faircloth, Capella and Alford (2001);
2.2 Brand Attitude
Brand attitude is closely connected to brand equity (Figure 1) and is crucial to understand in order to get the full picture of brand equity from the perspective of the consumer. Mitchell and Olson (1981) defined brand attitude as a consumer’s internal evaluation of a brand. This has been later expanded by Murphy and Zajonc (1993), who added a concept
of brand attitudes being a global evaluation based on favorable or unfavorable responses to brand-related stimuli. When it comes to more recent research on brand attitudes, Li (2015) stresses the importance of brand attitudes by delving into the implications of negative events to the consumer brand attitudes. The author found that brand attitudes can easily be damaged by some level of betrayal from the company’s side and that a stronger attachment to a brand leads to stronger sense of betrayal. Azizi and Kim investigated the role of brand recall and attitude on the purchase intentions in advergamers among gamers in Malaysia (2013). The results displayed brand recall and attitude mediating the relationship among self-brand congruity; entertainment and brand placement acceptance with purchase intention. In the research, brand attitude displayed a positive relationship with the buying intention of consumers, which essentially is a communication effect (Percy & Rossiter, 1992). The hypotheses on brand attitude that were supported by the study conducted by Azizi and Kim state that “brand attitude positively influences purchase intention in advergames” and that “Brand attitude mediates the relationship between self-brand congruity, entertainment, brand placement acceptance and advergames” (2013).
2.3 Framework
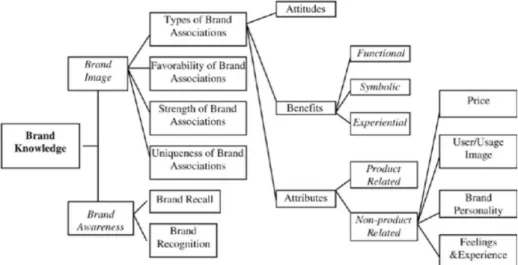
One of the most significant works researching brand equity, confirmed by prior research (Agarwal & Rao, 1996; Mackay, 2001; Pappu et al., 2005; Esch et al. 2006) was developed by Keller in 1993 and is a conceptual model of brand equity from the perspective of the consumer. It provides descriptive and evaluative brand information of individualistic inference about a brand (Alimen & Guldem Cerit, 2010). The model is organized into two sections - brand awareness, which refers to the strength of the brand in a customer’s memory; and brand image, which includes strong, favorable and unique brand associations in the customer’s memory (Esch et al., 2006). In this research paper, the goal is to understand whether customers from different demographic backgrounds have the same brand knowledge of a brand that uses a standardized marketing strategy. Therefore, the “Dimensions of Brand Knowledge” by Keller (1993) is going to be applied in order to better grasp the brand perception of the consumers and have clearly structured responses (Figure 2). Few minor adjustments were made to the model, such as the exclusion of attitudes, user/usage image and brand personality due to the limited scope of
the online survey. Those aspects of brand knowledge were so extensive that they required separation from the model used in the thesis, as if included, they would make the scope too broad for proper evaluation of the other aspects.
Figure 2: Dimensions of Brand Knowledge, Keller (1993);
2.3.1 Brand Awareness
Brand awareness is the section that is related to the way a customer remembers a certain brand. The first subcategory of brand awareness is brand recognition which according to Keller (1993) is the ability of a consumer to confirm prior exposure to a brand when given a cue. In other words, it signifies that the consumers have seen or heard about the brand previously. Whilst the second subcategory is brand recall which deals with consumers’ ability to remember a brand when given a category of products (i.e. gaming equipment). From both components two hypotheses were derived using demographics factors to distinguish differences from the obtained data.
h1: Brand recall differs in respect to demographic factors; h2: Brand recognition differs in respect to demographic factors;
2.3.2 Brand Image
2.3.2.1 Types of brand associations
Brand image according to Keller is how consumers perceive a brand as a reflection of the brand associations that they hold in their memory (1993). The first aspect that will be
touched upon in brand image during the survey are the brand associations. Brand associations have three categories - brand attributes, benefits and attitudes. Attributes are the descriptive features that make a characterization of a product or service. They can be product related (necessary ingredients needed to perform a function) and non-product related (external aspect of the product/service that relate to the consumption). The main non-product related aspects include price information, packaging and product appearance, user imagery (what kind of user buys the product), and usage imagery (situations where the product is used). The benefits are the personal values that are attached by consumers, or in other words it is what the product can do for them. There are three categories of benefits- functional, experiential and symbolic (Park, Jaworski & MacInnis, 1986). Functional benefits correspond to more product-related attributes that are representing intrinsic advantages of consumption. Experiential benefits refer to the feeling that occurs when using a product/service, they refer to the satisfaction of experiential needs (i.e. sensory pleasure). The symbolic benefits are the extrinsic advantages and usually correspond to non-product related attributes, such as “social approval, personal expression and outer-directed self-esteem” (Keller, 1993). Out of this aspect of brand perception, three hypotheses are developed in respect to the demographic factors.
h3: Brand benefits differs in respect to demographic factors;
h4: Product related brand attributes differs in respect to demographic factors; h5: Non-product related brand attributes differs in respect to demographic factors;
2.3.2.2 Favorability, strength and uniqueness of brand associations
Following aspect of brand image includes the favorability of brand associations, which the success of a marketing program depend upon. It is not difficult for a brand to be known for being extremely good or extremely bad, but to have favorable associations in particular is a challenge that a company should strive to achieve. The third subcategory, strength of brand associations, depends strongly on how information enters a consumer’s memory (Keller, 1993) and how it remains as a part of the brand image in their mind. For the uniqueness of brand associations, here the questions are derived from whether a brand has something sustainable as competitive advantage. A company must have something
unique that would convince a consumer to buy a brand. It is usually the case that a brand shares the same qualities with other brands in the field, therefore it is crucial to stand out. From this aspect of the framework, three hypotheses are derived concerning favorability, strength and uniqueness of brand associations in respect to demographics.
h6: Favorability of brand associations differs in respect to demographic factors; h7: Strength of brand associations differs in respect to demographic factors; h8: Uniqueness of brand associations differs in respect to demographic factors;
2.4 Standardized marketing
The allure of decreased production costs, lower taxes and the creation of an economy of scale are some of the reasons why companies decide to go abroad (Agrawal, 2016). The technological drivers for globalization are first of all the decrease in costs regarding communication, secondly the opportunities connected with the uprising of electronic commerce and lastly the cost reductions regarding transactions (Jacobides, M. G. 2005). The impact of global marketing strategies and its relation to company success has been studied by several researchers (Zou & Cavusgil, 2002; Schilke et al., 2009). However, there are scattered opinions whether or not a specific strategy leads to company success (Julian, 2014). Standardized global marketing, as explained by Keegan and Green (2015) describes this particular marketing strategy as one of the three basic global marketing strategies. It is also referred to as undifferentiated marketing which involves the creation of a marketing mix that is nearly identical in the markets the brand operates in. The basic assumption that is made by choosing an undifferentiated approach to marketing is the existence of an international market which is both seen and treated as a single segment (Keegan & Green, 2015).
Research made on the underlying factors driving standardization within emerging market firms, showed that the three drivers for an undifferentiated marketing strategy when conducting acquisitions overseas were established to be differences in legal distance, economic development and lastly the ethnic bindings between the host and home market (Rao-Nicholson & Khan, 2017). According to Schlegelmilch B.B. (2016), the significant demographic trends that are present in different countries needs to be taken in to
consideration together with foundational key points such as unemployment within the young population and apportioning of wealth. Schlegelmilch (2016) lastly concludes that these factors clearly depict a need for special consideration to the analysis of each country. The researcher also suggests that in some cases, standardized marketing might not be the most likely strategy for business success (Schlegelmilch B.B. 2016).
Standardized marketing brings forth various benefits such as decreased production costs, increase in product availability, and minimized product and communication adaptation (Keegan & Green, 2015). However, research conducted revealed a connection between the population size of a market and the overall success of a standardized marketing strategy. The larger the target population, the higher number of consumers perceive their preferences unfulfilled (Alesina, A., & Spolaore, E. 2003). Which suggests that the larger the market, the harder it becomes to avoid adaptation.
3. Method and Methodology
In this section, the philosophy and approach of the research is presented. Furthermore, the target group that will constitute the sample of the population is defined. Suitability of the researchers to conduct this type of study is discussed. Moreover, the choice of sampling is justified followed by the questionnaire design. Lastly, reliability and validity of the study is explained.
______________________________________________________________________
3.1 Research philosophy
A good roadmap to look at when deciding on a research philosophy is one developed by Saunders, Lewis and Thornhill (2009), named the research ‘onion’. It starts with techniques & procedures, moves on to time horizons, choices, strategies, approaches and finishes with philosophies. An exploratory study will be carried out in order to find out ‘what is happening; to seek new insights; to ask questions and to assess phenomena in a new light’ (Robson, 2002). The research philosophy applied in the paper is going to be positivism, which is explained by Saunders, Lewis and Thornhill (2009) as a stance of the natural science and includes working with an observable social reality and produces law-like generalizations. The research is going to provide pure data and facts which are
not going to be influenced by human interpretation or bias during extraction. It is also positivist because the researchers will not participate in the collection process and will not influence the responses in that way. The formation of structured hypotheses is made, and the quantitative data is tested using statistical tools.
3.2 Research approach
The approach of the theory development in this paper is predominantly deductive, because the authors move from collecting theory on the matter to collecting data (Suddaby, 2006). The authors begin by having a clear background of the issue and a present theory that is used to create a questionnaire. Blaikie (2010) introduces six steps through which a deductive process should progress. The first step being putting forward a tentative idea, premise or hypothesis. In the case of this research, the idea is testing if the company Razer, that operates using relatively standardized marketing is seen the same or differently by analyzing whether demographic factors, such as age, gender and nationality has an impact on the consumers brand knowledge. By the use of literature, conditions under which the theory holds are introduced, which include an explanation of how Razer does their marketing, the difference and similarities of the countries and an introduction to brand perception and brand attitude. Moreover, a method is introduced that allows structured evaluation of how a brand is seen in the eyes of consumers (Keller’s dimensions of brand knowledge). What follows, according to Blaikie (2010), is the testing of premises by collecting data and measuring the concepts and variables as well as analyzing them. After this is done and the results are not consistent with the premises, in other words the tests fail, the theory proves to be wrong and should be rejected, modified and the process should be restarted. If not, then the theory is corroborated (Blaikie, 2010).
3.3 Sampling
There are numerous methods of sampling that may be used, and the usage of a specific method is to be justified due to the nature of the desired answer and data of the researcher (Saunders, et. al., 2016). In this study, non-probability sampling and convenience sampling will be implemented as the chosen sampling method. Probability sampling is not possible due to the fact that we cannot acquire a complete list of the members of the gaming community within the studied nations, which would constitute the population, therefore, probability sampling is not suitable for this type of research since it is deemed
infeasible for the authors to calculate the probability of a member of the entire population to be chosen. Moreover, there is a lack of internal resources to conduct a survey, with the number of respondents that would be deemed acceptable to account for a sufficient number to represent the population of the target market if a probability sampling method would to be used. Thus, a non-probability sampling method is chosen to provide us with richer data and a higher number of respondents who are relevant for this research. In accordance with non-probability sampling, some subjective judgements are to be made by the researchers (Saunders, et. al., 2016). Because of the nature of non-probability sampling and its questionable representation of the population, the authors do not generalize about the entirety of the population, but rather analyze and present the data obtained from the sample of the study (Saunders et al., 2009).
In this thesis, the chosen countries were the sample will be extracted from are Sweden and Lithuania. Both countries are located in the northern part of Europe (United Nations Statistics Division (UNSD), 2019). UNSD classifies both of the countries as more developed regions; and both are members of the European Union. What can affect the size of the sample is first of all, that in 2018 the population of Lithuania was approximately 2,8 million people with over 10,1 million people living in Sweden (Eurostat, 2019). The sex ratio in Lithuania was measured to be 0,86 male/female in 2016 and 1 male/female in Sweden. To add, because the survey is online and the examined company is closely related with internet usage, it is important to mention the difference in this aspect as well. In 2016 it was found that 93% of the Swedish population uses internet, whilst in Lithuania the number drops to 77,2% (Internet Live Stats, 2019). This signifies that the response rate in Lithuania could be significantly lower. Moreover, the researchers originate from the targeted countries which also aids in finding respondents to fill in the questionnaire which contributes to the suitability of the chosen nations.
Furthermore, the research will be conducted in the gaming equipment industry, therefore the desired respondents who the researchers are targeting are gamers of all genders. The choice of targeting the gaming community is due to the fact that they are more likely to be knowledgeable about the brand and hence, have increased insight and a clearer perception of it. Both of the researchers have connections with people that belong to this subculture and access to their forums and social media groups. The respondents will be
found in groups created on social media platforms by gamers, for gamers. Since the internet consists of a plentiful number of groups made for gamers, it is unrealistic to publish the survey in each group which concludes that all gamers do not have an equal chance of participating in the answering of the questionnaire, further justifying the non-probability method of sampling (Saunders & Lewis, 2012). When conducting research using non-probability sampling, there is no regulation regarding the preferred size of the sample (Saunders et al., 2009). Moreover, the size of the sample increases as a dependency on the amount of variables being analyzed (Wilson Van Voorhis & Morgan, 2007). The higher the amount of the respondents, the greater of representation of the population will be (Marcoulides, 1993). The authors concluded that a sample size of 200 Swedes and 56 Lithuanians would be deemed sufficient for the study as such figures would mirror the population difference between the two nations, hence, represent the respondents opinions in a just manner.
3.4 Questionnaire design
Sanders et al, (2009) defines research strategy as a plan of action that is implemented for the purpose of achieving the author’s goals. In other words, it is how they will answer the research question. The research strategy of this paper is a survey that is going to be carried out online in Lithuania and Sweden. An internet-mediated, self-administered questionnaire will be distributed on Facebook and Discord groups (i.e. League of Legends Sverige or CS: GO Lithuania) where gamers are usually active. Before the “click” on the survey, there is going to be a disclaimer that the survey is intended for gamers who are aware of Razer, together with a short message encouraging the respondents.
Furthermore, the questions are only answerable if the respondent have knowledge of Razer’s existence. The reason behind it being an online survey (not handed out in paper) is that of ensuring control over the questionnaire. Some questions, such as “Are you familiar with the brand Razer?” if answered negatively, will not lead to questions further examining their knowledge of the brand. Moreover, an online survey has the potential to reach a much wider audience, because of the target group being so involved in the digital space.
Survey, as a research strategy can consist of two types of questions, either open-ended or closed questions (Pallant, 2016). In this survey, closed questions will be used, which means that that the respondents will be provided with predetermined response choices. The choices will vary from Yes/No, age and gender questions, to ones that have a range of scores from low to high (i.e. strongly agree to strongly disagree). The questionnaire can be found in Appendix 1. The software used to develop and distribute the questionnaire is Qualtrics and the data will then be extracted to Excel and SPSS.
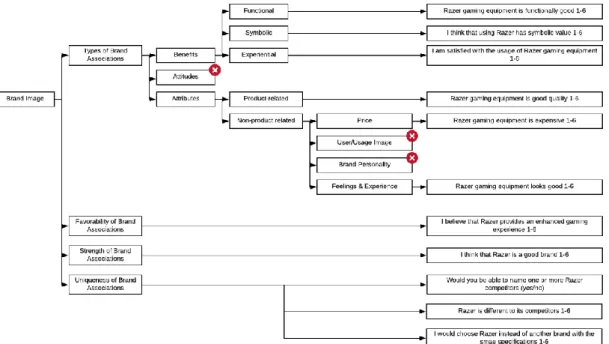
The following figures (Figure 3 & 4) present how the questions were developed from Keller’s brand personality model (Keller, 1991) together with demographics, which were location, gender and age. They provide a roadmap of how each of the questions came to be and which specific aspect of the model is covered. Each group of questions (except “Would you be able to name one or more of Razer competitors?”) starts with an introductory scale which reads “To what extent do you agree with the following statements (1 – fully disagree, 2 – disagree, 3 – somewhat disagree, 4 – somewhat agree, 5 – agree, 6 – fully agree)”. Figures 3 and 4 should be read while taking into account this introductory message.
Figure 4: Brand Image questions;
3.5 Reliability
According to Pallant (2016) reliability of a scale indicates how free it is from random error. Two indicators that are most frequently used are the test-retest reliability (or temporal stability) and the internal consistency. The indicator applicable in this paper is the internal consistency which shows the degree to which items that make up the scale measure the same attribute that is underlined (Pallant, 2016). In other words, it is the consistency of people’s responses across the items. The statistic used in this paper will be the Cronbach’s coefficient alpha and it provides an indication of the average correlation of the items that constitute the scale. Whilst the values vary from 0 to 1, the higher the value in the scale, the higher the reliability (Pallant, 2016). It is generally suggested that as long as alpha is higher 0,7, the items measure the same concept and are considered reliable. Data collected in this analysis is presented in Table 1. The calculated Cronbach’s coefficient alpha was found to be 0,857 and proved the questions suitable; on the other hand, the “Cronbach's alpha if item deleted” showed slight increase in 4 of the questions. In such cases, sometimes it is suggested to remove such questions from the research, although in this case, the variations are only slight and all of them are exceeding the 0,7 point, therefore they will be left for further analysis.
Table 1: Cronbach’s Alpha (reliability) test Scale Mean if Item Deleted Scale Variance if Item Deleted Corrected Item-Total Correlation Squared Multiple Correlation Cronbach's Alpha if Item Deleted Aware of existence of GE 46,77 141,726 ,198 ,581 ,863 Aware of Razer 46,87 139,260 ,267 ,593 ,861 GE is good quality 48,07 115,884 ,778 ,760 ,828 Expensive equipment 47,70 147,985 -,052 ,137 ,878 GE looks good 47,50 119,130 ,691 ,505 ,835 GE is good functionally 47,74 118,429 ,767 ,735 ,830
Satisfied with usage of GE 48,03 111,546 ,809 ,767 ,824
Symbolic value 49,08 133,200 ,310 ,192 ,862
Enhanced gaming exp 48,85 122,144 ,694 ,579 ,836
Good brand 48,27 120,165 ,792 ,728 ,830
Different to competitors 48,11 128,786 ,424 ,253 ,854
Choice of Razer among others 48,99 115,111 ,635 ,533 ,839
3.6 Validity
Validity of a scale refers to the extent to which the scores from a measure represent the variable they are supposed to. Unlike reliability, validity does not have a specific scale that measures it precisely, in other words, there is no clear-cut indicator for it (Pallant, 2016). According to Pallant, validity of a scale involves the collection of empirical evidence concerning its use and there are three main types of it: content, criterion and construct validity (2016). Content validity refers to the degree to which the measurement questions provide adequate coverage of the investigative questions (Saunders et. al, 2009). Content validity in this research is relatively high, as most of the questions included in the questionnaire are derived from a peer reviewed and well acknowledged classic model. The rest cover demographic factors, which have been suggested by previous research. Criterion validity concerns whether a statistical test may obtain correct predictions regarding values in the future. These values regard dependent values given observations of independent variables and expresses the likelihood that the same results would be obtained and is proven by future observations of the criterions (Duignan, 2016). Criterion validity in this research is debatable due to the unknown size of the population, thus, even though the sample size is of considerable size, it is not possible to calculate or
predict its representation of the population with certainty. Furthermore, the lack of participants representing the females in the sample also affect the criterion validity as time constraints prevent the researchers from conducting an identical study in the future to compare results. Construct validity refers to what degree the constructs measures what it is intended to. This includes variables which there might not be any direct or generally available scales to measure or for variables not commonly directly available for observation (ex: opinions regarding price, functionality) (Duignan, 2016). In this research, the construct validity is deemed high since the dimensions of brand knowledge model created by Keller measures Brand knowledge, which includes the construct the authors intend to address. Furthermore, the survey which were used as a tool to measure the constructs and hence, answer the research purpose which was created by deriving questions from sections of the model.
3.7 Ethical considerations
It is acknowledged that ethics in research is important, and one of the main ethical factors to consider is it being voluntary, anonymous and confidential (Collis & Hussey, 2014). The survey had a disclaimer above the link to the survey that introduced the respondents to what it is about, what their data is going to be used for and that their responses are going to be kept securely to ensure confidentiality. Voluntarity is yet another factor that is vital for research involving humans (Perrault & Keating, 2018), which was ensured by receiving informed consent from the respondents by the action of clicking the survey after having read the disclaimer. All the participants had a full right to their privacy, with the academic purpose of the research clearly explained and their responses being anonymous (no identifiable custom data). Saunders et al. (2009) also identified a number of general ethical issues that might occur at different stages of the research, which are “privacy, voluntary nature, consent, deception, confidentiality, anonymity, embarrassment, stress, harm, discomfort, objectivity, the quality of research“(Saunders et al., 2009). Therefore, throughout the entire process of the survey, the respondents had a chance to withdraw at any time, as it was an online survey. In fact, such cases occurred and the unfinished data was not used for analysis. This should have resulted in a minimization of potential stress and discomfort one might endure and therefore, provided the respondent with an increased focus and enhanced comprehension of the questions that are to follow. Finally, the thesis was not financially funded by Razer or any other company, it was entirely under
the control of the researchers which is an indication that the research was not affected by any other parties.
4. Empirical Findings
In this chapter, empirical findings of the research are presented in text, tables and graphs. The findings are separated into two sections - dependent and independent questions for clearer distinction before the analysis. This section provides a clear understanding of what the dataset looks like and what responses were the most common. The findings function as an aid to enhanced understanding of the topic in question as well as a contribution towards answering the hypotheses.
______________________________________________________________________
4.1 Background of respondents
The initial desired sample size was set by the authors to 200 Swedish respondents and 56 Lithuanian respondents, however the sample size ended up consisting of 541 participants (Table 2). The division of respondents between the two nations ended up being Swedes (387) and Lithuanians (154), which quite accurately mirrors the size of the country population (Eurostat, 2019).
Table 2: Nationality data;
# Answer % Count
1 Sweden 71.53% 387
2 Lithuania 28.47% 154
Total 100% 541
The gender of the respondents, as expected from the gamer community, was predominantly male, constituting of approximately 85% of all of the responses (Figure 5). Approx. 13% of the respondents were female and approx. 2% identified themselves as other.
Figure 5: Gender data;
The age of the respondents had a fairly big spread, although most of the respondents were born between 1987 and 2004 (Figure 6). The average birth year of a respondent in this research was 1997, which would make the respondent 22 years old this year.
Figure 6: Birth year data;
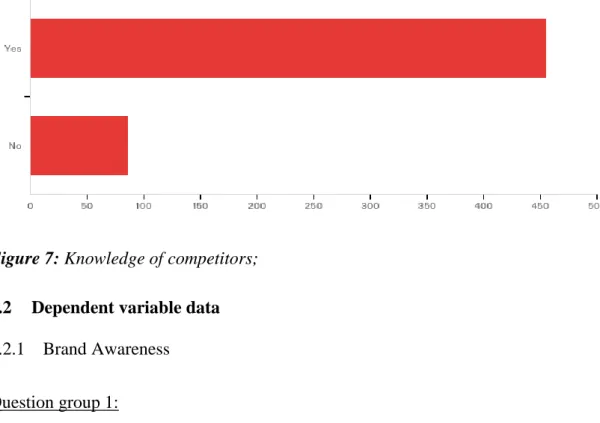
The 7th question of the survey included a question whether respondents would be able to name one or more of Razer’s competitors, which yielded a number of 455 respondents capable of doing so (Figure 7). The people who chose “no” for an answer were moved
directly to the end of the survey, as they would not be able to answer the questions regarding the competitors (15,90% of the respondents).
Figure 7: Knowledge of competitors;
4.2 Dependent variable data
4.2.1 Brand Awareness Question group 1:
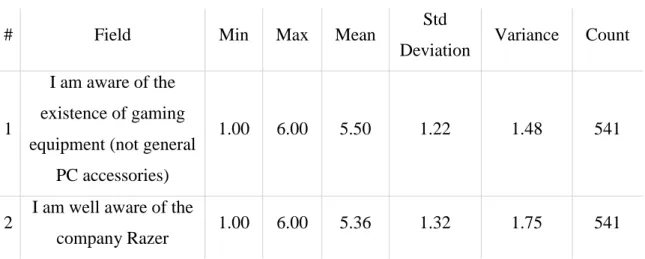
When answering questions about brand awareness, a high majority of the respondents were aware of both Razer and general gaming equipment (Figure 8). This could have been due to the disclaimer before opening the survey that one must be familiar with the brand at least to some extent. The scale question was: “To what extent do you agree with the following statements (1 - fully disagree, 2 - disagree, 3 - somewhat disagree, 4 - somewhat agree, 5 - agree, 6 - fully agree)”. The mean of 5,50 when answering the question regarding the knowledge of general gaming equipment shows that the respondents almost fully agreed with the statement (closest to 6 in the scale) (Table 3). Whilst when answering about awareness of Razer as a company, the mean turned out to be 5,36 showing that people mostly agreed with the statement (5 in the scale).
Table 3: Brand Awareness;
# Field Min Max Mean Std
Deviation Variance Count
1
I am aware of the existence of gaming equipment (not general
PC accessories)
1.00 6.00 5.50 1.22 1.48 541
2 I am well aware of the
company Razer 1.00 6.00 5.36 1.32 1.75 541
4.2.2 Brand Image
The following questions (depicted in Table 4, 5, 6 and Figure 9, 10, 11) were all related to the brand image aspect of the Keller´s model (1993). Each of them started with the same introductory message of: “To what extent do you agree with the following statements (1 - fully disagree, 2 - disagree, 3 - somewhat disagree, 4 - somewhat agree, 5 - agree, 6 - fully agree)”. Brand image data is significantly more spread out than the data regarding awareness. Certain connections, i.e. Razer not being perceived as very different from its competitors can be pointed out but generally the results differ throughout the entire scale as can be seen in data below.
Question group 2:
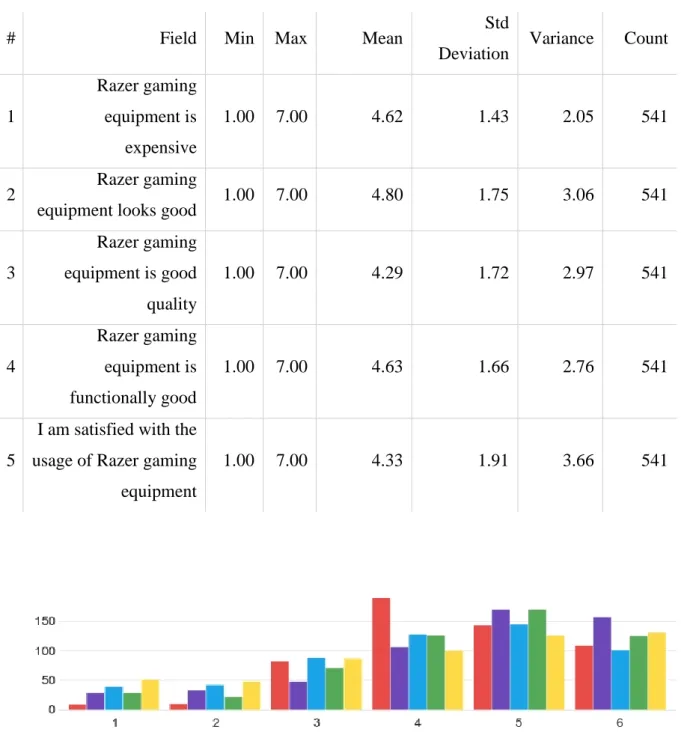
From Table 4 it can be seen that the mean of how expensive Razer equipment is perceived to be is 4,62 which shows that the brand could be considered to have quite a premium price (a full 5 being “agree” to the statement). The data also shows that Razer equipment is perceived to look good, with a mean of 4,80 (closest to agreeing that the equipment looks good). Whilst answering about quality, respondents were closest to “somewhat agree” when given the question, with a mean of 4,29. Functionality was generally closer to “agree” with a mean of 4,63. And finally, the satisfaction of the usage of Razer gaming equipment has a mean of 4,33, meaning that in average respondents only somewhat agree with the statement. Figure 9a depicts the overall view of the responses, showing that respondents were the most consistent when answering about the brand image of Razer
GE. What is important to point out in the case of this question, is that as shown in Figure 9b, respondents from Sweden perceive Razer equipment less expensive than Lithuanians.
Table 4: Brand Image (expensiveness, looks, quality, functionality, satisfaction);
# Field Min Max Mean Std
Deviation Variance Count
1 Razer gaming equipment is expensive 1.00 7.00 4.62 1.43 2.05 541 2 Razer gaming
equipment looks good 1.00 7.00 4.80 1.75 3.06 541
3 Razer gaming equipment is good quality 1.00 7.00 4.29 1.72 2.97 541 4 Razer gaming equipment is functionally good 1.00 7.00 4.63 1.66 2.76 541 5
I am satisfied with the usage of Razer gaming equipment
1.00 7.00 4.33 1.91 3.66 541
Figure 9b: Brand Image (expensiveness extracted in regards to nationality);
Question group 3:
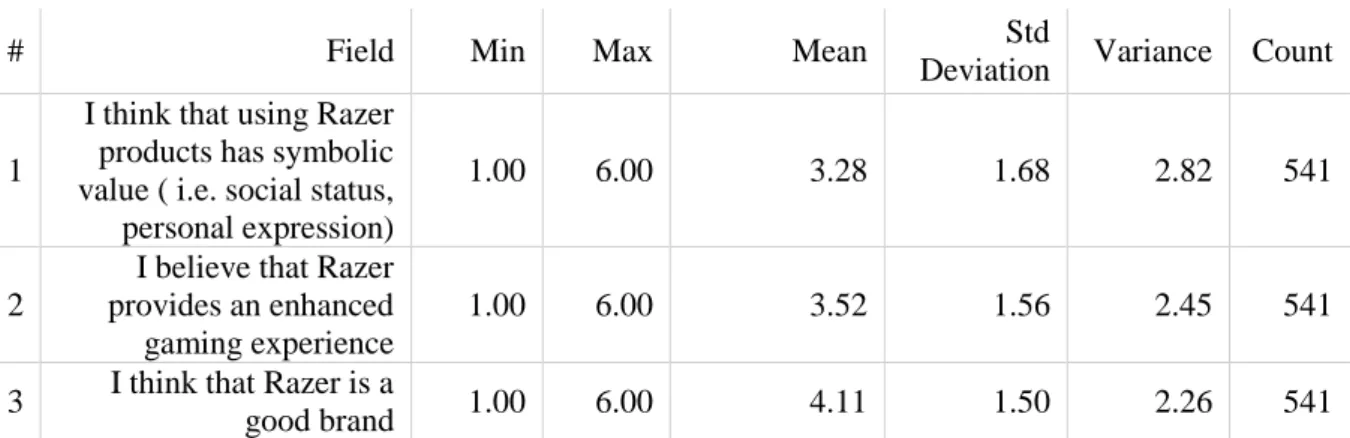
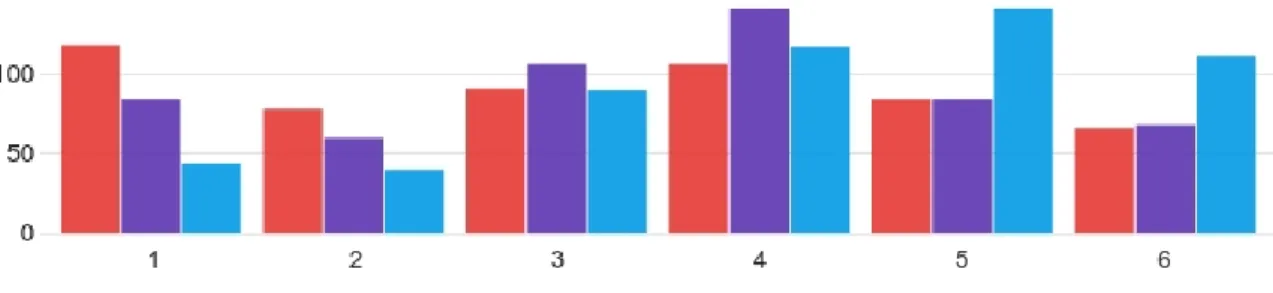
From Table 5 it can be seen that the respondents tend to somewhat disagree about Razer products having a symbolic value, with a mean of 3,28. When asked about whether they agree about Razer providing an enhanced gaming experience, respondents settled with a mean of 3,52 which is almost perfectly located in the middle of the scale, showing that there is no clear negative or positive opinion for that question. Finally, the mean for seeing Razer as a good brand shows that in average, respondents somewhat agree with the statement. Figure 10 shows that the spread of the responses is quite extensive and on this question group with no clear “popular” response.
Table 5: Brand Image (symbolic value, enhanced gaming experience, good brand);
# Field Min Max Mean Std
Deviation Variance Count
1
I think that using Razer products has symbolic value ( i.e. social status, personal expression)
1.00 6.00 3.28 1.68 2.82 541
2
I believe that Razer provides an enhanced gaming experience
1.00 6.00 3.52 1.56 2.45 541
3 I think that Razer is a
good brand 1.00 6.00 4.11 1.50 2.26 541
Figure 10: Brand Image (symbolic value, enhanced gaming experience, good brand);
Question group 4:
From Table 6, it can be seen that when asked whether Razer is different to its competitors, respondents had an average opinion of somewhat agreeing with the statement (mean of 4,25). Whilst for the question whether they would choose Razer instead of another brand with the same specifications had a mean of 3,37 showing that the respondents somewhat disagree to the statement but the responses tend to go towards being neutral. In Figure 11 it can be seen that not many of the respondents saw a significant (5 or 6) difference between Razer and their competition.
Table 6: Brand Image (different to competitors, choice instead of competitors);
# Field Min Max Mean Std
Deviation Variance Count 1 Razer is different to its
competitors 1.00 7.00 4.25 1.71 2.91 443
2
I would choose Razer instead of another brand with the same specifications
Figure 11: Brand Image (different to competitors, choice instead of competitors);
5. Analysis & Interpretation
In this section, findings analyzed with SPPS are presented and explained. Linear multiple regression has been applied and the hypotheses were either rejected or supported in accordance to the data.
______________________________________________________________________
5.1 Introduction
Before the start of the analysis, the responses were cleared out of inaccuracies and tested for reliability. 98% of the surveys started were completed and the data from the remaining 2% were not used. Moreover, because the method used to analyze the data was multiple regression, there were certain assumptions to be met before the data could be presented. In Appendix 2, scatter plots and normal p-plots are presented for each of the dependent questions. A linear relationship between the variables was visible and there were no significant outliers. Finally, the data showed homoscedasticity, as the data remains similar when moving along the line.
5.2 Multicollinearity tests
The researchers did not find any multicollinearity among the independent variables (no linearity in the scatterplots), which could have possibly caused issues with the regression developed consequently. In extracted correlations, no significant “red flags” were noticed either, which further confirmed what was found in the scatterplots (Table 7).
Table 7: Correlations;
Correlations
Country Gender Birth year Country Pearson Correlation 1 .088* .259**
Sig. (2-tailed) .042 .000 N 540 540 540 Gender Pearson Correlation .088* 1 -.090*
Sig. (2-tailed) .042 .037 N 540 540 540 Birth year Pearson Correlation .259** -.090* 1
Sig. (2-tailed) .000 .037
N 540 540 540 *. Correlation is significant at the 0.05 level (2-tailed).
**. Correlation is significant at the 0.01 level (2-tailed).
5.3 Hypothesis tests
For this research, multiple regressions were conducted for each of the dependent variables. A significance level of α= 0.05 was used in order to make a decision whether the research hypotheses were rejected or not.
5.3.1 Brand Recall
h0: Brand recall does not differ in respect to demographic factors; h1: Brand recall differs in respect to demographic factors;
The ANOVA test for brand recall proved it to be significant, therefore the model could be used for further analysis (Table 8). The country of the respondents seemed to make a difference on brand recall with a significance level of 0,000 whilst both gender and birth year are 0,505 and 0,137 accordingly, that is more than the alpha of 0,05 (Table 9).
Therefore, even though gender proved to influence whether the respondents are aware of gaming equipment, the other two variables proved the research hypothesis to be rejected.
Table 8: ANOVA test of Brand Recall;
ANOVAa Model Sum of Squares df Mean Square F Sig. 1 Regression 28,792 3 9,597 6,662 ,000b Residual 772,208 536 1,441 Total 801,000 539
a. Dependent Variable: Aware of existence of GE; b. Predictors: (Constant), Birth year, Gender, Country
Table 9: Coefficients of Brand Recall;
Coefficientsa Model Unstandardized Coefficients Standardized Coefficients t Sig. B Std. Error Beta 1 (Constant) -14,725 14,062 -1,047 ,296 Country -,512 ,119 -,190 -4,291 ,000 Gender -,084 ,125 -,029 -,667 ,505 Birth year ,011 ,007 ,066 1,489 ,137 a. Dependent Variable: Aware of existence of GE
5.3.2 Brand Recognition
h0: Brand recognition does not differ in respect to demographic factors; h2: Brand recognition differs in respect to demographic factors;
The ANOVA test for brand recognition proved it to be significant, therefore the model could be used for further analysis (Table 10). The country variable had a significance level of 0,000 (<0,05), the gender variable was on 0,003 (<0,05) and the birth year had a significance level of 0,009 (<0,05) (Table 11). This meant that the research hypothesis (h2) was supported, proving that nationality, age and gender in fact do have an impact on how a person recognized the brand Razer.
Table 10: ANOVA test of Brand Recognition;
ANOVAa Model Sum of Squares df Mean Square F Sig. 1 Regression 60,376 3 20,125 12,156 ,000b Residual 887,358 536 1,656 Total 947,733 539
a. Dependent Variable: Aware of Razer; b. Predictors: (Constant), Birth year, Gender, Country
Coefficientsa Model Unstandardized Coefficients Standardized Coefficients t Sig. B Std. Error Beta 1 (Constant) -32,936 15,074 -2,185 ,029 Country -,589 ,128 -,201 -4,604 ,000 Gender -,395 ,134 -,124 -2,940 ,003 Birth year ,020 ,008 ,114 2,617 ,009 a. Dependent Variable: Aware of Razer
5.3.3 Brand Benefits
h0: Brand benefits do not differ in respect to demographic factors; h3: Brand benefits differs in respect to demographic factors;
The ANOVA tests for 2 of the brand benefit aspects proved the model to not be significant, with significance levels being 0,284 & 0,067 (both > 0,05) (Table 12 & 15). For the question b (Razer equipment has a symbolic value), the ANOVA test proved the model to be significant (Table 13). As seen in Table 14, both country and gender had an effect on people’s attitude towards symbolic value of Razer, yet birth year appeared to be insignificant (sig. 0,167). Overall, the research hypothesis was rejected in the case of this question.
Table 12: ANOVA test of functionality;
ANOVAa
Model
Sum of
Squares df Mean Square F Sig. 1 Regression 10.528 3 3.509 1.269 .284b
Residual 1481.909 536 2.765 Total 1492.437 539
a. Dependent Variable: GE is good functionally; b. Predictors: (Constant), Birth year, Gender, Country.
b) Razer gaming equipment has symbolic value;
Table 13: ANOVA test for symbolic value;
ANOVAa
Model
Sum of
Squares df Mean Square F Sig. 1 Regression 75.387 3 25.129 9.309 .000b
Residual 1446.946 536 2.700 Total 1522.333 539
a. Dependent Variable: Symbolic value; b. Predictors: (Constant), Birth year, Gender, Country;
Table 14: Coefficients for symbolic value;
Coefficientsa Model Unstandardized Coefficients Standardized Coefficients t Sig. B Std. Error Beta 1 (Constant) -24.646 19.249 -1.280 .201 Country .639 .163 .172 3.916 .000 Gender .383 .172 .095 2.235 .026 Birth year .013 .010 .061 1.383 .167
c) Satisfaction with the usage of Razer gaming equipment;
Table 15: ANOVA test for satisfaction of usage;
ANOVAa
Model
Sum of
Squares df Mean Square F Sig. 1 Regression 26.220 3 8.740 2.397 .067b
Residual 1954.112 536 3.646 Total 1980.331 539
a. Dependent Variable: Satisfied with usage of GE; b. Predictors: (Constant), Birth year, Gender, Country.
5.3.4 Product related brand attributes
h0: Product related brand attributes do not differ in respect to demographic factors; h4: Product related brand attributes differ in respect to demographic factors;
The ANOVA test proved this part of the model to be insignificant (Table 16), therefore the data gathered in the coefficient section is now irrelevant and the research hypothesis is rejected.
Table 16: ANOVA test for the quality;
ANOVAa
Model
Sum of
Squares df Mean Square F Sig. 1 Regression 12.034 3 4.011 1.348 .258b
Residual 1594.475 536 2.975 Total 1606.509 539
a. Dependent Variable: GE is good quality; b. Predictors: (Constant), Birth year, Gender, Country
5.3.5 Non-product related brand attributes
h0: Non-product related brand attributes do not differ in respect to demographic factors; h5: Non-product related brand attributes differ in respect to demographic factors;
The ANOVA test had a significance level of 0,000 which proved the model to be significant (Table 17) and allowed the researchers to look into the coefficients. Both country and gender (0,000 & 0,010) showed that they affect the perception of the expensiveness of the equipment, yet the birth year (with a significance level of 0,842) did not have an impact (Table 18). Therefore, overall the research hypothesis was rejected.
Table 17: ANOVA test for the expensiveness;
ANOVAa
Model
Sum of
Squares df Mean Square F Sig. 1 Regression 81.461 3 27.154 14.200 .000b
Residual 1024.976 536 1.912 Total 1106.437 539
a. Dependent Variable: Expensive equipment; b. Predictors: (Constant), Birth year, Gender, Country;
Table 18: Coefficient test for the expensiveness;
Coefficientsa Model Unstandardized Coefficients Standardized Coefficients t Sig. B Std. Error Beta 1 (Constant) .785 16.201 .048 .961 Country .810 .137 .255 5.895 .000 Gender -.374 .144 -.109 -2.591 .010 Birth year .002 .008 .009 .199 .842
5.3.6 Favourability of brand associations
h0: Favorability of brand associations does not differ in respect to demographic factors; h6: Favorability of brand associations differs in respect to demographic factors;
The ANOVA test for this aspect of the research showed significance of 0,005 (Table 19) which showed the model was significant, as it is lower than the alpha of 0,05. When looking at the coefficients, it was apparent that the results only differed in regard to country (sig. 0,007), whilst both gender (0,088) and birth year (0,555) significance levels were higher than 0,05 (Table 20), therefore, h6 was rejected.
Table 19: ANOVA test for the enhanced gaming experience;
ANOVAa
Model
Sum of
Squares df Mean Square F Sig. 1 Regression 31.054 3 10.351 4.302 .005b
Residual 1289.855 536 2.406 Total 1320.909 539
a. Dependent Variable: Enhanced gaming exp.; b. Predictors: (Constant), Birth year, Gender, Country.
Table 20: Coefficients for the enhanced gaming experience;
Coefficientsa Model Unstandardized Coefficients Standardized Coefficients t Sig. B Std. Error Beta 1 (Constant) -8.105 18.174 -.446 .656 Country .417 .154 .120 2.708 .007 Gender .277 .162 .074 1.712 .088 Birth year .005 .009 .026 .591 .555 a. Dependent Variable: Enhanced gaming exp
5.3.7 Strength of brand associations
h0: Strength of brand associations does not differ in respect to demographic factors. h7: Strength of brand associations differs in respect to demographic factors;
The ANOVA test proved this part of the model to be insignificant, therefore the data gathered in the coefficient section was then irrelevant and the research hypothesis was rejected (Table 21).
Table 21: ANOVA test of whether the brand is perceived as good;
ANOVAa
Model
Sum of
Squares df Mean Square F Sig. 1 Regression 5.583 3 1.861 .820 .483b
Residual 1216.188 536 2.269 Total 1221.770 539
a. Dependent Variable: Good brand; b. Predictors: (Constant), Birth year, Gender, Country.
5.3.8 Uniqueness of brand associations
h0: Uniqueness of brand associations does not differ in respect to demographic factors; h8: Uniqueness of brand associations differs in respect to demographic factors;
The significance levels of the ANOVA tests of both parts of this question showed that the model was significant (0,021<0,05 and 0,13<0,05) (Table 22 & Table 24). When looking at the coefficient tables on the other hand, it was visible that only gender had an impact on this question of the research (Table 23 & Table 25). Both country and birth year proved
to be insignificant (alpha higher than 0,05), therefore the research hypothesis was rejected.
a) Different to competitors
Table 22: ANOVA test of whether the brand is perceived different to its competitors;
ANOVAa
Model
Sum of
Squares df Mean Square F Sig. 1 Regression 28.240 3 9.413 3.269 .021b
Residual 1261.380 438 2.880 Total 1289.620 441
a. Dependent Variable: Different to competitors; b. Predictors: (Constant), Birth year, Gender, Country.
Table 23: Coefficients for whether the brand is perceived different to its competitors;
Coefficientsa Model Unstandardized Coefficients Standardized Coefficients t Sig. B Std. Error Beta 1 (Constant) -14.006 22.671 -.618 .537 Country .213 .188 .056 1.132 .258 Gender .538 .207 .123 2.594 .010 Birth year .009 .011 .037 .765 .445 a. Dependent Variable: Different to competitors
b) Choice of Razer instead of another brand with the same specifications;
Table 24: ANOVA test of choice of Razer among other brands;
ANOVAa
Model
Sum of
Squares df Mean Square F Sig. 1 Regression 47.657 3 15.886 3.658 .013b
Residual 1901.999 438 4.342 Total 1949.656 441
a. Dependent Variable: Choice of Razer among others; b. Predictors (Constant), Birth year, Gender, Country
Table 25: Coefficients for choice of Razer among other brands;
Coefficientsa Model Unstandardized Coefficients Standardized Coefficients t Sig. B Std. Error Beta 1 (Constant) -8.439 27.839 -.303 .762 Country .115 .231 .024 .497 .619 Gender .807 .254 .151 3.172 .002 Birth year .005 .014 .019 .385 .700 a. Dependent Variable: Choice of Razer among others
5.4 Summary
After testing the research hypotheses, 7 of them were rejected and 1 was supported as depicted in Table 26.
Table 26: Research hypotheses
h1: Brand recall differs in respect to demographic factors; Rejected
h2: Brand recognition differs in respect to demographic factors; Supported
h3: Brand benefits differs in respect to demographic factors; Rejected
h4: Product related brand attributes differ in respect to demographic factors; Rejected
h5: Non-product related brand attributes differ in respect to demographic factors; Rejected h6: Favourability of brand associations differs in respect to demographic factors; Rejected h7: Strength of brand associations differs in respect to demographic factors; Rejected