AGGREGATE RESOURCE ASSESSMENT FOR THE LA POSTA BAND OF MISSION INDIANS RESERVATION,
SAN DIEGO COUNTY, CALIFORNIA
by
ii
A thesis submitted to the Faculty and the Board of Trustees of the Colorado School of Mines in partial fulfillment of the requirements for the degree of Master of Science (Geological Engineering).
Golden, Colorado Date______________ Signed: ______________________ Dawn A. Schippe Approved:____________________ Dr. Jerry D. Higgins Thesis Advisor Golden, Colorado Date______________ ____________________________ Dr. Murray Hitzman Professor and Head Department of Geology and Geological Engineering
iii ABSTRACT
This investigation centers on an evaluation of both decomposed granite (DG) and crushed rock resources on the La Posta Band of Mission Indians Reservation in San Diego County, California. The quality and quantity of the potential aggregate sources are also estimated. The material studied is the Tonalite of La Posta, a hornblende-biotite tonalite emplaced during the Cretaceous Period.
Physical and geochemical testing of both surface and subsurface samples assessed the quality of the material. Subsurface samples showed significant differences in the physical testing results due to the two different drilling methods employed: sonic and wireline core. Overall, the DG fulfills the Caltrans requirements for class 2 base and all classes of subbase, with a potential for increasing the value of the material through processing, such as washing and screening. Crushed rock resources do not meet the specifications for Portland cement concrete or asphaltic concrete aggregate but may be blended with the DG to improve the quality of the base and subbase material.
Geochemical analyses of both the DG and the rock indicate no high concentrations of elements that would be deleterious to the environment.
Quantity of DG within the study area was explored through seismic refraction and drilling and then a three-dimensional computer model was created to obtain a volume estimate. For this part of the project, the primary characteristic evaluated was the thickness of the rippable layer of decomposed rock, since this essentially identifies the amount of DG available for mining. Results from the refraction surveys show variations in the thickness of rippable DG across the study area, estimated from 15 feet to over 100 feet. The drilling program confirmed these results and provided additional depth
information in areas where refraction was not performed. From modeling, there is a total of 31.6 million tons of DG present within the study area.
iv
TABLE OF CONTENTS
ABSTRACT... iii
LIST OF FIGURES ... viii
LIST OF TABLES... xiii
LIST OF APPENDICES... xv
LIST OF PLATES ... xvi
ACKNOWLEDGMENTS ... xvii
LIST OF ABBREVIATIONS... xviii
CHAPTER 1 INTRODUCTION ... 1
1.1 Purpose of Study ... 1
1.2 Location ... 1
1.3 Aggregate in Southern California ... 3
1.4 Scope of Work ... 6
CHAPTER 2 BACKGROUND INFORMATION ... 9
2.1 Previous Work ... 9
2.2 Geologic Setting... 10
2.3 The La Posta Pluton... 12
CHAPTER 3 METHODS ... 16
3.1 Literature Review... 16
3.2 Mapping and Surface Sampling... 16
3.3 Seismic Refraction... 17
3.4 Drilling... 20
3.4.1 Sonic Drilling... 22
v
3.5 Core Logging ... 24
3.6 Rock Quality Designation... 26
3.7 Physical Testing and Standards for Decomposed Granite... 27
3.7.1 Gradation... 29
3.7.2 Sand Equivalent ... 31
3.7.3 Durability Index... 31
3.7.4 Specific Gravity and Absorption – Coarse and Fine ... 34
3.7.5 R-Value ... 35
3.7.6 Organic Impurities ... 35
3.8 Physical Testing and Standards for Crushed Rock ... 36
3.8.1 Los Angeles (LA) Abrasion... 37
3.8.2 Sodium Sulfate Soundness... 38
3.9 Geochemical Analysis ... 39
3.9.1 34 Element Analysis ... 40
3.9.2 Whole Rock Analysis ... 41
3.10 Petrographic Analysis ... 42
3.11 Resource Modeling ... 42
CHAPTER 4 RESULTS... 44
4.1 Mapping and Surface Sampling... 44
4.2 Seismic Refraction... 50
4.3 Drilling... 55
4.3.1 Sonic Drilling... 55
4.3.2 Wireline Core Drilling ... 58
4.4 Core Logging ... 58
4.5 Rock Quality Designation... 59
4.6 Physical Testing and Standards for Decomposed Granite... 61
4.6.1 Gradation... 62
4.6.2 Sand Equivalent ... 64
vi
4.6.4 Specific Gravity and Absorption ... 67
4.6.5 R-Value ... 69
4.6.6 Organic Impurities ... 70
4.7 Physical Testing and Standards for Crushed Rock ... 71
4.7.1 Los Angeles (LA) Abrasion... 71
4.7.2 Sodium Sulfate Soundness... 72
4.8 Geochemical Analysis ... 73
4.8.1 34 Element Analysis ... 76
4.8.2 Whole Rock Analysis ... 78
4.9 Petrographic Analysis ... 78
4.10 Modeling... 82
CHAPTER 5 DISCUSSION OF RESULTS ... 83
5.1 Surface Sampling... 83
5.2 Seismic Refraction... 86
5.3 Core Logging ... 88
5.4 Rock Quality Designation... 91
5.5 Physical Testing and Standards for Decomposed Granite... 91
5.5.1 Gradation... 92
5.5.2 Sand Equivalent ... 93
5.5.3 Durability Index... 94
5.5.4 Specific Gravity and Absorption ... 94
5.5.5 R-Value ... 95
5.5.6 Organic Impurities ... 95
5.5.7 Comparison of Seismic Velocity with DG Testing Results... 96
5.5.8 Influence of Major Joint Sets on DG ... 96
5.6 Physical Testing and Standards for Crushed Rock ... 98
5.6.1 Los Angeles (LA) Abrasion... 98
5.6.2 Sodium Sulfate Soundness... 99
5.6.3 Comparison of Seismic Velocity with Crushed Rock Testing Results... 99
vii
5.7.1 34 Element Analysis ... 100
5.7.2 Whole Rock Analysis ... 101
5.8 Petrographic Analysis ... 101 5.9 Modeling... 102 CHAPTER 6 CONCLUSIONS ... 103 CHAPTER 7 RECOMMENDATIONS... 105 REFERENCES CITED... 107 BIBLIOGRAPHY... 111 APPENDICES ... CD in pocket PLATE 1: Geologic Map...Pocket PLATE 2: Study Area, Subsurface Exploration, and Cross-Sections ...Pocket
viii
LIST OF FIGURES
Figure 1.1: Location of the Thirty Mission Indian Reservations within five counties in Southern California... 2 Figure 1.2: Central valley of the La Posta Band of Mission Indians Reservation.
Typically residual boulders are exposed on prominent ridges and mountaintops, scrub brush covers moderately sloping hillsides, and oak trees grow along major drainages. ... 3 Figure 1.3: Location of study area (shown in blue) within the La Posta Band of Mission
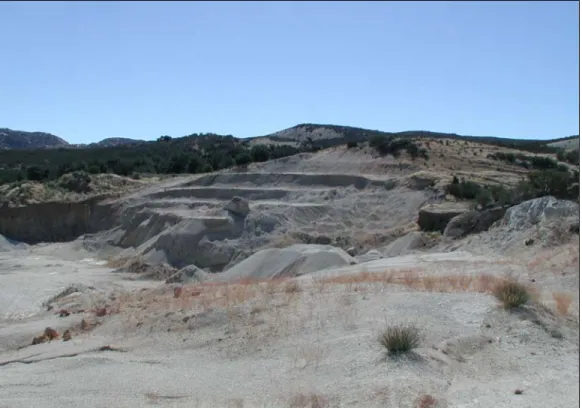
Indians Reservation in relation to existing pit and I-8... 4 Figure 1.4: Benches on the south side of the inactive Sand Pit. All material previously
excavated was “ripped” with a track-hoe. Note unweathered boulder protruding from the center of the ripped face. ... 7
Figure 2.1: Western (>100 Ma) and eastern (<100 Ma) zones of the PRB in San Diego County separated by the red boundary line (modified after
Walawender, 2000). The La Posta Band of Mission Indians Reservation (LPBMIR) is located in the eastern zone...12 Figure 2.2: Concentric zonations within the La Posta pluton in San Diego and
Imperial Counties, California, and Mexico (after Smith, 2002) ...14
Figure 3.1: Sledge hammer impact on a steel plate was used as the seismic energy source for the geophysical surveys. Photograph shows LP-S5 location and computer used for data collection ...19 Figure 3.2: At LP-S4, a Brunton pocket transit (compass) and survey staff were
used to measure elevation changes ...20 Figure 3.3: Sonic drilling sample being extruded from sampling tube ...23
ix
Figure 3.4: Core drilling of an angled hole DH-A...24 Figure 3.5: Sand equivalent test on surface sample LP14 ...32 Figure 3.6: Los Angeles abrasion machine...38
Figure 4.1: Clay seams along the southeastern wall of the Sand Pit, hammer for scale. Also visible are tooth marks made by ripping during the
previous mining operation ...46 Figure 4.2: Results from surface sample gradation tests. Samples collected from
similar locations are indicated with the same color line ...49 Figure 4.3: Percentage of minus #200 sieve material (fines) in surface samples with
Caltrans maximum allowable percentages for class 1 subbase (solid black line), class 2 subbase (dashed black line), and class 3 subbase
(dotted black line) ...50 Figure 4.4: Surface sample results for Sand Equivalent (SE) test and Caltrans
minimum requirements for fine PCC (Portland cement concrete) aggregate (75 = blue), asphalt concrete (50 = red), class 2 base (25 = orange), and subbase (21 = black). The SE value was an average
of tests performed on two separate samples ...51 Figure 4.5: Results of selected samples for Sand Equivalent test, unwashed vs.
washed (w) and Caltrans minimum requirements for fine PCC (Portland cement concrete) aggregate (75 = blue), asphalt concrete (50 = red), class 2 base (25 = orange), and subbase (21 = black). The SE value was an average of tests on two separate samples ...52 Figure 4.6: Travel-time curves (top), cross-section (center, ground surface in
green and indicated by tree, boundary between velocity layers in
brown), and velocity profiles (bottom) for LP-S5 ...56 Figure 4.7: Four foot sample interval of DG obtained through sonic drilling...57 Figure 4.8: Sample of sonic drilling through competent rock ...57
x
Figure 4.9: Four foot interval of DG drilled by wireline core, note this sample is collected from a twinned hole from approximately the same depth as Figure 4.7 ...59 Figure 4.10: Generalized core logs from the drilling program on the La Posta
Band of Mission Indians Reservation showing relative amounts of
soil, decomposed granite (DG), and rock in each hole ...60 Figure 4.11: Percentage of fines (silt and clay) in each sonic sample with Caltrans
standard maximum allowable values for different quality materials represented as horizontal lines (30 = dotted line = class 3 subbase, 25 = dashed line = class 2 subbase, and 20 = solid line = class 1
subbase)...62 Figure 4.12: Percentage of fines (silt and clay) in each core sample with Caltrans
standard maximum allowable values for different quality materials represented as horizontal lines (30 = dotted line = class 3 subbase, 25 = dashed line = class 2 subbase, and 20 = solid line = class 1
subbase)...63 Figure 4.13: Percentage of fines (silt and clay) for each twinned sample (sonic
and core) with Caltrans standard maximum allowable values for different quality materials represented as horizontal lines (30 = dotted line = class 3 subbase, 25 = dashed line = class 2 subbase,
and 20 = solid line = class 1 subbase)...64 Figure 4.14: Percentage of fines (silt and clay) in each stockpile sample with
Caltrans standard maximum allowable values for different quality materials represented as horizontal lines (30 = dotted line = class 3 subbase, 25 = dashed line = class 2 subbase, and 20 = solid line =
class 1 subbase)...65 Figure 4.15: Grain size distributions for core (purple), and stockpile samples (blue) ....66 Figure 4.16: Sand Equivalent values for core samples with Caltrans standard
minimum values for different materials represented as horizontal lines (75 = blue = Portland cement concrete fine aggregate, 50 =
xi
Figure 4.17: Sand Equivalent values for stockpile samples with Caltrans standard minimum values for different materials represented as horizontal lines (75 = blue = Portland cement concrete fine aggregate, 50 = red =
asphalt, 25 = orange = class 2 base, 21 = black = subbase)...68 Figure 4.18: Results of the durability index test for core samples and Caltrans
standards for minimal acceptable values for Portland cement concrete fine aggregate (60 = blue line) and class 2 base (35 =
orange line) ...69 Figure 4.19: Results of the durability index test for stockpile samples and Caltrans
standards for minimal acceptable values for Portland cement concrete fine aggregate (60 = blue line) and class 2 base (35 = orange line) ...70 Figure 4.20: Results of the R-Value test for core samples and Caltrans standards
for minimal acceptable values for class 2 base (78 = orange line) and subbase (60 = black line) ...72 Figure 4.21: Results of the R-Value test for stockpile samples and Caltrans standards
for minimal acceptable values for class 2 base (78 = orange line) and subbase (60 = black line) ...73 Figure 4.22: Subsurface sample results of the LA abrasion test after both 100
(LA100) and 500 (LA500) rotations of the drum. Uniform hardness ratio is represented as a point. Also shown are Caltrans maximum allowable percentage loss for both 100 (LA100) and 500 (LA500) rotations of the drum. For LA100, less than 10% loss is necessary for open graded asphalt concrete, asphalt concrete Type A, and asphalt concrete base Type A (LA100 = 10% = red dashed line). For LA500, less than 40% loss is required for open graded asphalt concrete
(LA500 = 40% = red solid line), 45% loss for asphalt concrete Type A, asphalt concrete base Type A, and PCC coarse aggregate (LA500 = 45% = blue solid line), and 50% maximum loss for asphalt concrete Type B and asphalt concrete base Type B (LA500 = 50% = red
dotted line) ...75 Figure 4.23: Sodium sulfate soundness test results for crushed rock samples with
Caltrans standards for maximum allowable loss for coarse PCC
aggregate (10%) illustrated as a blue line ...76 Figure 4.24: Q+P+A ternary diagram with normalized mineral percentages...79
xii
Figure 4.25: Photomicrographs of thin sections of subsurface samples, sample number and length of photomicrograph (for scale) indicated below: A) DH-A 150’, 2.47 mm; B) DH-J 46’, 2.47 mm; C) and D) DH-C2 38’, 1.55 mm; E) DH-B 58’, 1.55 mm; F) DH-H 32.5’,
2.47 mm ...81 Figure 4.26: Volume of study area modeled using Vulcan; red lines and white
dots indicate areas of depth information including seismic lines and
boreholes, respectively...82
Figure 5.1: Cross-section along seismic line LP-S2 with drilling data from
borehole DH-G...89 Figure 5.2: Cross-section along seismic line LP-S4 with drilling data projected
xiii
LIST OF TABLES
Table 1.1: Aggregate demand and availability in Southern California (Kohler, 2002)...5
Table 2.1: Mineralogy of each La Posta pluton zone (Clinkenbeard, 1987) ...15
Table 3.1: Degree of weathering used to describe core samples (modified after
Bureau of Reclamation, 1998) ...25 Table 3.2: Degree of strength/hardness used to describe core samples (modified
after Bureau of Reclamation, 1998)...26 Table 3.3: Qualitative correlation between RQD and in situ rock quality
(Deere, 1968) ...27 Table 3.4: Gradations required by Caltrans for subbase, Class 2 base, asphalt
base, and asphalt, X = gradation percentage determined by engineer (Caltrans, 2002)...30 Table 3.5: Minimum sand equivalent values for each end-product
(Caltrans, 2002)...32 Table 3.6: Caltrans standards for fine durability index (Caltrans, 2002)...33 Table 3.7: Caltrans minimum standards for the R-Value test (Caltrans, 2002)...36 Table 3.8: Grain size distribution for the “A” gradation used in the LA abrasion
test (ASTM C 131-01, 2003) ...38 Table 3.9: Maximum loss for LA abrasion as per Caltrans standards
xiv
Table 3.10: Grain size distribution used for sodium sulfate soundness test
(ASTM C 88-99a, 2003)...40
Table 4.1: Brief description of surface sample locations within the La Posta Band of Mission Indians Reservation. Locations are plotted on Plate 1 ...48
Table 4.2: Descriptions of seismic refraction lines and their locations ...53
Table 4.3: Velocity and depth results of 2004 refraction lines and two 2001 lines for comparison purposes ...54
Table 4.4: Results of coarse and fine specific gravity and absorption tests...71
Table 4.5: Results of the organic impurities test on selected samples...74
Table 4.6: Generalized description of each hard rock sample tested...74
Table 4.7: Brief description of geochemical samples sent for testing; notation made if thin section (TS) exists ...77
Table 4.8: Concentrations of fully digested elements in parts per million (ppm) or percent from the 34 element analysis ...78
Table 5.1: Overview of products for which each surface sample collected from the pit passes Caltrans specifications ...84
Table 5.2: Overview of products for which each cored DG sample passes Caltrans specifications ...92
xv
LIST OF APPENDICES
ASTM and Caltrans procedures...Appendix A Surface sample results... Appendix B Seismic refraction results... Appendix C Core logs ...Appendix D Photographs of core logs... Appendix E Subsurface DG results...Appendix F Solid rock results...Appendix G Geochemical analysis results ...Appendix H Thin section descriptions ... Appendix I Additional field photographs ... Appendix J
xvi
LIST OF PLATES
Plate 1: Geologic Map ...Pocket Plate 2: Study Area, Subsurface Exploration, and Cross-Sections...Pocket
xvii
ACKNOWLEDGMENTS
I would like to thank the La Posta Band of Mission Indians for allowing me to perform this study on their land and for giving up their weight room during the drilling phase of the project. Thanks are also due to Stephen Manydeeds of the Bureau of Indian Affairs, my advisor Dr. Jerry Higgins and Dr. Paul Santi of the Colorado School of Mines for their help and guidance on this project.
This project could not have been completed without the support of James Hill, Gwendolyn and John Parada, and Javaughn Miller, and the assistance of Bud Wharton who told me so much about the former operation. Thanks also to the San Diego County Caltrans testing lab and Testing Engineers- U.S. Labs in San Diego for answering my questions. Tim Parker and the other employees of IRIS-PASSCAL at New Mexico Tech also deserve thanks for letting me use their refraction equipment, as well as Jim Pfeiffer and the staff of Blackhawk GeoSciences in Golden, Colorado for allowing me use of their refraction interpretation software. Also thanks to the Colorado School of Mines Department of Geology and Geological Engineering and Mining Department for the use of their testing facilities.
Thanks also to the other employees and grad students at the BIA, specifically John Zeise, Erik Ronald, and Henrique da Silva, for their support, direction, and the roles they played in the completion of this project.
Lastly, I would like to thank my family and friends for all their love and support and keeping me on track, but also for knowing when I needed a break.
xviii
LIST OF ABBREVIATIONS
ASTM ...American Society of Testing and Materials Caltrans ...California Department of Transportation DEMRM ... Division of Energy and Mineral Resources Management DG... decomposed granite DH...drill hole LA abrasion...Los Angeles abrasion LA100 ...percent loss after 100 rotations of the Los Angeles abrasion drum LA500 ...percent loss after 500 rotations of the Los Angeles abrasion drum LPBMIR... La Posta Band of Mission Indians Reservation Ma ...million years ago PCC ...Portland cement concrete ppm ... parts per million PRB ...Peninsular Ranges Batholith psi...pounds per square inch Res... Reservation RQD ...rock quality designation SE...sand equivalent TS...thin section USCS... Unified Soil Classification System
CHAPTER 1 INTRODUCTION
1.1 Purpose of Study
The La Posta Band of Mission Indians is interested in re-opening their Sand Pit. They requested technical assistance from the Bureau of Indian Affairs- Division of Energy and Mineral Resources Management (DEMRM) in 2003 for the evaluation of aggregate resources in the vicinity of the pit. The purpose of this study is to characterize the quality and quantity of aggregate resources near the existing pit on the La Posta Band of Mission Indians Reservation (LPBMIR).
1.2 Location
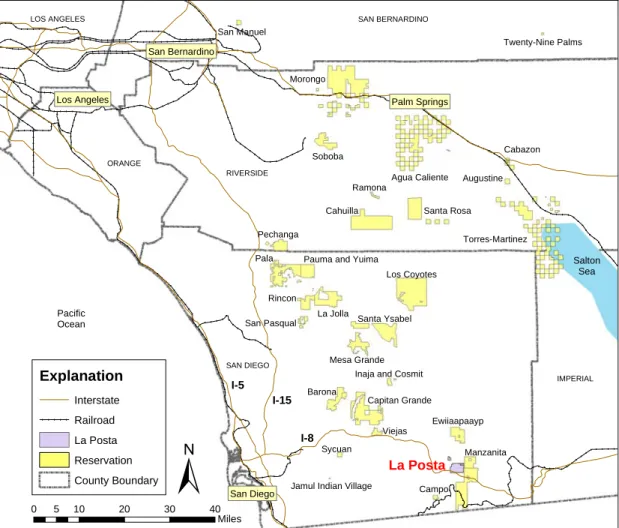
The Thirty Mission Indian Reservations of southern California is a group of reservations located between coastal California and the Salton Sea, as shown in Figure 1.1. The LPBMIR is approximately 50 miles east of San Diego and 10 miles north of the Mexican border in San Diego County.
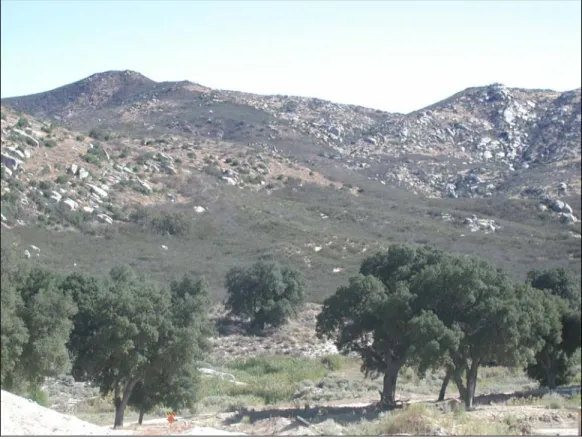
The Reservation consists of 3,672 acres and is split into two parcels. Interstate 8 crosses the southwestern corner of the main parcel, with the smaller 200 acre portion located approximately one mile to the northwest. The Manzanita and Campo Indian Reservations lie immediately east of the Reservation. The LPBMIR consists of mountainous terrain with elevations from 3,500 feet in the west up to 4,500 feet in the southeast. Most of the Reservation is covered by scrub brush, with oak trees growing along ephemeral creek beds and residual boulders exposed along prominent ridges and mountain tops (Figure 1.2).
MEXICO Los Angeles San Bernardino San Diego Palm Springs I-8 I-15 I-5 Morongo Los Coyotes Cahuilla Campo Pala La Jolla Capitan Grande Santa Rosa Santa Ysabel Barona Soboba Ewiiaapaayp Mesa Grande Rincon Pechanga
Pauma and Yuima
Manzanita La Posta Viejas Agua Caliente Cabazon Sycuan Augustine
Inaja and Cosmit Ramona San Manuel
Torres-Martinez
San Pasqual
Twenty-Nine Palms
Jamul Indian Village
SAN BERNARDINO RIVERSIDE IMPERIAL SAN DIEGO ORANGE LOS ANGELES Explanation Interstate Railroad La Posta Reservation County Boundary
±
0 5 10 20 30 40 Miles Salton Sea Pacific OceanFigure 1.1: Location of the Thirty Mission Indian Reservations within five counties in Southern California.
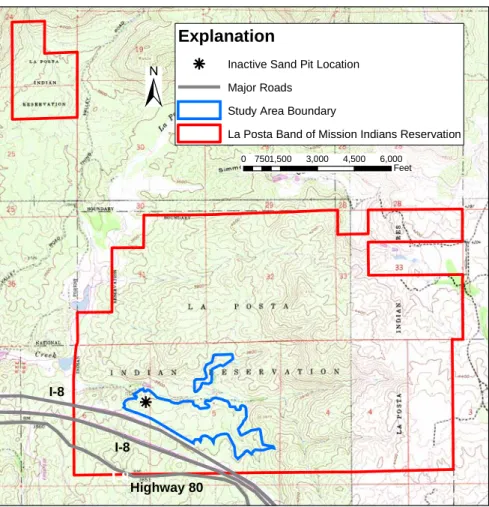
The study area comprises about 200 acres surrounding the existing Sand Pit and is located in the southwestern part of the Reservation just north of I-8 (Figure 1.3). The study area boundaries were established during a planned expansion of the pit in 2001, but were modified to exclude riverbed material due to Tribal concerns and potential
Figure 1.2: Central valley of the La Posta Band of Mission Indians Reservation. Typically residual boulders are exposed on prominent ridges and mountaintops, scrub brush covers moderately sloping hillsides, and oak trees grow along major drainages.
environmental complications. The terrain consists of gently to moderately sloping hillsides with large boulders exposed at the surface.
1.3 Aggregate in Southern California
Aggregate sources close to the greater Los Angeles/San Bernardino and San Diego areas are quickly being depleted. Extrapolated from both current consumption and population forecasts, the estimated demand over the next 50 years is expected to be very
h
±
Explanation
h Inactive Sand Pit Location Major Roads
Study Area Boundary
La Posta Band of Mission Indians Reservation 0 7501,500 3,000 4,500 6,000
Feet
I-8
I-8
Highway 80
Figure 1.3: Location of study area (shown in blue) within the La Posta Band of Mission Indians Reservation in relation to existing pit and I-8.
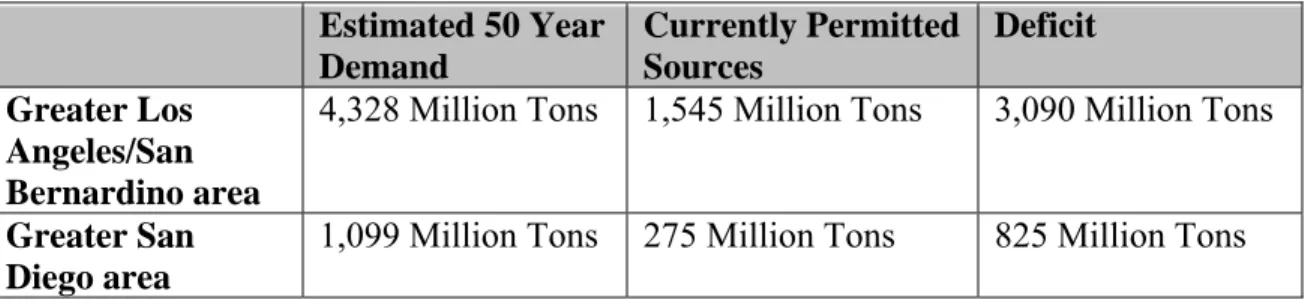
high for both of these regions. However, currently permitted aggregate resources in these areas are much less than the expected demand (Kohler, 2002) as shown in Table 1.1:
Projected shortages of 71% for the greater Los Angeles/San Bernardino area and 75% for the greater San Diego area can be reduced by permitting new aggregate sources in the surrounding areas. According to the San Diego County Department of Public Works (2003), operating permits for several of the aggregate pits near the LPBMIR will
Table 1.1: Aggregate demand and availability in Southern California (Kohler, 2002). Estimated 50 Year Demand Currently Permitted Sources Deficit Greater Los Angeles/San Bernardino area
4,328 Million Tons 1,545 Million Tons 3,090 Million Tons
Greater San Diego area
1,099 Million Tons 275 Million Tons 825 Million Tons
expire by the end of 2005. This creates an opportunity for the Tribe to reopen their Sand Pit and sell material in the San Diego market region.
Due to the proximity of the LPBMIR to the eastern San Diego suburbs (less than 35 miles), aggregate from their land is valuable as a construction material. As
transportation costs can significantly increase the price of aggregate, material from the Reservation will become more attractive as resources closer to the San Diego market are depleted. Furthermore, the Reservation is located along Interstate 8, which connects to San Diego and surrounding cities and increases the marketability of the aggregate. I-8 is easily accessed from the Sand Pit and the haul to San Diego is downhill. Also, urban sprawl is pushing development east of San Diego, which is decreasing the distance necessary to transport the products to construction sites.
One material that these populated areas will need is decomposed granite (DG), a highly weathered granitic rock. At the surface, it weathers to sand and sometimes gravel, but grades into more competent rock at depth. In southern California, DG is used in a variety of ways. It is most commonly sold as class 2 road base, subbase, and structural fill due to its free-draining, non-expansive nature and its ability to support heavy loads. In places where the DG consists of predominantly sand-sized particles (between the #4 and #200 sieve), it is sometimes sold as concrete sand if the material is of high enough quality and processed (washed and screened) prior to use.
1.4 Scope of Work
This study evaluated the DG resources within the study area on the LPBMIR with respect to whether sufficient quality and quantity exists for either road improvement projects within the Reservation itself or throughout southern California. Since the most economical way to mine decomposed rock is through “ripping,” or excavating without blasting such as by scraping the working face of the pit with a backhoe or track-hoe, the target material for this study consisted of tonalite that is decomposed enough to be “ripped” (Figure 1.4). The unweathered rock located at depth was also assessed in case the Tribe decides to pursue crushed rock resources in the future. Both geologic and engineering characterizations of the material are provided so that the Tribe can decide how to develop their resources. Suggestions were made for differentiating zones of high-quality versus low-high-quality material, end-products that can be marketed, and any
benefication processes that may be necessary to meet California Department of Transportation specifications.
The project was divided into seven major phases. These included:
1. Literature Review: Reports, maps, and other publications were reviewed to learn about the geology of the area on large and small scales and to evaluate how aggregate sources are explored and tested in the San Diego area. This helped refine the later phases of the project.
2. Airphoto and field mapping: This phase involved identifying variations in the lithology, surface expression, or degree of weathering of the rock and noting any structural features, which were mapped and correlated to variations in engineering properties when possible. Lineaments identified in this phase were studied in two of the subsequent phases of the project to evaluate their influence on quality and quantity of material.
Figure 1.4: Benches on the south side of the inactive Sand Pit. All material previously excavated was “ripped” with a track-hoe. Note unweathered boulder protruding from the center of the ripped face.
3. Preliminary surface sample collection and testing: Samples were collected from the pit and other DG exposures across the Reservation during an initial field visit. Selected engineering tests were conducted to provide an idea of general quality and identify variations in surface material. Results of this phase supported the decision to further evaluate the study area.
4. Seismic refraction surveys: The thickness of the rippable layer was estimated via seismic refraction. This provided an initial evaluation of the quantity of the highly weathered rock nearest to the surface and the depth to competent rock below. These thicknesses were later used to investigate the subsurface expression
of lineaments, choose borehole locations, construct cross-sections, and calculate the volume of the deposit.
5. Sonic and core drilling: A total of 995 feet of core was recovered from 12 boreholes to investigate the lineaments, verify the geophysical data, obtain
subsurface samples for further engineering testing and quality designation of both DG and non-rippable rock, construct cross-sections, and model the resource. 6. Engineering testing: Additional engineering tests were performed on the drill core
to measure aggregate quality at depth across the study area for both DG and the more competent bedrock. A suite of tests was used to characterize the site in detail. This data was used to identify end-products that are best suited for the material within the study area. Suggestions for processing techniques were also made based on comparison of drilling sample and processed stockpile results. 7. Analysis: All of this data was then analyzed to evaluate the quality and quantity
of material from within the study area on the LPBMIR. Quality was assessed by comparing testing results to standard specifications, while quantity was evaluated by creating a three-dimensional computer model using the depth information acquired through this study. Recommendations to the Tribe were made based on the results of this analysis.
CHAPTER 2
BACKGROUND INFORMATION
2.1 Previous Work
The LPBMIR is located within the La Posta pluton (Kimbrough et al, 2001) which was emplaced about 94 million years ago (Ma) and is zoned from a tonalite at the margins to a granodiorite core. Gastil (1983, 1975 in Clinkenbeard, 1987) separated the general lithology into four smaller zonations based on lithology and geochemistry. Clinkenbeard (1987) further described these units, as well as age-dated them and identified the temperature and pressure of emplacement. Riley (1978) conducted geochemical analyses on clay seams exposed in road cuts west of the Reservation in the same geologic unit.
Ritchey, et al. (1982) described the mineral potential of the LPBMIR. The Metal Mountain Mining District, one mile to the north of the Reservation, contains
metamorphic rocks with tungsten, feldspar, and gold. These metamorphic rocks do not crop out within the Reservation boundary. The authors also indicated that significant quantities of DG are located on the Reservation and could potentially be used for road construction and repair.
Christian Wheeler Engineering performed two studies during an attempt by Four Eagle Materials LLC to expand the Sand Pit in 2001. One study examined the rippability of the DG at depth through the use of seismic refraction (2001a). Ten short seismic refraction lines between 80 and 150 feet in length were shot near the existing excavation site to evaluate the depth to non-rippable bedrock using seismic velocities. Forward and reverse shot data were also collected from each location to examine local fluctuations in
this layer. The subsurface material was categorized as rippable (0-4,500 ft/s), marginally rippable (4,500-5,500 ft/s), and non-rippable (5,500 ft/s and greater) based on the
performance of a Caterpillar D-9. In general, the depth to non-rippable rock was
estimated at 45 feet, although the limited data may have been influenced by a “localized area of fresh rock”. In addition, Christian Wheeler Engineering noted that the ease of rippability of the DG seemed to correspond to the topography, with gently sloping areas indicating more extensively decomposed rock, while steeper terrain suggested fresher, less rippable rock close to the surface.
A second report produced by Christian Wheeler Engineering (2001b) pertained to a preliminary analysis of slope stability, which would be used to design benches within the pit. In their study, an angle of friction of 36o and an apparent cohesion of 100 pounds per square foot were obtained from a “disturbed” sample shear test, which was
considered a conservative estimate since in situ material would have higher strength. The intended excavation characteristics included 2:1 Horizontal:Vertical slopes with 12- to 15-foot-wide benches every 40 vertical feet. Using these parameters, the PCSTABL6 program predicted a factor of safety of 1.7, indicating a stable design configuration.
Several other studies were also performed on the study area. Algert Engineering prepared both an operating plan (2001a) and a reclamation and closure plan (2001b). Laguna Resource Services, Inc. created a Final Supplemental Environmental Assessment (2001) to which a Finding of No Significant Impact was issued in 2001 by the Bureau of Indian Affairs- Southern California Agency. These reports served as a guide for some of the most recent work to reopen the Sand Pit.
2.2 Geologic Setting
The LPBMIR is situated within the Peninsular Range physiographic province, which extends from the Los Angeles Basin to the southern tip of Baja California. This northwest-southeast trending mountain range consists of smaller ranges separated by San Andreas-related faults that parallel the mountains, such as the Elsinore and San Jacinto
Faults. The entire region is approximately 900 miles long and averages 55 miles in width, bounded by the Pacific Ocean to the west and south, the Colorado Desert and Gulf of California to the east, and the Transverse Ranges to the north. Elevations range from sea level to nearly 11,000 feet at San Jacinto Peak, although mountain tops typically are less than 6,000 feet.
Cretaceous igneous rocks constitute the majority of the Peninsular Ranges, although lesser amounts of Jurassic plutons and roof pendants are also exposed. The plutons that comprise the Peninsular Ranges Batholith (PRB) were formed during a period of continuous igneous activity starting approximately 125 Ma and ending about 90 Ma. This volcanism was caused by the subduction of the Farallon Plate (precursor to the Pacific Plate) under the North American plate. The PRB is generally divided into two regions, the older, magnetite-bearing western plutons and the younger, ilmenite-bearing eastern zones (Figure 2.1). The change in composition is attributed to a shift in plate directions, and therefore subduction angles, during the Mesozoic. The decrease in subduction angle caused a shift in the volcanic arc location tens of miles to the east, as well as changed the melt composition (Walawender, 2000).
The western plutons vary in composition from gabbroic, which tend to be the older rocks in the region, to younger tonalitic and monzogranitic rocks. In addition, plutons in this area are small, about 40 mi2 or less, and commonly are formed from multiple injections of magma. Plutons in the eastern portion of the PRB, however, are predominantly tonalitic, were emplaced contemporaneously (about 94 Ma), and exhibit similar characteristics. Collectively, they are referred to as the La Posta-type plutons after the La Posta pluton itself, which is the largest one in the eastern zone at nearly 540 mi2 currently exposed. Most significantly, these plutons were all formed from single pulses of magma that cooled inward from contacts with the host rock, creating concentric zonations in the rock units (Walawender, 2000).
Mexico Salton Sea San Diego San Diego County Explanation
Batholith zone boundary Interstate Railroad LPBMIR County boundary 0 3 6 12 18 24 Miles
±
I-8 I-15 I-5Figure 2.1: Western (>100 Ma) and eastern (<100 Ma) zones of the PRB in San Diego County separated by the red boundary line (modified after Walawender, 2000). The La Posta Band of Mission Indians Reservation (LPBMIR) is located in the eastern zone.
2.3 The La Posta Pluton
La Posta-type plutons display crystallization differentiation (Figure 2.2). The margins of the plutons are characterized by the more mafic rock types found in the complexes, such as tonalites, known as the hornblende-biotite facies because of the relative abundance of these minerals. Slightly aligned hornblende and biotite crystals show evidence of minor foliation near the outer edges of this zone. Inward from this zone is the large biotite facies, a generally granodioritic assemblage with biotite crystals
averaging up to one centimeter in diameter. This grades into the small biotite facies, a monzogranite characterized by biotite crystals averaging only a few millimeters across. In the center of the pluton is the muscovite-biotite facies, another monzogranite, but with the addition of muscovite. Contacts between these zones are all gradational, ranging in width from tens to hundreds of meters (Walawender, 2000). The LPBMIR is located within both the large and small biotite facies, with the study area in the large biotite facies. When all of the facies are grouped together, they are referred to as the Tonalite of La Posta (Todd, 1995). This is also partly because the small percentage of potassium feldspar is nearly indistinguishable from plagioclase in hand sample, making
classification between granodiorite and tonalite very difficult.
According to Clinkenbeard (1987), the primary components of all of the zones within the La Posta pluton include plagioclase, quartz, and biotite, with minor alkali feldspar. Biotite and hornblende are most common along the edges of the pluton and decrease in concentration towards the center, whereas the quartz and alkali feldspar contents increase closer to the core. In addition, muscovite is found only in the
muscovite-biotite facies, the last phase of the pluton to cool. Accessory minerals found throughout the pluton include sphene, opaque minerals (ilmenite), apatite, zircon, and allanite. A summary of the most common minerals is provided in Table 2.1. Within each of the facies, mineral assemblages are generally uniform, except that rocks exposed on the eastern portion of the pluton have slightly larger crystals and the percentage of quartz and mafics is slightly higher than on the western side.
Within the pluton are three primary joint sets as described by Kimzey (1982 in Clinkenbeard, 1987). One set trends primarily north-south, another east-west, and the third is sub-horizontal. Ground water flow is concentrated along these fractures, which leads to an increased rate of weathering and erosion. Surface expression of these features includes linear arrangements of stream drainages, valleys, and vegetation that intersect each other at roughly right angles. Between these joint sets are less-weathered
b B HB B JS b mb JS HB MG JS HB b B MG
§
¨
¦
I8 0 1.5 3 6 9 12 Miles±
San Diego La Posta Band of Mission Indians Reservation La Posta plutonSan Diego County Imperial County Explanation Interstate County Boundary Lithology HB- Hornblende-Biotite B- Large Biotite Facies b- Small Biotite Facies mb- Muscovite-Biotite JS- Julian Schist MG- Monzogranite
Mexico
Figure 2.2: Concentric zonations within the La Posta pluton in San Diego and Imperial Counties, California, and Mexico (after Smith, 2002).
hillsides after the more easily eroded material along the fracture sets is removed (Figure 1.2). Faults in the area trend about N20oE and N81oE (Riley, 1978). These orientations roughly coincide with the joint sets, suggesting a possible relationship in genesis.
Riley (1978) studied clay seams that occur along fractures in a road cut within the large biotite facies of the La Posta pluton. In these clay seams, hornblende and biotite
Table 2.1: Mineralogy of each La Posta pluton zone (Clinkenbeard, 1987).
Hornblende-Biotite Large Biotite
Shape Percentage Size Shape Percentage Size
Plagioclase sub-eu 40-59% 2-10 mm sub-eu 44-55%
3-4, up to 10 mm Quartz an-sub 22-32% 4-5 mm an 27-39% 2-5 mm Biotite sub 12-24% 1-5 mm eu 7-15% 1-10 mm Hornblende sub-eu 2-5% 3-7, up to 20 mm sub-eu 0-3% 1-3 mm Alkali
Feldspar oikocrysts 0-4% n/a oikocrysts 2-7% up to 30 mm
Sphene eu 0-2% up to 10
mm eu accessory up to 10 mm
Muscovite x x x x x X
Small Biotite Muscovite-Biotite
Shape Percentage Size Shape Percentage Size
Plagioclase sub-eu 45-54% 1-3 mm sub-eu 42-53% 1-4 mm
Quartz an-sub 29-37% 2-5 mm an-sub 30-43% 1-5 mm
Biotite eu 5-13% 1-4 mm sub 4-10% 1-2 mm Hornblende eu trace up to 2 mm x x X Alkali Feldspar oikocrysts 2-12% up to 30 mm oikocrysts; eu 6-13% up to 30 mm; 2-4 mm Sphene eu accessory 1-4 mm x x X Muscovite x x x sub-eu 0-3% 1-3 mm
eu = euhedral n/a= not provided by author
sub = subhedral x = mineral not found in zone
an = anhedral
altered to montmorillonite and oligoclase became kaolinite. Prehnite and laumontite, two types of zeolite minerals, also developed from the oligoclase. Due to the presence of the zeolites, this mineral assemblage was most likely caused by past moderate hydrothermal fluid activity around 100oC to 150oC. Today, the Agua Caliente hot springs exist about 20 mi to the north, indicating potential for past thermal activity in the LPBMIR area.
CHAPTER 3 METHODS
3.1 Literature Review
Reports, publications, and theses were reviewed at the start of this project and throughout its duration. In addition, maps, aerial photographs, and satellite imagery of the region surrounding the LPBMIR were studied to gain a better understanding of the structure and relationships between geologic units. All of this information was used to design the later phases of the project, including surface sampling, seismic refraction, and core drilling.
3.2 Mapping and Surface Sampling
In October 2003, the geology of the main part of the Reservation was mapped. Road cuts along I-8 were investigated to evaluate the thickness of DG and depth to competent rock, and to draw any possible correlations between surface expression and degree of weathering in the subsurface. Exposures within the Sand Pit were also examined for degree of weathering and extent of mineral alteration.
Surface samples were collected from DG exposures throughout the Reservation for preliminary quality testing. Six samples were collected from the Sand Pit to evaluate quality of existing in-place resources, three from stockpiles of washed and screened material to assess the change in quality after processing, and eight from various cuts or other exposures to evaluate variations in grain size or quality across the Reservation. Approximately 50 lbs of DG was obtained at each location, with samples collected according to standards set forth by the American Society for Testing and Materials
(ASTM) D 75-97 (2003). All ASTM standards used in this study are located in Appendix A. ASTM standards provided an approximation of quality on these
reconnaissance samples. Physical tests performed on these samples include gradation (ASTM C 117-95 and C 136-01), sand equivalent (ASTM D 2419-02) on unwashed and washed DG, and one Los Angeles abrasion test (ASTM C 131-01) on a stockpile sample. All tests were performed at the testing facilities at the Colorado School of Mines.
Engineering testing results were used to refine later work based on preliminary quality, including identification of appropriate physical tests to perform on subsurface samples and recommendation of processing techniques that would increase the quality of the material. For example, different types of degradation tests were performed depending on whether the sample consisted of DG or bedrock since certain tests are only appropriate for certain materials. Also, tests were performed on both processed and unprocessed material in order to evaluate changes in product quality so that recommendations could be made for future mining operations.
3.3 Seismic Refraction
Seismic refraction was used to investigate the thickness of DG and depth to competent rock. Refraction program results were used to refine cross sections through the study area, propose borehole locations, and aid in DG resource modeling. A 16 lb sledge hammer was struck against a steel plate (Figure 3.1) a total of nine times at each shot location to emit compressional waves into the ground. Waves increased in velocity as they arrived at more competent layers, an indication of harder rock, with the
compressional energy partly reflected back to the surface and partly refracted into the layer beneath it. This scenario occurred each time a new, higher velocity layer was reached until the energy dissipated. As the energy was reflected back up to the surface, geophones recorded the arrival times used to calculate the apparent thickness and transmission velocity of the layer that reflected it. Since DG has a lower characteristic velocity range than competent rock, the type and condition of each unit was identified
through the interpretation of the data collected. Data was recorded on a Geometrics StrataVisor NX in SEG-2 format, with a specified sample interval of 0.250 milliseconds and total record length of 0.5 seconds.
Seven seismic refraction lines were shot within the study area to obtain information on various anticipated subsurface conditions, such as thickness of DG overlying bedrock at depth, areas of DG mixed with boulders, thickness of alluvial deposits, and the influence of major joint sets on thicknesses of DG resources. Two lines verified a previous refraction study (Christian Wheeler Engineering, 2001a). Where possible, sites were selected with minimal changes in elevation to simplify the seismic modeling. All locations are shown in Plate 2.
All lines utilized 60 geophones, making six of the seven lines 118 m long using 2 m geophone spacing. The other seismic line, LP-S1, was 295 m long with geophones placed at 5 m intervals in an attempt to obtain deeper subsurface information. A rule of thumb is that data can be collected as deep as 1/3 of the total length of the refraction line, provided that enough energy is put into the ground. Therefore, the expected depth of resolution for these surveys was around 30-40 m, or about 100 ft. For six of the seven lines, shot points were spaced every five geophones, with an additional three off-end shots spaced 10 m apart used at both the start and end of the line (where possible). For LP-S1, shot points were located 50 m off one end and at the first, tenth, twentieth, thirtieth, and fortieth geophones. No shot points were located past the fortieth geophone on this line due to the insufficient length of the trigger extension reel (cable). The
limiting length of the trigger extension reel led to the change in geophone spacing from 5 m to 2 m. Also, smaller geophone spacing is also more appropriate for a detailed near-surface evaluation (Redpath, 1973). Furthermore, the sledge hammer source used in this study did not produce enough energy to be recorded on geophones as far as 200-300 m away.
For each seismic line, locations and changes in elevation were recorded. The X, Y, and Z coordinates of the first and sixtieth geophones were recorded on a global
Figure 3.1: Sledge hammer impact on a steel plate was used as the seismic energy source for the geophysical surveys. Photograph shows LP-S5 location and computer used for data collection.
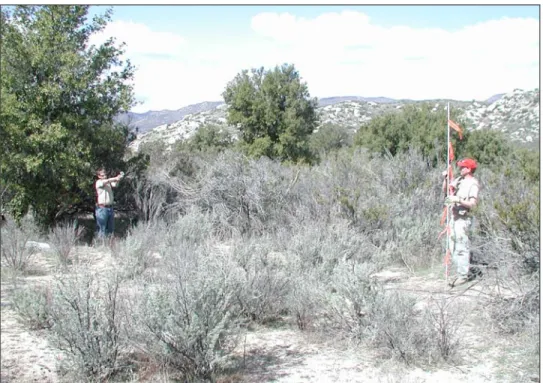
positioning system (GPS) device. Elevations of shot point locations were sited using a Brunton pocket transit (compass) and a survey staff, with the first geophone used as a base elevation (Figure 3.2).
Once the data was collected, the subsurface was modeled using two different types of software, both made available for use by Blackhawk GeoSciences of Golden, CO. After the data was filtered to remove noise caused by wind (for sledge hammers, typical low- and high-cut filters are 1 Hz and 250 Hz, respectively), first breaks were
Direction of seismic line
Figure 3.2: At LP-S4, a Brunton pocket transit (compass) and survey staff were used to measure elevation changes.
chosen using PickWin95. These files were then imported into Gremix, a modeling program where travel-time curves are analyzed to identify changes in velocity and prepare cross-sections. Results from these surveys were used in selecting borehole locations and planning borehole depths.
3.4 Drilling
A drilling program was conducted in August 2004 to confirm the results of the seismic refraction surveys, obtain subsurface samples for quality testing, explore for any possible changes in subsurface lithology, and investigate the degree of alteration or weathering at depth. Boreholes were located in accessible areas to provide both good
coverage of the site and to fill in gaps in the cross-sections. Two drilling methods were used in the study area: sonic and wireline core. The majority of the holes were vertical in orientation, with one hole drilled at a 45 degree angle to investigate lateral influences of joint sets on weathering. Some boreholes confirmed the seismic refraction line data, while other boreholes provided control for cross-sections and collect subsurface sample testing material from across the study area.
The drilling was started using sonic drilling, but was switched to wireline core partway through the project. Sonic drilling was originally selected for this project due to its reputation for high sample recovery in materials where low recovery is anticipated. It was also recommended by several drilling contractors during the site visit as the best way to sample DG. Other advantages for choosing sonic drilling were a fast drilling rate, low cost, fluid circulation needed only when drilling non-rippable rock, and a large core diameter. In addition, sonic drilling has been successfully used in the past to sample DG in the southern California area, and based on the appearance of the Sand Pit, sonic was anticipated to work well. Sonic drilling penetrates the subsurface by vibrating the drill stem with very little rotation and generally no fluid circulation. However, the vibratory nature of the sonic drilling broke down the DG from primarily sand and gravel to silty sand with gravel. This was most likely due to the DG not being decomposed enough to quickly clear away from the drill bit, and since no fluids or air was circulated to remove the material, it slowed down the drilling rate and caused the samples to be excessively vibrated. Therefore, the drilling method was switched to wireline core exclusively, which produced more representative samples.
Where possible, drilling stopped 10 to 20 ft into competent rock to distinguish subsurface boulders from bedrock, since small boulders can be removed and do not represent the lower limit of mining. Two holes, DH-G and DH-H, were located along seismic lines in order to verify the refraction data (Plate 2). Two of the sonic holes, DH-B and DH-C, were also twinned by core holes DH-DH-B2 and DH-C2, respectively, to help correlate subsurface features between the two drilling methods. The lower 26 ft of DH-C
were drilled by wireline core since the sonic rig could not penetrate more than a few feet into bedrock at this location. DH-A was oriented at a 45 degree angle to the east to investigate weathering near a N-S trending joint set, since a high density of clay seams were observed close to this location within the Sand Pit. Ultimately, however, some stockpiles blocked the drill rig from drilling through the joint set, so the entire borehole is located east of the surface lineament and investigates the extent of weathering near the feature. All of these locations are shown in Plate 2.
3.4.1 Sonic Drilling
For holes completed with sonic drilling, a 4.5 inch diameter carbide tooth bit was used in conjunction with a Roto-Sonic drill rig. The company contracted for the drilling was Boart Longyear’s Environmental Drilling Division of Peoria, AZ. When possible, the samples were dry-drilled. When the bit needed cooling such as during bedrock drilling, water was circulated through the system producing wet samples. Samples were retrieved from the subsurface through a vacuum system within the sampling tube of the drill stem. Once the sampling tube was removed from the hole, the vacuum pressure was released and the sample extruded into a plastic bag (Figure 3.3). Generally, two to four feet of sample were collected in each run. Boreholes drilled with the sonic rig include DH-B, C, D, E, F, G, and I.
3.4.2 Wireline Core Drilling
The wireline core portion of the drilling collected PQ (3.5 inch diameter) core using an LF-70 drill rig (Figure 3.4) and a diamond bit. Boart Longyear’s Core Drilling Division performed this portion of the project. Generally, core was collected in five foot runs except where problems were experienced (such as lost circulation, anticipated low recovery, etc.). Manual breaks in the core were noted for Rock Quality Designation (RQD) purposes.
Figure 3.3: Sonic drilling sample being extruded from sampling tube.
The focus of the project shifted when wireline core drilling proved to collect more representative subsurface samples than sonic drilling. The original plan had been to collect samples of both the DG and hard rock from each borehole location, but since the sonic samples were broken down, the remaining drilling was reallocated from collecting hard rock samples to collecting representative DG samples, specifically around the Sand Pit. Sampling the DG was more important because this material would be the primary end-product. Two of the sonic holes were twinned with wireline core holes in an attempt to correlate sonic sample features and testing results to core samples. Two new boreholes were also added east of the Sand Pit, since this would likely be the direction in which mining would first expand. Wireline core holes include DH-A, B2, C2, H, J, and the lower 26 feet of DH-C.
Figure 3.4: Core drilling of an angled hole DH-A.
3.5 Core Logging
Upon completion of the drilling program, both sonic and core samples were logged using both geologic and engineering descriptors and photographed for future reference. Samples were described for degree of weathering, color (based on the Munsell soil color chart), strength, average maximum crystal size (i.e. medium-grained),
clay seams in the rock. Graphic logs were used to supplement these descriptions, and soil was logged according to the Unified Soil Classification System (USCS) (U.S. Bureau of Reclamation, 1998). Mineral percentages, sizes, width of alteration rims around
minerals, and average maximum particle size regardless of crystal size (i.e. pieces of DG up to ½” in diameter) were also recorded. Percent sample recovery was rated on a scale of 0 to 100%, degree of weathering was rated on a scale from W1-Fresh to
W9-Decomposed (Table 3.1), and strength/hardness was assessed on a scale of H1-Extremely Hard to H7-Very Soft (Table 3.2). For sonic samples, these evaluations were made based on pieces of gravel, if any was recovered, as opposed to the disturbed samples of silty sand. Once geologic descriptions were completed, each box of core was photographed to preserve a visual record (see Appendix E).
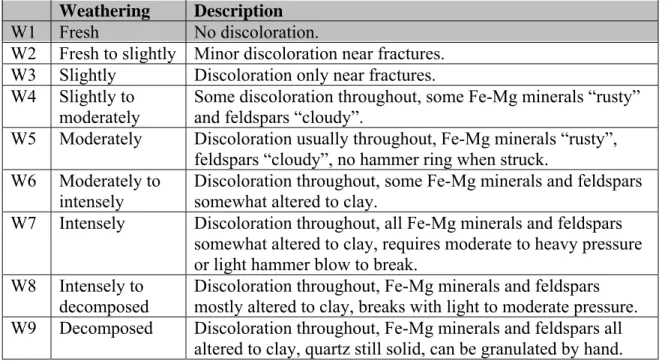
Table 3.1: Degree of weathering used to describe core samples (modified after Bureau of Reclamation, 1998).
Weathering Description
W1 Fresh No discoloration.
W2 Fresh to slightly Minor discoloration near fractures. W3 Slightly Discoloration only near fractures. W4 Slightly to
moderately
Some discoloration throughout, some Fe-Mg minerals “rusty” and feldspars “cloudy”.
W5 Moderately Discoloration usually throughout, Fe-Mg minerals “rusty”, feldspars “cloudy”, no hammer ring when struck.
W6 Moderately to intensely
Discoloration throughout, some Fe-Mg minerals and feldspars somewhat altered to clay.
W7 Intensely Discoloration throughout, all Fe-Mg minerals and feldspars somewhat altered to clay, requires moderate to heavy pressure or light hammer blow to break.
W8 Intensely to decomposed
Discoloration throughout, Fe-Mg minerals and feldspars mostly altered to clay, breaks with light to moderate pressure. W9 Decomposed Discoloration throughout, Fe-Mg minerals and feldspars all
Table 3.2: Degree of strength/hardness used to describe core samples (modified after Bureau of Reclamation, 1998).
Strength Description
H1 Extremely Hard Cannot be scratched, can be chipped with hammer.
H2 Very Hard Cannot be scratched, can be broken with many heavy hammer blows.
H3 Hard Can be scratched with difficulty, requires heavy hammer blow to break.
H4 Moderately
Hard Can be scratched with light to moderate pressure, requires moderate hammer blow to break. H5 Moderately Soft Can be scratched 1/16” (2 mm) with moderate to heavy
pressure, requires light hammer blow or heavy manual pressure to break.
H6 Soft Can be grooved with light pressure, scratched with fingernail, requires light to moderate manual pressure to break.
H7 Very Soft Easy to indent, requires light manual pressure to break.
3.6 Rock Quality Designation
The Rock Quality Designation (RQD) of rock core was calculated when appropriate. For this study, RQD was only applied when the material was competent enough for the fractures to be the most likely mode of failure. Therefore, RQD was not performed on DG. Deere (1968) developed RQD to classify rock mass for engineering purposes and quantify discontinuity spacing based on drill core. Within a sample run, the ratio of the summation of individual pieces of core greater than four inches long to the total length of the run is reported as percent recovery. In general, the higher the percent, the more competent the rock due to greater fracture spacing. The equation used is:
where x represents the length of pieces of sound rock core greater than four inches in a drill run and L is the length of the drill run. Mechanical breaks were ignored. The RQD for each drill run was also listed on the core log.
The RQD value corresponds to an approximate rock quality, although the rating system should not be the sole factor in evaluating rock competency. The relationship between RQD and in situ rock quality is shown in Table 3.3.
Table 3.3: Qualitative correlation between RQD and in situ rock quality (Deere, 1968). RQD (%) Rock Quality 0-25 Very poor 25-50 Poor 50-75 Fair 75-90 Good 90-100 Excellent
3.7 Physical Testing and Standards for Decomposed Granite
In order to obtain representative samples for both the physical and geochemical testing, each DG sample was split down the center and half was collected for testing and half was retained for storage. Approximately 100 pounds of DG were collected for each sample to ensure enough material to perform the desired tests. For the material acquired through sonic drilling, sample intervals of roughly 20 ft were used, whereas 25 ft was used for the core samples. Sample numbers and their corresponding depth intervals can be found in Appendix F for DG samples and Appendix G for rock samples. The
difference in sample intervals was due to the larger diameter of the sonic drill bit, which created a larger volume of sample for the same amount of core length. Three stockpile samples (locations shown on Plate 2) were also collected from the Sand Pit as per ASTM D 75-97 standards (ASTM, 1997) and subjected to the same tests as the drilling samples.
Physical tests performed on the DG included gradation (ASTM 117-95 and C-136-01), sand equivalent (California Test 217), durability index (ASTM D-3744-97), specific gravity (ASTM C-127-01 and C-128-01), R-Value (California Test 301), and organic impurities (ASTM C-40-99). Samples were characterized using these
engineering tests because this phase of the project necessitated a more detailed investigation than the reconnaissance samples. State of California Department of
Transportation (Caltrans) standard testing procedures were used on subsurface samples if a Caltrans test existed. Otherwise, ASTM standards were used. Caltrans engineering tests were performed on the subsurface and stockpile samples collected in this phase since any products from the Sand Pit would be sold and used in California and therefore needed to be tested according to Caltrans methodology. The actual testing procedures for the ASTM tests and their Caltrans equivalents are included in Appendix A. All tests on DG collected in this phase of the project were performed by Testing Engineers – U.S. Labs in San Diego, CA.
Subsurface samples collected through both the sonic and core drilling programs were tested using either a reduced or full suite of tests. The reduced suite included gradation, sand equivalent, durability index, and R-Value. The full suite of tests was performed on the majority of samples and included gradation, sand equivalent, durability index, specific gravity, R-Value, and organic impurities. Specific gravity and organic impurities were excluded from the reduced suite since these tests are not as critical for defining the quality of the material. Specific gravity was necessary for modeling the deposit, while the organic impurities test is required for concrete. For drill holes where more than two samples were sent for testing, the full suite was always performed on the upper sample and then alternated with the reduced suite on subsequent samples from
deeper in the hole (for example, 0-20 ft = full suite, 20-40 ft = reduced suite, 40-60 ft = full suite, etc.). Also, the three stockpile samples collected during the drilling program phase were all subjected to the full suite of tests.
3.7.1 Gradation
The distribution of grain sizes of DG was assessed through ASTM C-117-95 (2003) and ASTM C-136-01 (2003) for surface samples and California Test 202 (Caltrans, 2004b) for subsurface samples. The gradation of a sample is important in identifying potential construction uses of material. In order to obtain a representative portion of the whole sample for this test, all samples were mechanically split according to California Test 201 (Caltrans, 2004a). To evaluate the gradation, a known mass of sample is mechanically sieved on a stack of screens with successively smaller openings so that the percentage of each grain size range can be obtained by mass. Sieves used included the 2”, 1 ½”, 1”, ¾”, ½”, 3/8”, #4, #8, #16, #50, #100, and #200. Particles larger than 2” were measured by hand and the mass was evaluated separately. The amount of material sieved is dependent upon the nominal maximum grain size, so samples with larger diameter particles contained more material than finer grained samples. Samples with a nominal maximum grain size of 1/4” or less were dried, weighed, washed to remove the fines (minus #200 sieve portion), dried and weighed again, and then sieved. If the sample was coarse grained, then a separate sample was split out and washed to evaluate the amount of fines.
For the different types of end-products (road base, asphalt, etc.), different material gradations are needed. The Caltrans operating ranges for each of the end-uses is listed in Table 3.4. Exact gradations listed for asphalt can be adjusted by the engineer for certain projects, as signified in Table 3.4 by the X and corresponding ranges provided. The most common gradations for asphalt include Type A (3/4” maximum, coarse), Type B (3/4” maximum, medium), and open-graded (3/8” maximum).
Table 3.4: Gradations required by Caltrans for subbase, Class 2 base, asphalt base, and asphalt, X = gradation percentage determined by engineer (Caltrans, 2002).
Subbase Percentage Passing
Class 1 Class 2 Class 3
3" 100 100 100
2.5" 90-100 90-100 90-100
#4 35-70 40-90 50-100
#200 0-20 0-25 0-30
Percentage Passing Asphalt Base
Class 2 Base 1.5" Max 3/4" Max Percent Passing
2" 100 - 1 1/4" 100 - 1.5" 90-100 - 1" 95-100 - 1" - 100 3/4" 80-10 - 3/4" 50-85 87-100 3/8" X ± 5 X = 55-60 #4 25-45 30-65 #4 X ± 5 X = 40-45 #30 10-25 5-35 #30 X ± 5 X = 14-19 #200 2-9 0-12 #200 2-7 - Asphalt Percentage Passing
3/4" Max Coarse 3/4" Max Medium 1/2" Max Coarse 1/2" Max Medium
1" 100 - 100 - - - - - 3/4" 90-100 - 95-100 - 100 - 100 - 1/2" - - - - 95-100 - 95-100 - 3/8" 60-75 - 65-80 - 75-90 - 80-95 - #4 X ± 5 X = 45-50 X ± 5 X = 49-54 X ± 5 X = 55-61 X ± 5 X = 59-66 #8 X ± 5 X = 32-36 X ± 5 X = 36-40 X ± 5 X = 40-45 X ± 5 X = 43-49 #30 X ± 5 X = 15-18 X ± 5 X = 18-21 X ± 5 X = 20-25 X ± 5 X = 22-27 #200 3-7 - 3-8 - 3-7 - 3-8 -
Asphalt Open Graded Asphalt
Percent Passing Percent Passing
3/8" Max #4 Max 1/2" Max 3/8" Max
3/4" - - - - 100 - - - 1/2" 100 - - - 95-100 - 100 - 3/8" 95-100 - 100 - X ± 4 X = 78-89 90-100 - #4 X ± 6 X = 73-77 95-100 - X ± 4 X = 28-37 X ± 4 X = 29-36 #8 X ± 6 X = 58-63 X ± 6 X = 72-77 X ± 4 X = 7-18 X ± 4 X = 7-18 #16 - - - - 0-10 - 0-10 - #30 X ± 6 X = 29-34 X ± 6 X = 37-43 - - - - #200 3-10 - 3-12 - 0-3 - 0-3 -
3.7.2 Sand Equivalent
ASTM D-2419-02 (2003) and California Test 217 (Caltrans, 2004c) describe the procedures used to calculate the sand to clay ratio in a sample. The amount of fines (clay-sized particles passing the #200 sieve) in aggregate will dictate potential end-uses as a construction material. Flocculating solution is placed into a graduated cylinder along with 85 mL+/-5 mL of the minus ¼” portion of a sample and allowed to sit for 10
minutes. The entire ensemble is then shaken for 45 seconds to thoroughly wet the sample and more flocculating solution is added. It is again allowed to settle, with the sand falling out of solution first and the fines settling out over time and located on top of the sand. After 20 minutes, the clay reading is recorded as the total height of the sediment column within the graduated cylinder. The sand reading is evaluated by lowering a weighted foot assembly into the graduated cylinder, through the clay (it will rest on the sand), and recording the height of the sand column. The sand equivalent (SE) is calculated as:
SE = (sand reading / clay reading) x 100
The greater the percentage of sand-sized particles within a sample, the higher the SE value. Two SE tests are performed on separate samples and the average value is reported. Figure 3.5 shows an SE test being performed.
For selected surface samples, SE tests were also performed on material that had been washed during the fine gradation test. To conform to Caltrans requirements, SE values must meet or exceed the specifications set forth in Table 3.5.
3.7.3 Durability Index
ASTM D 3744-97 (2003) measures the resistance of aggregate to producing clay-sized fines when abraded in water. The coarse durability test is performed by agitating a sample of coarse-grained material in a wash vessel with water and then separating out the
Figure 3.5: Sand equivalent test on surface sample LP14.
Table 3.5: Minimum sand equivalent values for each end-product (Caltrans, 2002).
End-products Minimum
SE Value
Subbase (all classes) 21
Class 2 base 25
Asphalt- Type A 50
Asphalt- Type B 45
Asphalt- open graded N/A
Asphalt base Type A 50
Asphalt base Type B 45
minus #200 sieve portion using a washing procedure similar to that used for the fine gradation test (ASTM C 117). The minus #200 sieve portion is then placed into a graduated cylinder with flocculating solution and the height of the sediment column is then read. This value is then compared to a chart (Appendix A, ASTM D 3744-97, page 403) to obtain the equivalent durability index value.
The fine durability test is identical to the sand equivalent test, except that the entire assembly is agitated in a mechanical shaker for 10 minutes rather than 45 seconds. The fine durability index is calculated in an identical manner as SE:
Durabilityfine = (sand reading / clay reading) x 100
The greater the percentage of sand-sized particles within a sample, the higher the fine durability value, indicating less break down due to interparticle abrasion in water.
Caltrans only has standards for fine durability index for Portland cement concrete (PCC) and class 2 base. The minimum passing values for each test are provided in Table 3.6.
Table 3.6: Caltrans standards for fine durability index (Caltrans, 2002).
End-Product Minimum Fine
Durability Index Value
Base 35