The Python
Neural Simulation Technology
Graphical User Interface
av
Nicklas Haglund
Examensarbete utfört vid
Akademin för innovation, design och teknik
Sammanfattning
Den här rapporten handlar om examensarbetet PyNestGUI som gick ut på att göra ett grafiskt gränssnitt till neuronsimulatorn NEST. Rapportens första del handlar om hur NEST fungerar samt vilket grafiskt gränssnitt som valdes ut. Sedan fortsätter rapporten med att ytligt gå igenom vad en neuron är och hur den fungerar. Sista delen av rapporten går igenom hur PyNestGUI är uppbyggt och hur programmet fungerar. Problemet som programmet löser är att den bygger upp en modell i NEST med användarens inställningar och kopplar ihop neuroner på liknande sätt som en minikolumn är sammankopplad. Programmets syfte var att det skulle hjälpa användaren kunna ändra på variabler på ett lätt sätt samt ge resultat som kan visualiseras och som användaren skulle kunna spara. Resultat som programmet kan visa av simuleringen är voltmätare och spikdetektor på samtliga neuroner. Programmet kan också visa en animation av simuleringen så att användaren ska kunna se när neuroner spikar och vilka dessa neuroner är
Abstract
This report is about the thesis work PyNestGUI which goal was to make a graphical interface to the neuron simulator NEST. The report's first part is about how NEST works well as which graphical interface that where selected. The report then continues go through what a neuron is and how it works superficial. The final section of the report will cover how PyNestGUI is build and how the program works. The problem that the program solves is that it builds a model in NEST with user settings and connects neurons in a similar way as a minicolumn are interconnected. The programs purpose was that it would help the user to change the variables in an easy manner and produce results that can be visualized and save for later analysis. Results that the the program can plot from the simulation is from voltmeters and a spike detector connected all neurons. The program can also display an animation of the simulation so that the user will be able to see when and which neurons spikes and their connections.
Innehållsförteckning
...
Bakgrund!
5
...
PyNestGUI uppbyggnad!
5
...
NEST!
6
...
PyNest!
6
...
GUI!
6
...
Biologin bakom modellen!
7
...
Neuron!
7
...
Kommunikationen mellan neuroner!
8
...
Modellen!
9
...
Lösningen!
9
...
Simpleminicolumn!
10
...
PyNestGUI!
11
... Nätverksfönstret! 13 ... Spik detektor! 14 ... Spänningsmätaren! 15 ... Nätverksanimation! 16 ... Nätverksöversikt! 17...
Slutsatser!
18
...
Bilagor!
20
...
Bilaga 1 - simpleminicolumn.py!
20
...
Bilaga 2 - curry.py !
27
...
Bilaga 3 - PyNestGUI.py!
28
Bakgrund
Detta projekt skulle först handla om att simulera spikande neuroner som är
sammankopplade som biologiska minikolumner. Denna modell finns bland annat i den visuella barken hos däggdjur. Simuleringen skulle ske med hjälp av neuronsimulatorn NEST. Då det inte fanns någon tydlig beskrivning om hur denna modell skulle byggas upp i simulatorn gick projektet vidare med att bara försöka bygga upp och simulera en
minikolumn vilket det finns flera forskningsrapporter på. För att utveckla projektet
ytterligare gjordes det ett enkelt användargränssnitt till programmet så att det skulle vara enklare att simulera spikande neuroner som var sammankopplade i en biologiskt
inspirerad minikolumn.
NEST är en neuronsimulator som har hög inlärningströskel innan användaren kan komma igång med att simulera ett nätverk av neuroner. Denna tröskel har sänkts med beta
versionen 2.0 av NEST som introducerade PyNest som är en modul skriven i
programmeringsspråket Python. Även om det blev enklare att skapa och simulera nätverk av neuroner i PyNest så är det fortfarande mycket som användare måste lära sig om Python och PyNest samt att kod måste skrivas innan ett simpelt nätverk kan simuleras. Även när användaren har skrivit kod och simulerat ett nätverk med hjälp av PyNest så är det svårt att få information om resultatet på ett lätt och överskådligt sätt. Målet med det här projektet var att göra ett simpelt grafiskt gränssnitt där användaren skulle kunna skapa ett neuronnätverk i NEST genom ett grafiskt gränssnitt och få resultat som kan visualiseras i diagram samt i en animation. Modellen om hur neuronerna är sammankopplade och placerade i simulatorn har inspirerats av hur en minikolumn är uppbyggt i en däggdjurs hjärna. Den modellen har bevisats finnas i bland annat hörselbarken samt visuella barken hos däggdjur.
Figur 1. PyNestGUI uppbyggnad i olika lager.
PyNestGUI uppbyggnad
PyNestGUI kallas programmet som har utvecklats och programmerats i detta projekt. Programmet kan delas upp i olika lager av program där varje lager fokuserar på ett lösa ett problem. Detta är möjligt då programmeringsspråket Python är ett dynamiskt språk som kan hantera program som är skrivna och kompilerade på ett annat programmeringsspråk. Figur 1 visar hur det var tänkt att PyNestGUI skulle vara uppdelat. Att arbeta i olika lager ger fler möjligheter att skapa ett dynamiskt program då det går att skriva varje lager på olika programmeringsspråk för att lösa problemen på ett effektiv sätt.
NEST
NEST står för The Neural Simulation Technology och är en simulator för biologiska nätverk med spikande neuroner. Dessa nätverk av neuroner kan vara stora komplexa nätverk till nätverk med bara en neuron. Simulatorn är skriven i C++ och kan kompileras och köras på en rad olika UNIX- och Linuxsystem:
• Linux
• Mac OS X (10.3)
• Windows (under CygWin) • HP Tru64 Unix
• Sun Solaris • IBM AIX • SGI Altix
NEST är gjort så att det ska kunna utvecklas och utökas på olika sätt genom att lägga till moduler och bibliotek till olika användbara program. NEST är en kommandobaserad simulator där användaren gör en skriptfil som NEST tolkar. Resultatet av simuleringen är datafiler som kan användas i program som Matlab, IDL eller Mathematica. NEST används huvudsakligen till stora dynamiska och komplicerade nätverk då det antas att kunskapen om dynamiken kring en individuell neuron är känt sedan tidigare. [1]
PyNest
PyNest är en modul till NEST som är gjord i programmeringsspråket Python. Istället för att använda NESTʼs egna skripttolkare används Python för att kommunicera med simulatorn i NEST. Detta ger flera fördelar då Python gör det lättare för en programmerare att skapa komplicerade nätverk samt att det finns färdiga moduler i Python för att hantera data från NEST. [2]
PyNest är ett gränssnitt mot NEST som introducerades med betaversionen 2.0 och ger grundläggande metoder till Python för att kommunicera med simulatorn i NEST.
GUI
PyNestGUI utvecklades på en MAC dator i operativsystemet Mac OS X 10.6. Detta ledde till att det fanns två alternativ för det grafiska gränssnittet mot PyNest. Antingen kunde programmet bara köras på MAC datorer med hjälp av PyObjC som är en brygga mellan Mac OS X gränssnitt Cocoa och Python eller så används ett grafiskt gränssnitt som körs på samtliga plattformar som PyNest klarar av. Det enda väl fungerade grafiska gränssnitt som klarar av dessa kriterier är TkInter. Man kan kunna säga att TkInter är Python:s standard GUI-paket. TkInter är ett tunt objektorienterat lager ovanpå Tcl/Tk skrivet i Python. Detta betyder att programmet kommer att kunna köras på samtliga plattformar som PyNest klarar av och som kan hantera Tcl/Tk.
Biologin bakom modellen
Neuron
Det beräknas att antalet neuroner i hjärnan är ungefär 100 miljarder. Neuroner eller nervceller är en celltyp i nervsystemet som kan delas upp i olika typer där de skiljer sig till utseendet, funktion och vart i nervsystemet de är placerade. Det alla neuroner har
gemensamt är att de är uppbyggda på samma sätt. [7]
Figur 2. [7] Visualiserar en neurons uppbyggnad med bland annat dendrit, cellkärna ”somna”, axon.
• Dendrit tar emot nervsignaler, som är elektroniska impulser, och skickar de vidare till somna.
• Cellkärna ”somna” som sitter i mitten. Om den totala inmatningen av nervsignaler överstiger ett visst gränsvärde generas en utsignal.
• Axon skickar ut nervsignaler till andra neuroner.
Kommunikationen mellan neuroner
Nervsignalen som neuroner skickar ut är korta elektroniska pulser som kallas spikar. Eftersom signalen ser likadan ut för liknande neuroner så är det tiden mellan och antalet spikar som har någon betydelse. Det finns alltid en viss tidsrymd mellan spikarna från en neuron, även om signalen till neuronen är stark. Det är omöjligt för en neuron att skicka en till spik direkt efter eller under tiden den skickar en spik. [8]
Membranpotentialen är potentialskillnaden mellan interna celldelen och dess omgivning. Denna potential ligger runt -65 mV om cellen vilar. Membranets potential ändras när neuronen får en spik. Efter att en spik har träffat neuronen ändras potentialen gradvis tillbaka till dess potential som den har i viloläge. Detta visualiseras i figur 3 A nedan. Om spikens ändring av neuronens potential är positiv så är synapsen excitatorisk. Om ändringen är negativ är synapsen inhibitorisk. [9]
Figur 3. [9] A visar neuron j=1 skicka en spik till neuron i och grafen visar resultatet av mätning av membranets potential i i. B visar neuron j=1 skicka en spik och kort därefter skickar neuron j=2 en spik till neuron i vilket leder till en addition i membranpotentialen hos
neuron i. C visar neuron j=1 och neuron j=2 skicka två spikar efter varandra till neuron i vilket leder till en så stor potentialskillnad i membranet att neuron i skickar iväg en spik.
Modellen
Minikolumn är en modell av hur neuroner i hjärnan är sammankopplade. Minikolumner består av grupperingar av 80-120 neuroner som är mer sammankopplade med varandra i samma minikolumn än med närliggande neuroner i andra minikolumner. [3]
Ordet kolumn nämndes först av Mountcastle år 1957. Den rapporten var den första som bevisade organiserade kolumner i neocortex med hjälp av elektrofysiologiska studier. [5] Minikolumner har bevisats finnas i hjärnan i bland annat hörselbarken samt visuella barken. [6]
Det som vill uppnås med denna modell är att stimulera några neuroner, ca. 10%, i minikolumnen med likström så att de ger ifrån sig spikar till de neuroner som de är ihopkopplade med i minikolumnen. Om tillräckligt många spikar träffar en neuron så ska den i sin tur ge ifrån sig spikar till de neuroner som den är ihopkopplad med. I
minikolumnen finns det två typer av neuroner. De neuroner som har excitatoriska synapser ger ifrån sig en positiv spik när de får tillräckligt många spikar till sig för att ge ifrån sig en spik. En minikolumn består av 80% neuroner med excitatoriska synapser, resten har inhibitoriska synapser. Neuronerna med inhibitoriska synapser ger ifrån sig en negativ potential till neuroner den är ihopkopplad med när den blir stimulerad av spikar.
Lösningen
PyNestGUI är uppdelat i två filer vilket lägger till ytterligare ett lager till programmets uppbyggnad som beskrevs tidigare i rapporten. Detta gör det enklare att separera det grafiska gränssnittet och data från simuleringen. Den ena filen (PyNestGUI.py) innehåller kod som bygger upp programmet grafiskt medan den andra filen (simpleminicolumn.py) innehåller en klass som jobbar mot PyNest.
PyNestGUI
Simple-minicolumn PyNest NEST
Python/TkInter Python Python C++
Simpleminicolumn
Denna klass jobbar mot PyNest och skapar en minikolumn i NEST. Det finns ett antal variabler som går att ändra i klassen innan minikolumnen skapas för att finjustera hur minikolumnen ska vara uppbyggd samt att det finns flera andra faktorer som spelar in i själva simuleringen som också går också att justera. Denna fil kan även köras
självständigt för att testa att PyNest och att andra moduler är korrekt installerade. Då filen körs i Python kommer en minikolumn att skapas i NEST och ett resultat kommer visas som en spikdetektor- och ett spänningsdiagram.
När ett neuronnätverk ska byggas upp med hjälp av simpleminicolumn-klassen så skapas det först ett antal neuroner i NEST. Dessa skapas genom anrop till en metod i PyNest. Utan att någon av variablerna ändras så kommer det att skapas 50 neuroner som har excitatoriska synapser och 10 neuroner med inhibitoriska synapser i simulatorn. Varje neuron som skapats indexeras i en lista. Vidare kommer varje neuron som har skapats kopplas ihop med ett visst antal andra slumpvis utvalda neuroner. När neuroner kopplas ihop så sätts tyngden på anslutningen till ett värde beroende på om neuronens synapser är excitatoriska eller inhibitoriska. Normalt sätts excitatoriska synapser till 40.0 och synapser som är inhibitoriska till -40.0. En fördröjning i ms på anslutningen räknas också ut när kopplingen sker mellan neuroner och den baserar sig på avståndet mellan
neuronernas position i listan där de har indexerats. Här visas funktionen som används då fördröjningen räknas ut:
tid =
För att fördröjningen på kopplingen mellan neuronerna ska bli mer slumpmässig så blir fördröjningen ett slumpmässigt värde mellan tid och tid+0.5.
Efter att neuronerna har kopplats ihop så skapas likströmsgeneratorerna. De kopplas ihop med ett slumpvis antal utvalda neuroner med excitatoriska synapser.
Likströmsgeneratorerna används till att stimulera neuronerna som gör så att de ger ifrån sig spikar. Om användaren inte ändrar på strömmen generatorerna ska ge ifrån sig så ligger den på 380 pA. Det är från början 20% av neuronerna med excitatoriska synapser som kommer anslutas till likströmsgeneratorerna.
Då simuleringen är klar hämtas data via den här klassen för att visa resultat. Klassen använder sig av PyNestʼs egna metoder för att visa resultat för spikdetektorn och spänningsmätarna. Det går även att få information om vilka neuroner som spikar vid en viss tidpunkt. Denna information används senare i animationen i PyNestGUI.
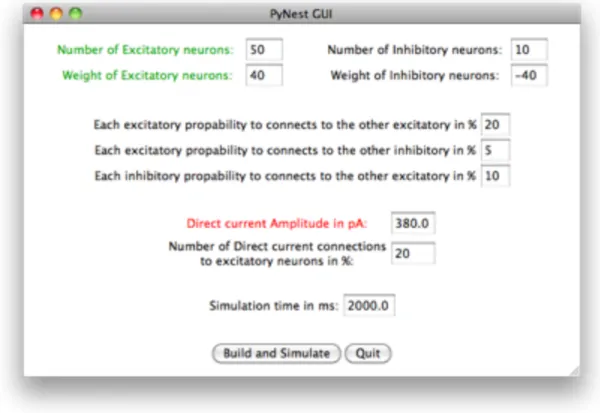
Figur 5. Första fönstret som möter användaren då programmet startas.
PyNestGUI
Denna fil (PyNestGUI.py) innehåller kod för det grafiska gränssnittet som byggs upp med hjälp av Python och TkInter. PyNestGUI jobbar mot simpleminicolumn-klassen för att skapa en minikolumn i NEST och för att få data om resultatet. För att starta programmet skriver användaren ʻpython PyNestGUI.pyʼ i ett terminalfönster i samma katalog där filerna finns. Då kommer python starta och ladda in alla filer samt starta simulatorn NEST. Det kan ta ett tag innan något händer efter användaren har startat programmet då det är en del filer som ska läsas in samt att det tar tid för det grafiska gränssnittet att laddas in och visas. Det första som möter användaren när programmet har startats är ett fönster, se Figur 5, med olika fält som kan ändras. De fält som kan ändras är:
Namn Beskrivning
Number of Excitatory neurons Antalet neuroner med excitatoriska synapser i minikolumnen.
Weight of Excitatory neurons Tyngden som excitatoriska synapser har. Värdet användaren sätter här kommer vara toppen på likströmsspiken neuroner med excitatoriska synapser skickar ut.
Number of Inhibitory neurons Antalet neuroner med inhibitoriska synapser i minikolumnen.
Weight of Inhibitory neurons Tyngden som inhibitoriska synapser har.
Each excitatory propability to connects to the other excitatory in %
Varje neuron med excitatoriska synapser kommer anslutas till så många procent av slumpvis utvalda neuroner med excitatoriska synapser som
användaren sätter det här värdet till.
Each excitatory propability to connects to the other inhibitory in %
Varje neuron med excitatoriska synapser kommer anslutas till så många procent av slumpvis utvalda neuroner med inhibitoriska synapser som
användaren sätter det här värdet till.
Each inhibitory propability to connects to the other excitatory in %
Varje neuron med inhibitoriska synapser kommer anslutas till så många procent av slumpvis utvalda neuroner med excitatoriska synapser som
användaren sätter det här värdet till.
Direct current Amplitude in pA Amplituden som likströmsgeneratorerna ger ifrån sig i pA.
Number of Direct current connections to excitatory neurons in %
Så många procent av slumpvis utvalda neuroner som har excitatoriska synapser kommer få likströmsgeneratorer kopplade till sig.
Simulation time in ms Antalet millisekunder som neuronerna ska simuleras i NEST.
Då användaren har ändrat på de fält för att få ett önskat nätverk trycker användaren på ʻBuild and Simulateʼ knappen för att bygga upp och simulera nätverket av neuroner i NEST. När simuleringen är klar skapas nätverksfönstret som bland annat visar information om neuronerna. Det går bara att simulera ett nätverk åt gången i programmet och därför
blir ʻBuild and Simulateʼ knappen i huvudfönstret inaktivt tills användaren stänger nätverksfönstret.
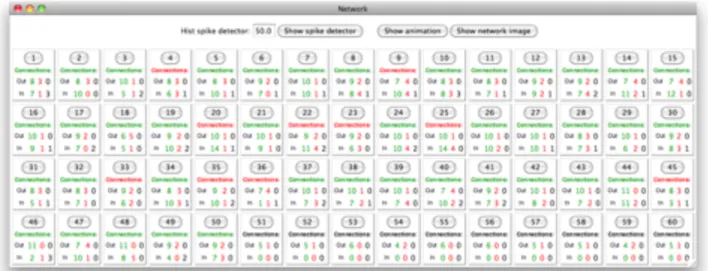
Figur 6. Nätverksfönstret visar information om kopplingarna mellan neuronerna samt knappar som öppnar fönster med resultat från simuleringen.
Nätverksfönstret
Högst upp i nätverksfönstret finns det knappar där bland annat ʻShow spike detectorʼ-knappen är placerad. Dessa knappar och vad som händer när användaren klickar på de beskrivs under egna rubriker senare i rapporten.
Under de översta knapparna finns det rutor som representerar en neuron i simuleringen. I denna ruta kan användaren få information om hur många och vilken sorts neuroner denna neuron är sammankopplad med. Det första fältet med grön text visar hur många neuroner med excitatoriska synapser neuronen är ansluten till. Det andra fältet med röd text säger hur många av neuronerna som den är ansluten till har likström kopplat till sig. Det sista fältet med svart text visar hur många anslutningar den har till neuroner som har inhibitoriska synapser. Av samma anledning är texten ʼConnectionsʼ i olika färger för att visa om neuronen har excitatoriska synapser eller det är en neuron med likström kopplat till sig eller om det är en neuron med inhibitoriska synapser.
Varje ruta innehåller också en knapp med en siffra på. När användaren klickar på knappen skapas det ett nytt fönster med ett diagram i. Diagrammet har fått sin data från
spänningsmätaren som har anslutits till den neuron i simuleringen som siffran på knappen representerar.
En knapp kopplas normalt ihop med en funktion som kommer köras då användaren klickar på knappen. Denna funktion får inte har några parametrar. För att lösa problemet med att koppla ihop en funktion med parametrar med en knapp användes en så kallad curry klass. Denna klass kopplar ihop en funktion med ett antal variabler och associerar den till
knappen. Då användaren klickar på knappen kommer denna funktion med dess variabler att anropas. Med hjälp av curry-klassen kan det finnas många knappar kopplade till en funktion med olika parametrar. I det här programmet används curry-klassen till att koppla
ihop funktionen som visar spänningsmätaren med ett nummer som parameter som representerar en neuronen i simuleringen.
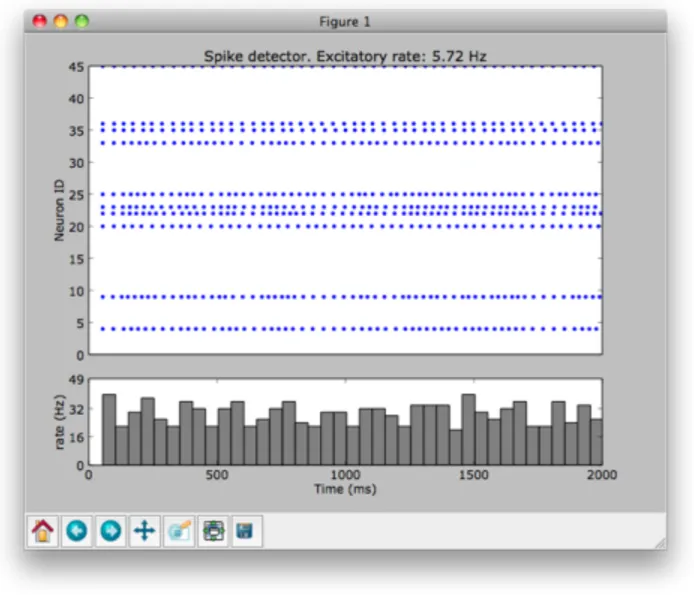
Figur 7. Exempel på hur spik detektor-diagrammet kan se ut. Här visas när neuronerna spikade under simuleringens gång samt vilken frekvens nätverket hade.
Spik detektor
Användaren kan se när neuronerna spikade i simuleringen genom att klicka på ʻShow spike detectorʼ. Då visas ett nytt fönster som är uppdelat i två diagram. De översta
diagrammet visar när neuronerna spikar och den nedre diagrammet visar vilken frekvens nätverket spikar i genom att ta ett medelvärde under en tidsrymd. För att ändra tiden som medelvärdet för frekvensen räknas ut på kan användaren ändra värdet vid ʼHist spike detector:ʼ i nätverksfönstret. I spik detektor-fönstret kan användaren spara diagrammet som en bild genom att klicka på diskettikonen och välja vart bilden ska sparas på datorn.
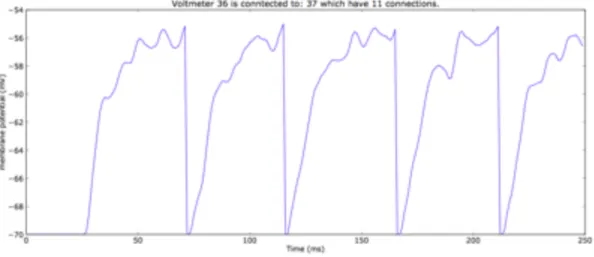
Figur 8. Spänningsmätaren visar membranets potential på en viss neuron genom simuleringen. Här visualiseras en neuron som får spikar till sig och i sin tur ger ifrån sig
spikar ett antal gånger under simuleringen.
Spänningsmätaren
För att visa resultatet av en spänningsmätning på en neuron från simuleringen klickar användaren på knappen med neuronens siffra på i nätverksfönstret. Spänningsmätaren mäter membranets potential på neuronen genom simuleringen. Det går endast att visa en spänningsmätning åt gången eller spikdetektorn i programmet då det finns en begränsning i matplotlib modulen i Python. Matplotlib är programmerat för att bara ska visa ett diagram i slutet på varje skript då det anses så krävande att göra flera diagram. [4] Användaren kan även här spara diagrammet som en bild genom att klicka på diskettikonen och välja vart bilden ska sparas på datorn. Figur 8 ovan visar en sådan bild.
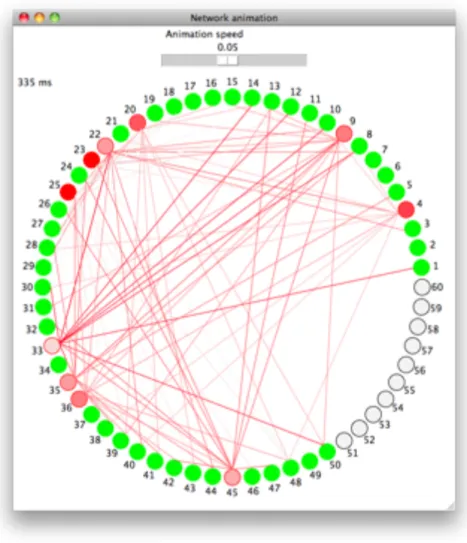
Figur 9. Ett exempel på hur animationen kan se ut. Här visas nätverket efter 335 ms med en fördröjning på 0,05 s mellan varje simulerad millisekund. De olika färgerna visar vilken
typ varje neuron är.
Nätverksanimation
För att få en bättre uppfattning om hur neuronerna spikar i nätverket så kan användaren klicka på ʻShow animationʼ i nätverksfönstret. Då skapas ett nytt fönster som visar en animation av simuleringen då neuronerna spikar. Det som visas är information om tiden samt själva neuronerna som visualiseras med hjälp av cirklar. Neuronerna är placerade runt en cirkel för att enklare kunna visa kopplingarna mellan dem, det har inget att göra med hur neuronerna är placerade i simulatorn. Färgerna visar vilken typ av neuron som visas. Om neuronen är grön betyder det att den har excitatoriska synapser. En neuron med inhibitoriska synapser visas som vit med svart ring. Neuroner med likström kopplat till sig har röd färg. Högst upp i animationsfönstret finns ett reglage som reglerar hastigheten på animationen. Siffran ovanför reglaget visar fördröjningen mellan varje uppdatering i animationen, varje uppdatering motsvarar en ms i simuleringen. Detta betyder att ju längre till vänster reglaget är desto snabbare går animationen och om man drar reglaget till höger går animationen långsammare. Om en neuron spikar så blir den svart och kopplingen från den neuronen till de neuroner som den är kopplade till visas. Direkt efter spiken tonar
färgerna för linjerna ut till vitt så att användaren lättare ska hinna med att uppfatta alla spikar samt att färgen i neuronen kommer tillbaka.
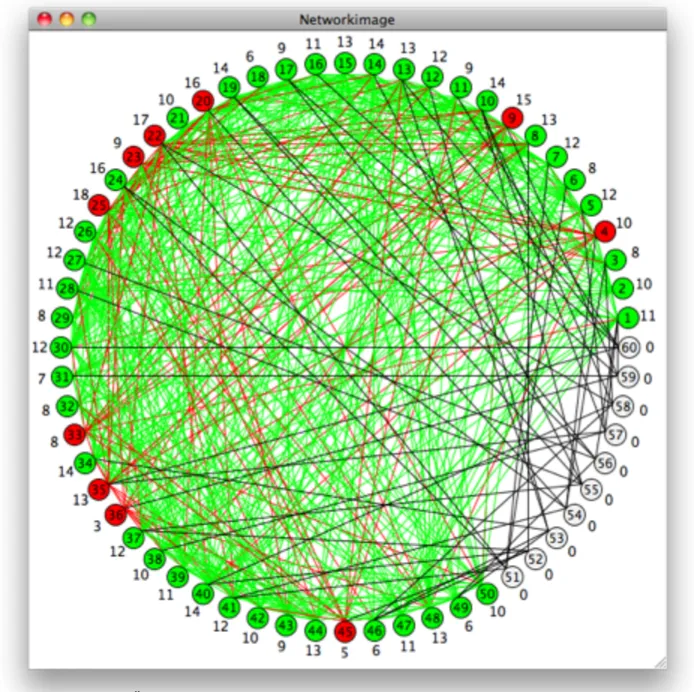
Figur 10. Översikt om hur neuronerna är sammankopplade i simuleringen.
Nätverksöversikt
I nätverksfönstret finns det en knapp som heter ʻShow network imageʼ. Om användaren klickar på den knappen skapas ett nytt fönster där neuronerna visualiseras på samma sätt som i animationen men i det här fönstret visualiseras alla kopplingar samtidigt samt alla neuroner.
Slutsatser
Detta arbete skulle först handla om att simlera minikolumner som finns i hjärnans visuella bark i PyNest. Då det inte fanns en tydlig problemställning eller hur resultatet skulle presenteras så gick arbetet vidare med att bara simulera en enkel minikolumn i PyNest. Då denna relativt enkla uppgift visade sig vara ganska svår att genomföra formulerades arbetet om till vad den är nu. Projektet handlade nu om att göra ett grafiska gränssnitt till PyNest så att tröskeln för att simulera en minikolumn och analysera resultatet inte skulle vara så hög.
Det fanns inte mycket att välja på när det gällde vilket grafiskt gränssnitt som skulle användas. Antingen skulle programmet bara kunna köras på MAC datorer med hjälp av PyObjC eller så skulle programmet kunna köras på samtliga operativsystem som PyNest klarade av med hjälp av TkInter.
Utseendet på det grafiska gränssnittet har ändrats under projektet gång, från att i början välja hur många spänningsmätare och vart de skulle sitta manuellt till vad det är nu då det det sitter en spänningsmätare på varje neuron. Detta för att användaren ska ha möjlighet att se på samtliga mätningar på neuronerna för att ha mer data att jobba med för att kunna analysera resultatet.
Begränsningen i att användaren bara kan visa ett ett diagram av spänningsmätaren på en neuron åt gången eller spikdetektorn är en begränsning som inte gick att lösa på ett enkelt sätt. Detta kan lösas genom att användaren får spara diagrammet som en bild och sedan jämföra bilderna.
I början av projektet så var nätverksöversiktsbilden i nätverksfönstret. Det var den bilden användaren använde sig av den för att välja vilka neuroners potential som skulle mätas. Nätverksöversiktsbilden fyller ingen större funktion i den slutgiltiga versionen men det går fortfarande att visa den för att visualisera hur många kopplingar som har gjorts i nätverket samt se alla neuroner.
Det sista som programmerades i PyNestGUI var animationen av nätverket. Den kunde göras på två sätt; antingen genom att skicka data till Matplotlib eller genom programmera en animation själv i TkInter. Matplotlib kan visa animationer på diagram som ändras genom tiden men kan inte visa modeller på ett lätt sätt. Animationen blev programmerad i TkInter då det var lättast att ändra exakt hur modellen ska visas och användaren kan ändra hastigheten på animationen med hjälp av ett reglage.
Detta arbete skulle kunna utvecklas så att det skulle klara av flera modeller om hur neuroner är sammankopplade. Användaren skulle kunna välja vilken typ av neuron som ska användas i simuleringen samt att användaren själv ska kunna ställa in vilka
inställningar som skulle användas på neuronerna. Användaren skulle även kunna spara alla resultat av simuleringen som en bild så att det skulle bli lättare att analysera resultatet i efterhand.
Det slutgiltiga programmet blev ett lyckat resultat av det här projektet. Programmet kan nu göra det som var tänkt från början. Användaren har ett verktyg för att komma igång med NEST samt visa resultat av simulering där användaren själv kan ändra på vissa variabler.
Källhänvisning
[1] NEST, The Neural Simulation Technology Initiative, måndag den 5 oktober 2009 # http://www.nest-initiative.uni-freiburg.de/index.php/Software:About
[2] Eppler JM, Helias M, Muller E, Diesmann M, Gewaltig MO (2009) # PyNEST: a convenient interface to the NEST simulator
[3] Cortical minicolumn, Wikipedia. måndag den 5 oktober 2009 # http://en.wikipedia.org/wiki/Cortical_minicolumn
[4] Using matplotlib in a python shell, matplotlib. tisdag den 13 oktober 2009 # http://matplotlib.sourceforge.net/users/shell.html
[5] Mountcastle VB. Modality and topographic properties of single neurons of catʼs somatic sensory cortex. J Neurophysiol 1957; 20: 408–34.
[6] Vernon B. Mountcastle. The columnar organization of the neocortex. [7] Nervcell, Wikipedia. söndag den 15 november 2009
# http://sv.wikipedia.org/wiki/Nervcell
[8] 1.1 Elements of Neuronal Systems. Spiking Neuron Models. Single Neurons, Populations, Plasticity. söndag den 15 november 2009
# http://icwww.epfl.ch/~gerstner/SPNM/node3.html
[9] 1.2 Elements of Neuronal Dynamics. Spiking Neuron Models. Single Neurons, Populations, Plasticity. söndag den 15 november 2009
Bilagor
Bilaga 1 - simpleminicolumn.py
#! /usr/bin/env python # Author: Nicklas Haglund #
# This file implements the simpleminicolumnmodel class. It will first try to # load the PyNest module and exit with an error if that fails. The
# simpleminicolumnmodel will create neurons in NEST with help of PyNest. # This neurons can either be excitatory or inhibitory neurons. They will # connect to each other and form a minicolumn. Some of the excitatory neurons # will be connected to a DC generator in NEST. The class will also create # voltmeters and spike detectors in NEST that are connected to each neuron. # This class is build to work with the PyNestGUI so that it would be
# easier to build and get result from the simulation.
from __future__ import division! ! #True division. Ex. '5/2' will give 2.5
! ! ! ! ! ! ! ! ! #If it was not imported the result from '5/2' will be 2
import random!! ! #The neurons will connect to other random selected neurons
from copy import copy! #This makes it easier to copy arrays.
try:! ! ! ! #Try to import PyNest
! import nest
except:! ! ! ! #If it fails, quit with an error.
! print 'You have not installed PyNest!' ! raise
class simpleminicolumnmodel():
! """Build a simple neuron network with the help of PyNest. ! ! """ ! ! ! def __init__(self): ! ! """Init values. ! ! ! ! """
! ! self.sim_time = 2000.0! ! ! ! #Simulation time in ms.
! ! self.num_excitatory = 50! ! ! #Number of excitatory neurons.
! ! self.num_inhibitory = 10! ! ! #Number of inhibitory neurons.
! !
! ! #exc -> exc 20%
! ! self.exci_to_exci_con_prob = 0.2!#Each excitatory propability to connects to the other excitatory
! ! #exc -> inhi 5%
! ! self.exci_to_inhi_con_prob = 0.05!#Each excitatory propability to connects to the other inhibitory
! ! #inhi -> exc 10%
! ! self.inhi_to_exci_con_prob = 0.1!#Each inhibitory propability to connects to the other excitatory
! !
! ! self.exc_weight = 40.0! ! ! ! #Excitatory neurons weight.
! ! self.inh_weight = -40.0! ! ! ! #Inhibitory neurons weight.
! ! self.dc_procent = 0.2! ! ! ! #Number of Direct current connections to excitatory neurons
! ! self.dc_amplitude = 380.0! ! ! #Direct current Amplitude in pA
! !
! def build(self):
! ! """Reset NEST and builds the neuron network. ! !
! ! This method will create neurons and connect them.
! ! It will also create the DC generators and connect them to the excitatory neurons. ! ! """ ! ! ! ! #Reset NEST ! ! nest.ResetKernel() ! ! ! ! #Create neurons
! ! if self.num_excitatory > 0:! ! #If the user want to create excitatory neurons.
! ! ! self.excitatory = nest.Create("iaf_neuron", self.num_excitatory) ! ! else:
! ! ! self.excitatory = [] ! ! ! self.num_excitatory = 0 ! ! !
! ! if self.num_inhibitory > 0:! ! #If the user want to create inhibitory neurons.
! ! ! self.inhibitory = nest.Create("iaf_neuron", self.num_inhibitory) ! ! else:
! ! ! self.inhibitory = [] ! ! ! self.num_inhibitory = 0 ! !
! ! #Count conntections to each neuron.
! ! #This makes it easy to get information later about the connections.
! ! self.connected_neuron = [0]*(self.num_excitatory+self.num_inhibitory+1) ! ! ! ! ! ! #Count connections ! ! count = 0 ! !
! ! #Connect excitatory neurons to other neurons
! ! for cur_neuron in self.excitatory:
! ! ! temp = copy(self.excitatory)! #Copy the neuron array so it dont mess up the original
! ! ! temp.remove(cur_neuron)! ! ! #array when removing the 'cur_neuron'.
! ! !
! ! ! #Get 'exci_to_exci_con_prob' (20%) excitatory random neurons to connect with cur_neuron
! ! ! random_neurons = random.sample( temp, int (self.num_excitatory*self.exci_to_exci_con_prob) )
! ! ! for cur_random_neuron in random_neurons:
! ! ! ! #Connect 'cur_neuron' with 'cur_random_neuron' with a weight and a delay.
! ! ! ! nest.Connect([cur_neuron], [cur_random_neuron], random.uniform (self.exc_weight-2.5, self.exc_weight+2.5), self.calcDelay(cur_neuron,
cur_random_neuron))
! ! ! ! self.connected_neuron[cur_random_neuron] += 1 ! ! ! ! count +=1
! ! !
! ! ! #Get 'exci_to_inhi_con_prob' (5%) inhibitory random neurons to connect with cur_neuron
! ! ! random_neurons = random.sample( self.inhibitory, int (self.num_inhibitory*self.exci_to_inhi_con_prob) )
! ! ! for cur_random_neuron in random_neurons:
! ! ! ! #Connect 'cur_neuron' with 'cur_random_neuron' with a weight and a delay.
! ! ! ! nest.Connect([cur_neuron], [cur_random_neuron], random.uniform (self.inh_weight-2.5, self.inh_weight+2.5), self.calcDelay(cur_neuron,
cur_random_neuron))
! ! ! ! self.connected_neuron[cur_random_neuron] += 1 ! ! ! ! count +=1
! ! ! ! !
! ! #Connect inhibitory neurons to other neurons
! ! for cur_neuron in self.inhibitory:
! ! ! #Get 'inhi_to_exci_con_prob' (10%) excitatory random neurons to connect with cur_neuron
! ! ! random_neurons = random.sample( self.excitatory, int (self.num_excitatory*self.inhi_to_exci_con_prob) )
! ! ! for cur_random_neuron in random_neurons:
! ! ! ! #Connect 'cur_neuron' with 'cur_random_neuron' with a weight and a delay.
! ! ! ! nest.Connect([cur_neuron], [cur_random_neuron], random.uniform (self.inh_weight-2.5, self.inh_weight+2.5), self.calcDelay(cur_neuron,
cur_random_neuron)) #params={'weight': 40.0,'delay': 2.0}
! ! ! ! self.connected_neuron[cur_random_neuron] += 1 ! ! ! ! count +=1 ! ! ! ! ! ! ! ! #Create DC
! ! num_dc = int(self.num_excitatory*self.dc_procent)! #Number of DC to create
! ! if num_dc > 0:
! ! ! dc=nest.Create("dc_generator",num_dc)! ! ! #Create DC
! ! ! nest.SetStatus(dc, {"amplitude":self.dc_amplitude, 'start': 10.0});! #Set the amplitud and start time.
! ! !
! ! ! #Connect DC to random excitatory neurons.
! ! ! self.excitatory_connected_to_dc = random.sample(self.excitatory, num_dc)! #Select random excitatory neurons.
! ! ! nest.Connect(dc,
self.excitatory_connected_to_dc)! ! ! ! ! ! ! #Connect them.
! ! else:
! ! ! self.excitatory_connected_to_dc = [] ! !
! !
! ! #Print informaiton
! ! print "\n\nBuild complete!\nConnections: " + str(count) ! ! nest.PrintNetwork() ! ! ! ! ! ! ! def calcDelay(self, a, b):
! ! """Calculate the distance between a and b. ! !
! ! a, b: index number
! ! Returns: Float between 0.1 and 10.5 ! ! """
! !
! ! tot = self.getNrNeurons()! ! #Get how many neurons there are in the simulation.
! ! delta = abs(a-b)! ! ! ! #Calculate the distance between the neurons.
! ! !
! ! delta = float(10*delta/tot)! ! #How big the distance is relativ to the total number of neurons.
! ! ! ! ! ! ! ! ! ! #Multiply so the value will be from 0-10.
! !
! ! #The returned value can't be 0
! ! if delta <= 0: ! ! ! delta = 0.1 ! !
! ! #Return a random value between delta and delta+0.5
! ! return random.uniform(delta, delta+0.5) !
! ! !
! ! """Get all excitatory neurons with no DC connection. ! !
! ! Returns: Array with excitatory that dont have DC connetion. ! !
! ! This method will copy the excitatory array to a new array and ! ! take out the neurons that have a DC connection.
! ! """
! !
! ! excitatory_no_dc = copy(self.excitatory)! ! #Copy the array.
! ! for exc_dc in self.excitatory_connected_to_dc:!#Loop trough the "excitatory with no dc" array.
! ! ! try:
! ! ! ! excitatory_no_dc.remove(exc_dc)! ! ! #Try to remove the neuron from the 'excitatory_no_dc' array.
! ! ! except:
! ! ! ! pass
! !
! ! #Return the array.
! ! return excitatory_no_dc ! ! ! ! ! ! ! def connectInstrument(self):
! ! """Connects voltmeters and spike detectors to neurons. ! !
! !
! ! """
! !
! ! #Array that will hold the voltmeters
! ! self.voltmeters = [] ! !
! ! #Get all the neurons to one array.
! ! neurons = self.excitatory + self.inhibitory ! !
! ! #Loop trough the neuron array and create a voltmeter to each of them.
! ! for neuron in neurons:
! ! ! self.voltmeters.append(nest.Create("voltmeter")) ! !
! ! #Set the status of the voltmeters.
! ! nest.SetStatus(self.voltmeters, {"label": "voltmeter","withtime": True,"withgid": True,"interval": 1.})
! !
! ! #Connect the voltmeters to the neurons.
! ! for i, v in enumerate(neurons):
! ! ! nest.Connect(self.voltmeters[i],[v]) ! !
! ! ! !
! ! self.sd = nest.Create('spike_detector')!! ! #Create Spike detector
! ! nest.SetStatus(self.sd, {"withgid": True, "withtime": True})! #Set status
! ! nest.ConvergentConnect(neurons, self.sd)! #Connect the all neurons to the spike detector.
! !
! ! #Print information about the new network
! ! print "\n\nInstruments connected to network."
! ! nest.PrintNetwork() ! ! ! ! ! def getConnections(self):
! ! """Get connection information from PyNest. ! !
! ! Returns: Dictionary of each neuron connections to other neurons. ! ! """
! ! #This will hold the information in a tuple.
! ! #Ex ((NeuronNumber, [Connected neuron-array]), )
! ! list = () ! !
! ! #Loop trough the neurons.
! ! for neuron in self.excitatory + self.inhibitory:
! ! ! data = nest.GetConnections([neuron], "static_synapse")! #Get data from NEST.
! ! ! list += (neuron, data[0]['targets']),! #Add the data to the tuple.
! !
! ! return dict(list)! #Make a dictionary of the 'list' and return it.
! ! ! ! !
! def getInputConnections(self):
! ! """Get a dictionary with neurons and which neurons that they are connected with.
! !
! ! Returns: A dictionary with neurons and which neurons that they are connected with.
! ! """
! ! #Get information of all the connections.
! ! data = self.getConnections() ! !
! ! #Array that hold all the neurons
! ! neurons = self.excitatory + self.inhibitory ! !
! ! #This will hold the information in a tuple.
! ! #Ex ((NeuronNumber, [Connected neuron-array]), )
! ! list = () ! !
! ! #Loop trough the neurons
! ! for neuron in neurons:! #Find any neuron that are connected to the 'neuron'
! ! !
! ! ! found = []! #Array to save the connected neurons in.
! ! !
! ! ! for search in neurons:! #Look in the 'search' neuron to find a connection to 'neuron'.! !
! ! ! ! if neuron in data[search]:!! #If 'neuron' is in i the 'data[search]' array
! ! ! ! ! ! found.append(search)! #add it to the 'find' array.
! ! !
! ! ! list += (neuron, found), #Add the data to 'list'
! !
! ! return dict(list)! #Make a dictionary of the 'list' and return it.
! ! !
! def getNrNeurons(self):
! ! """Returns the total numbers of excitatory and inhibitory neurons. ! !
! ! Returns: Total numbers of excitatory and inhibitory neurons. ! ! """
! ! return self.num_excitatory + self.num_inhibitory ! ! ! ! ! def sim(self): ! ! """Simulate. ! !
! ! This method will call the nest method to simulate the neuron network. ! ! """ ! ! nest.Simulate(self.sim_time) ! ! ! ! !
! def sp_result(self, binwidth=50.0): ! ! """Show spike detector result. ! !
! ! binwidth: Value in ms to get the average spike activity. ! !
! ! This method will show result of the simulation from the spike detector ! ! with help of pylab.
! ! """
! !
! ! import nest.raster_plot! #Module that makes the plot.
! !
! ! events_ex = nest.GetStatus(self.sd, "n_events") [0]! ! ! ! #Get data from NEST.
! ! rate_ex = events_ex/self.sim_time*1000.0/len(self.excitatory) ! #Calculate the average spike activity.
! !
! ! #Make the plot and show the plot.
! ! nest.raster_plot.from_device(self.sd, hist=True, title="Spike detector. " +
"Excitatory rate: %.2f Hz" % rate_ex , hist_binwidth=binwidth) ! ! ! ! ! ! def sp_data(self):
! ! """Get spike detector data. ! !
! ! Returns: Array of 'times' when the 'senders' spikes. ! !
! ! This method will return information from NEST when spikes from neuron occurred
! ! during the simulation. ! ! """
! ! dev = self.sd #Spike detector id
! ! if not nest.GetStatus(dev)[0]['model'] == 'spike_detector':!#Check if it is a spike detector.
! ! ! raise Exception("please provide a spike_detector") ! !
! ! ev = nest.GetStatus(dev,'events')[0]! #Get the data from NEST
! ! return ev['times'], ev['senders']!#Return the data.
! ! ! !
! def volt_result(self, nr):
! ! """Show voltmeter with help of pylab. ! !
! ! nr: The voltmeters number in voltmeters array. ! ! """
! ! import nest.voltage_trace!#Module that makes the plot.
! !
! ! #Get data from NEST.
! ! data = nest.GetConnections([self.voltmeters[nr]],
"static_synapse")! #Get connection information from the voltmeter.
! ! neuron = data[0]['targets'][0]! #The neuron which the voltmeter is connected to.
! !
! ! #String with information about the neuron.
! ! volt_info = "Voltmeter " + str(nr) + " is conntected to " + str(neuron) + " which have " + str(self.connected_neuron[neuron]) + " connections."
! !
! ! #Make and show the plot.
! ! nest.voltage_trace.from_device(self.voltmeters[nr], None, volt_info)
if __name__ == '__main__': ! """Test minicolumn. !
! If the user run this script alone in python then this code will be executed. ! It will build up a minicolumn in NEST and show the result of the simulation ! in a spike detector plot and a voltmeter plot.
! column = simpleminicolumnmodel()! #Create a instance of the simpleminicolumn class.
! column.build()!! ! ! ! ! #Build the minicolumn.
! column.connectInstrument()! ! ! #Connect the voltmeters and the spike detector.
! column.sim()! ! ! ! ! ! #Simulate.
! column.sp_result()! ! ! ! ! #Show the spike detector plot.
Bilaga 2 - curry.py
#Source: http://code.activestate.com/recipes/52549/
class curry:
def __init__(self, fun, *args, **kwargs): self.fun = fun
self.pending = args[:] self.kwargs = kwargs.copy() def __call__(self, *args, **kwargs): if kwargs and self.kwargs: kw = self.kwargs.copy() kw.update(kwargs) else:
kw = kwargs or self.kwargs
Bilaga 3 - PyNestGUI.py
#! /usr/bin/env python # Author: Nicklas Haglund #
# This file creates windows with TkInter. Theses windows are:
# *! PyNestGUI: Contains entries where the user can change variables
#! in the simpleminicolumn class. This window also contains a 'Quit'-button #! and the 'Build and Simulate'-button witch creates the Network window. #
# *! Network: This window contains information about the results from the simulation. #! The user can get information from the spikedetector and voltmeter.
#! The program will create a new window with a animation
#! of the neuron network if the user press the 'Show animation'-button. #! If the user press 'Show network image'-button then a new window with a #! image of the neuron network will show.
#
# *! Spike detector: Contains information about the neurons when they spiked #! during the simulation. This windows uses PyNest own module, nest.raster_plot, #! to create spikedetector diagram.
#
# *! Voltmeter: Contains information about neurons potential during the
#! simulation. This window is created with the help of the nest.voltage_trace #! module.
#
# * Network animation: This windows contains a slider where the user can change
#! the animation speed and the animation of the neuron network during the simulation. #! If a neuron spike then the connection from that neuron will show and then fade back.
#!
# *! Networkimage: This window contains a image of the neuron in the network and #! the all the connections between them.
from __future__ import division! ! #True division. Ex. '5/2' will give 2.5
! ! ! ! ! ! ! ! ! #If it was not imported the result from '5/2' will be 2
from Tkinter import * #Imports the entire Tkinter package into this program's namespace.
class Application(Frame): ! #The program inherit from Tkinter's Frame class.
"""GUI for PyNest
This class is the main program. """
def __init__(self, master=None):
Frame.__init__(self, master) ! #Calls the constructor for the parent class, Frame
self.master.title("PyNestGUI")! #This method will set the title of the main window to PyNestGUI
self.grid(padx=10,pady=10)! ! #Adding some space to border of the window.
self.createWidgets()! ! ! #Calls the method that creates the widgets in the main window.
def createWidgets(self):
"""Creates widgets for the main window.
This method will create all the widgets in the main window of PyNestGUI. """
firstInputFrame = Frame(self, borderwidth=2)!#Creates a frame in the main window
firstInputFrame.grid(row=0, column=0)! ! ! #that will be placed at row 0 and column 0.
excitatoryFrame = Frame(firstInputFrame, borderwidth=2)! #Creates a frame in the firstInputFrame
excitatoryFrame.grid(row=0, column=0, padx=20)! ! ! #that is place at row 0 and column 0.
#Creates a label and place it in the excitatoryFrame.
Label(excitatoryFrame, anchor=W, foreground="#090", text="Number of Excitatory neurons: ").grid(row=0, column=0)
#Create entry in the excitatoryFrame where information about how many excitatory neuron there will be in the simulation.
self.nr_exc_entry = Entry (excitatoryFrame, exportselection=0, width=4) self.nr_exc_entry.grid(row=0, column=1) #Place the entry in the frame.
self.nr_exc_entry.insert(0, "50")! ! #Set an initial value to the entry.
#Creates a label and place it in the excitatoryFrame.
Label(excitatoryFrame, anchor=W, foreground="#090", text="Weight of Excitatory neurons: ").grid(row=1, column=0)
#Create entry in the excitatoryFrame where information about the weight the excitatory neurons will have in the simulation.
self.weight_exc_entry = Entry (excitatoryFrame, exportselection=0, width=4) self.weight_exc_entry.grid(row=1, column=1) #Place the entry in the frame.
self.weight_exc_entry.insert(0, "40")! ! #Set an initial value to the entry.
inhibitoryFrame = Frame(firstInputFrame, borderwidth=2)! #Creates a frame in the firstInputFrame
inhibitoryFrame.grid(row=0, column=2, padx=20)! ! ! #that is place at row 0 and column 2.
#Creates a label and place it in the inhibitoryFrame.
Label(inhibitoryFrame, text="Number of Inhibitory neurons: ").grid(row=0, column=0)
#Create entry in the inhibitoryFrame where information about how many inhibitory neuron there will be in the simulation.
self.nr_inh_entry = Entry (inhibitoryFrame, exportselection=0, width=4) self.nr_inh_entry.grid(row=0, column=1) #Place the entry in the frame.
self.nr_inh_entry.insert(0, "10")! ! #Set an initial value to the entry.
#Creates a label and place it in the inhibitoryFrame.
Label(inhibitoryFrame, text="Weight of Inhibitory neurons: ").grid(row=1, column=0)
#Create entry in the inhibitoryFrame where information about the weight the inhibitory neurons will have in the simulation.
self.weight_inh_entry = Entry (inhibitoryFrame, exportselection=0, width=4) self.weight_inh_entry.grid(row=1, column=1)! #Place the entry in the frame.
self.weight_inh_entry.insert(0, "-40")!! #Set an initial value to the entry.
self.secondInputFrame = Frame(self, borderwidth=2)! ! #Creates a frame in the main window
self.secondInputFrame.grid(row=1, column=0, pady=20)! #and place it in the window.
#Array that contains information about labels in values to the next widgets.
structure = [["Each excitatory propability to connects to the other excitatory in %", "20"],
! ! ! ["Each excitatory propability to connects to the other inhibitory in %", "5"],
! ! ! ["Each inhibitory propability to connects to the other excitatory in %", "10"]
! ! ! ]
! ! ! ! ! #This is later used to get information from the entries created here.
row=2!! ! ! #Which row to place the widget.
for s in structure:
! Label(self.secondInputFrame, text=s[0]).grid(row=row, column=0) #Create label
! self.entry.append(Entry(self.secondInputFrame, exportselection=0, width=3))
#Create entry
! self.entry[-1].grid(row=row, column=1) #Place the entry in the frame
! self.entry[-1].insert(0, s[1]) #Set an initial value to the entry.
! row+=1 #Increase row.
thirdInputFrame = Frame(self, borderwidth=2)!#Creates a frame in the main window
thirdInputFrame.grid(row=2, column=0)! ! ! #and place it in the window.
#Creates a label and place it in the thirdInputFrame.
Label(thirdInputFrame, anchor=W, foreground="#F00", text="Direct current Amplitude in pA:").grid(row=0, column=0)
self.dc_amp = Entry (thirdInputFrame, exportselection=0, width=5) #Create entry
self.dc_amp.grid(row=0, column=1)! #Place the entry in the frame
self.dc_amp.insert(0, "380.0")! ! #Set an initial value to the entry.
#Creates a label and place it in the thirdInputFrame.
Label(thirdInputFrame, anchor=W, text="Number of Direct current connections\nto excitatory neurons in %:").grid(row=1, column=0)
self.dc_pro = Entry (thirdInputFrame, exportselection=0, width=5) #Create entry
self.dc_pro.grid(row=1, column=1)! #Place the entry in the frame
self.dc_pro.insert(0, "20")! ! ! #Set an initial value to the entry.
fourthInputFrame = Frame(self, borderwidth=2) ! ! #Creates a frame in the main window
fourthInputFrame.grid(row=3, column=0, pady=20)! ! #and place it in the window.
#Creates a label and place it in the fourthInputFrame.
Label(fourthInputFrame, anchor=W, text="Simulation time in ms:").grid(row=0, column=0)
! self.sim_ent = Entry (fourthInputFrame, exportselection=0, width=6)!#Create entry
self.sim_ent.grid(row=0, column=1)! #Place the entry in the frame
self.sim_ent.insert(0, "2000.0")! #Set an initial value to the entry.
#Buttons
buttonFrame = Frame(self, borderwidth=2)! #Creates a frame in the main window
buttonFrame.grid(row=4, column=0)! ! ! #and place it in the window.
#Create buttons and place it in the buttonFrame.
self.buildButton = Button (buttonFrame, text='Build and Simulate', command=self.buildNetwork )
self.buildButton.grid(row=0, column=0)
self.quitButton = Button (buttonFrame, text='Quit', command=self.quit ) self.quitButton.grid(row=0, column=1) def buildNetwork(self):
!"""Create simpleminicolumnmodel and build the network in NEST. !
! the network in NEST.
! The program uses the get method to get information about the values in the entries. ! """
!
!import simpleminicolumn !
!#Create a instance of the simpleminicolumn class
! model = self.model = simpleminicolumn.simpleminicolumnmodel() !
!#Update the variables in the model from the entries from the main window.
! model.num_excitatory = int(self.nr_exc_entry.get())! ! ! #Number of excitatory neurons.
! model.exc_weight = float(self.weight_exc_entry.get())! ! #Weight of the excitatory neurons.
! model.inh_weight = float(self.weight_inh_entry.get())! ! #Weight of the inhibitory neurons.
! model.num_inhibitory = int(self.nr_inh_entry.get())! ! ! #Number of inhibitory neurons.
!
!# "Each excitatory propability to connects to the other excitatory in %"
! model.exci_to_exci_con_prob = float(int(self.entry[0].get())/100)! !# "Each excitatory propability to connects to the other inhibitory in %"
! model.exci_to_inhi_con_prob = float(int(self.entry[1].get())/100)
!# "Each inhibitory propability to connects to the other excitatory in %"
! model.inhi_to_exci_con_prob = float(int(self.entry[2].get())/100) ! !
!
! model.dc_amplitude = float(self.dc_amp.get())! ! ! #DC amplitud
! model.dc_procent = float(int(self.dc_pro.get())/100)! #Number of Direct current connections to excitatory neurons in %
! !
! model.build() # Build the network in NEST.
!
!#User can't build new network until the network window is closed.
! self.buildButton.config(state=DISABLED) !
!#Connect the voltmeters and spikedetector to the neurons.
! model.connectInstrument() !
!
! model.sim_time = float(self.sim_ent.get())! #Update the simulation time in the model.
! model.sim()! ! #Start the simulation in NEST.
! !
! self.shownetwork(model)! ! #Show the Network window.
! ! ! ! !
def shownetwork(self, model):
!"""Makes new window with the neuron network. !
! This window contains information about the results from the simulation. ! The user can get information from the spikedetector and voltmeter.
! This window has information about each neurons connection to other neurons. ! Image of the neuron network and animation can reached from this window. ! """
! !
! self.top = Toplevel() ! ! #Create window
! self.top.title("Network")! #Set the Title
!
!#When this window is closing then close_shownetwork method will run.
! !
! inputFrame = Frame(self.top, borderwidth=2)! #Create a frame that will contain other frames
inputFrame.grid(row=0, column=0, pady=10)! #and place it in the window.
!
SpikeInputFrame = Frame(inputFrame, borderwidth=2)! #Create a frame in the inputFrame
SpikeInputFrame.grid(row=0, column=3, padx=20)! ! #and place it in the window.
!
!#Create and place a label in the SpikeInputFrame frame.
! Label(SpikeInputFrame, anchor=W, text="Hist spike detector:").grid(row=0, column=0) !
! sp_ent = Entry (SpikeInputFrame, exportselection=0, width=4 ) #Create entry
! sp_ent.insert(0, 50.0)! ! ! #Set an initial value to the entry.
! sp_ent.grid(row=0, column=1)!#Place the entry in the frame.
! !
!#lambda function solves the problem with a parameter to a function that is a command to a button.
! func = lambda: model.sp_result(float(sp_ent.get())) !
!#Create button that shows the spike detector-window
! Button (SpikeInputFrame, text='Show spike detector', command=func ).grid(row=0, column=2)
#Create button that will show the animation window.
Button (inputFrame, text='Show animation', command=self.winAnimation ).grid (row=0, column=4)
#Create button that will show the window with the image over the network.
Button (inputFrame, text='Show network image', command=self.networkmap).grid (row=0, column=5)
neuronFrame = Frame(self.top, borderwidth=2)!#Create a frame in the in this window
! neuronFrame.grid(row=1, column=0)! ! ! ! #and place it.
!
!#This method will fill the neuronFrame frame with information about the neurons in the simulation. ! self.infoFrame(neuronFrame) def close_shownetwork(self):
!"""Method is called when Network window is closed. !
! """
! self.buildButton.config(state=NORMAL)! #Set the 'Build and Simulate' to normal
! self.top.destroy()! ! ! ! ! ! #Close the Network window.
def infoFrame(self, frame):
!"""Print information about neurons in the frame. !
! frame: Frame widget where the information about the neurons will be placed. ! This method will fill the frame with information about the neurons in the simulation and
! a button to each neuron to their voltmeter result. ! """
!
!#This curry class is used to use functions with parameters to a button command.
!from curry import curry !
!#Get information
! connections = self.model.getConnections()!! ! #Dictionary of all the neurons and their output connections.
! inputConnections = self.model.getInputConnections()! #Dictionary of all the neurons and their input connections.
! !
! rowFrame = 0! ! #Variable that will handle which row to use.
! columnFrame = 0! ! #Variable that will handle which column to use.
! !
!#This loop will create a frame that contains informations about each neuron in the simulation.
!for i, neuron in enumerate(connections):!#enumerate method will return an enumerate object.
!
! ! tmpFrame = Frame(frame, borderwidth=2,
relief="raised")! ! ! #Create frame with a border that contains information about one neuron.
! ! tmpFrame.grid(row=rowFrame, column=columnFrame, padx=2,pady=2)! #and place it in the frame.
! ! ! !
! ! #Create voltmeter button with help of the curry class.
! ! #The 'self.model.volt_result' method with 'i' as parameter will run if user press the button.
! ! Button (tmpFrame, text=str(neuron), command=curry(self.model.volt_result, i) ).grid(row=0, column=0)
! ! ! !
! ! color,out_color = self.neuronColor(neuron) #This will get the color of the 'Connections' text.
! !
! ! #Change the green color to darkgreen
! ! if out_color == "#0F0": ! ! ! out_color = "#090"
! ! ! !
! ! #Create label and place it in the frame.
! ! Label(tmpFrame, text="Connections:", foreground=out_color, font= ("Helvetica", "10", "bold")).grid(row=1, column=0)
! !
! ! dataFrame = Frame(tmpFrame)! ! #Create frame that holds information about the neurons connections.
! ! dataFrame.grid(row=2, column=0)! #Place the frame.
! ! ! !
! ! num_out_Excitatory_dc = num_out_Inhibitory = num_out_Excitatory = 0 #Zero out variables
! !
! ! #This loop will check what kind of neurons this neuron 'i' is connected to .
! ! for i in connections[neuron]:
! ! ! if i in self.model.excitatory_connected_to_dc: #Check if neuron is in the 'excitatory_connected_to_dc' array.
! ! ! ! num_out_Excitatory_dc += 1
! ! ! elif i in self.model.inhibitory:!#Check if the neuron is an inhibitory neuron. ! ! ! ! num_out_Inhibitory += 1 ! ! ! else:! ! ! ! ! ! ! ! #Else it is an excitatory neuron. ! ! ! ! num_out_Excitatory += 1 ! ! ! !
! ! num_in_Excitatory_dc = num_in_Inhibitory = num_in_Excitatory = 0 #Zero in variables
! ! #This loop will check what kind of neurons that are connected to this neuron 'i'.
! ! for i in inputConnections[neuron]:
! ! ! if i in self.model.excitatory_connected_to_dc: #Check if neuron is in the 'excitatory_connected_to_dc' array.
! ! ! ! num_in_Excitatory_dc += 1
! ! ! elif i in self.model.inhibitory:!#Check if the neuron is an inhibitory neuron. ! ! ! ! num_in_Inhibitory += 1 ! ! ! else:! ! ! ! ! ! ! ! #Else it is an excitatory neuron. ! ! ! ! num_in_Excitatory += 1 ! ! ! !
! ! #Create labels about the neurons out connections
! ! Label(dataFrame, foreground="black", text="Out", font=("Helvetica",
"10")).grid(row=0, column=0) ! !
! ! Label(dataFrame, foreground="#090", text=str(num_out_Excitatory)).grid (row=0, column=1)
! ! Label(dataFrame, foreground="red", text=str(num_out_Excitatory_dc)).grid (row=0, column=2)
! ! Label(dataFrame, foreground="black", text=str(num_out_Inhibitory)).grid (row=0, column=3)
! !
! ! #Create labels about the neurons in connections
! ! Label(dataFrame, foreground="black", text="In", font=("Helvetica",
"10")).grid(row=1, column=0) ! !
! ! Label(dataFrame, foreground="#090", text=str(num_in_Excitatory)).grid (row=1, column=1)
! ! Label(dataFrame, foreground="red", text=str(num_in_Excitatory_dc)).grid (row=1, column=2)
! ! Label(dataFrame, foreground="black", text=str(num_in_Inhibitory)).grid (row=1, column=3)
! ! ! !
! ! if columnFrame == 14:! #If there is 14 frames change row and and column
! ! ! columnFrame = 0 ! ! ! rowFrame +=1
! ! else:! ! ! ! ! #Else change only column.
! ! ! columnFrame+=1
def networkmap(self):
!"""Draw a image of the network in a new window. !
! This method will create a new window that contains a image on the neuron network. ! The image will show the neurons as circles and and they are placed in a circle. ! This has nothing to do with how the neurons is placed in NEST. It is easier to show ! the connection between the neurons if they are placed in a circle.
! """
! !
! self.top = Toplevel()!! ! #Create window
! self.top.title("Networkimage")! #Set the Title
!
! model = self.model! #Makes less code
!
! side = 600! ! #How big the picture will be.
! w = Canvas (self.top, height=str(side), width=str(side))! #Create canvas widget, this is the "picture".
! w.grid(row=0, column=0)! ! #Place it in the window.
!
!#Import python modules.
!import math
!from Numeric import arange !
! center = side/2! ! #Calculate where the center is.
! radian = center-30! #Calculate the radian of the big circle.
!connections = model.getConnections()! #Dictionary of all the neurons and their output connections.
! !
! l = len(connections)!#Get the length of the connections dictionary.
!
!#This will loop trough all the neurons and print their connections and labels.
!for origin in connections: ! !
! ! xText = math.cos(self.pointInCircle(origin, l))*(radian+20)+center!#x position of the text
! ! yText = math.sin(self.pointInCircle(origin, l))*(radian+20)+center!#y position of the text
! !
! ! #Prints the number of neurons connected to the neuron.
! ! w.create_text(xText, yText, text=str(model.connected_neuron[origin])) ! !
! ! #Get the color that reprisent this neuron
! ! color,out_color = self.neuronColor(origin) ! !
! ! xStart = math.cos(self.pointInCircle(origin, l))* (radian-10)+center! #x start position of the neuron connections
! ! yStart = math.sin(self.pointInCircle(origin, l))* (radian-10)+center! #y start position of the neuron connections
! !
! ! #This loop will print the connections from the 'origin' neuron to the neurons that are connected with it.
! ! for end in connections[origin]:
! ! ! #It will print connection if the 'end' neuron number is smaler then the array-length
! ! ! #and if 'end' and 'origin' is not the same
! ! ! if end <= l and origin != end:
! ! ! ! xEnd = math.cos(self.pointInCircle(end, l))* (radian-10)+center! #x stop position of the neuron connection
! ! ! ! yEnd = math.sin(self.pointInCircle(end, l))* (radian-10)+center! #y stop position of the neuron connection
! ! ! !
! ! ! ! #Prints line from neuron to connected neurons.
! ! ! ! w.create_line(xStart, yStart, xEnd, yEnd, fill=out_color) !
!#Change the font of the text
!import tkFont
! nr_font = tkFont.Font (size=12) !
! cc = 10 #Radius of the neuron circle.
!
!#This loop will print the neuron circle and place text with the neuron number in it.
!for i in range(1,l+1):
! ! cx = math.cos(self.pointInCircle(i, l))*radian+center!#x center of the neuron circle.
! ! cy = math.sin(self.pointInCircle(i, l))*radian+center!#y center of the neuron circle.
! !
! ! #Colors of the neuron
! ! color,out_color = self.neuronColor(i) ! !
! ! #Prints the circle.
! ! w.create_oval(cx-cc, cy-cc, cx+cc, cy+cc, fill=color, outline="#000") ! ! #Prints the number of neuron in the circle
! ! w.create_text(cx, cy, text=str(i), font=nr_font) ! ! def pointInCircle(self, i, l):
!"""Calculates where i is on a circle with l paramiter. !
! """
!from math import pi !return -(pi*2)*(i/l) def winAnimation(self):
!"""Creates window that shows the activity in the network. !
! This method creates a new window with a slider and a canvas. The canvas will show ! a animation on the spikes from the neurons during the simulation.
! The slider is there so that the user can change the animation speed.
! The animation will show the neurons as circles and and they are placed in a circle. ! This has nothing to do with how the neurons is placed in NEST. It is easier to show ! the connection between the neurons if they are placed in a circle.
! The neurons will get white and the connections from them will show when the neuron spikes.
! The connections will then fade away and the neuron will get the color back. This smooth
! transition is there so that the user can get the chance to se all the spikes. ! """
! !
! self.aniWin = Toplevel()! ! ! ! #Create window
! self.aniWin.title("Network animation") ! #Set the title
!
!#When the window is closing then the close_shownetwork will run method.
! self.aniWin.protocol("WM_DELETE_WINDOW", self.close_animation) !
!#Is used if the user want to close the window while the animation is running.
self.runAnimation = True
self.closeAnimationWindow = False !
!
!#Create the slider that will change the animation speed.
!#The slider will go from 0.01 to 0.1 and have a resolution of 0.01 .
! speed = Scale(self.aniWin, from_ = 0.01, to=0.1, resolution=0.01, label="Animation speed", length=200, orient=HORIZONTAL )
! speed.grid(row=0, column=0) #Place the slider in the window.
! speed.set(0.05) #Set the initial speed.
!
! side = 600! ! ! #How big the picture will be.
! center = side/2! ! #Calculate where the center is.
! radian = center-40! #How big the circle will be where the neurons is placed.
!
!#Create the canvas widget where the animation will be shown.
! w = Canvas (self.aniWin, height=str(side), width=str(side), background="#FFF") ! w.grid(row=1, column=0)! #Place it in the window.
!
! model = self.model! ! ! #Less code.
! l = model.getNrNeurons()! #How many neurons that will be shown.
!
!#Get the math methods.
!import math !
! !
! cc=int((radian*math.pi)/l)-2!#Calculate how big the neuron circle will be
!if cc > 15:! ! ! ! ! ! #It will nog be bigger then 15
! ! cc = 15 !
!#This array will hold the id of the neuron circle id.
! neurons = [] !
!#This loop will create a circle for all the neurons and place it in the 'neurons' array.
!for i in range(1,l+1):
! ! cx = math.cos(self.pointInCircle(i, l))*radian+center!#x center position of the neuron.
! ! cy = math.sin(self.pointInCircle(i, l))*radian+center!#y center position of the neuron.
![Figur 2. [7] Visualiserar en neurons uppbyggnad med bland annat dendrit, cellkärna ”somna”, axon.](https://thumb-eu.123doks.com/thumbv2/5dokorg/4736097.125463/7.892.169.735.348.660/figur-visualiserar-neurons-uppbyggnad-bland-annat-dendrit-cellkärna.webp)
![Figur 3. [9] A visar neuron j=1 skicka en spik till neuron i och grafen visar resultatet av mätning av membranets potential i i](https://thumb-eu.123doks.com/thumbv2/5dokorg/4736097.125463/8.892.213.689.416.1011/figur-neuron-skicka-neuron-resultatet-mätning-membranets-potential.webp)