Alloy Phase Analysis from Measurements of Bulk Electronic and Magnetic Properties
by
All rights reserved
INFORMATION TO ALL USERS
The qu ality of this repro d u ctio n is d e p e n d e n t upon the q u ality of the copy subm itted.
In the unlikely e v e n t that the a u th o r did not send a c o m p le te m anuscript and there are missing pages, these will be note d . Also, if m aterial had to be rem oved,
a n o te will in d ica te the deletion.
uest
ProQuest 10783712Published by ProQuest LLC(2018). C op yrig ht of the Dissertation is held by the Author.
All rights reserved.
This work is protected against unauthorized copying under Title 17, United States C o d e M icroform Edition © ProQuest LLC.
ProQuest LLC.
789 East Eisenhower Parkway P.O. Box 1346
A thesis submitted to the Faculty and the Board o f Trustees o f the Colorado School o f M ines in partial fulfillment o f the requirem ents for the degree o f M aster o f Science (Metallurgical and M aterials Engineering).
Golden, Colorado D ate A'ni/EM&ER 5 ,
Signed:
Kirk Arthur Lirfdahl
Approved: D r David L. Olson Thesis Advisor Golden, Colorado D ate / / c v r . m p ^ ^ / f f - ^ Dr. John M oore
Departm ent Head, Metallurgical and M aterials Engineering
a p ^
A B ST R A C T
This research investigates w hether measurements o f bulk electronic and magnetic properties can be used to reveal the micro structure and phase stability o f alloys. The ability to characterize alloy properties and phase stability through correlation with electronic measurements may allow significant improvements in the non-destructive evaluation o f advanced alloy properties and the prediction o f service life. There is a sound fundamental basis to expect that the electronic state o f an alloy can be correlated to metallurgical properties. The metallurgical stability o f intermetallic phases as well as some o f the mechanical properties in certain alloys have been successfully predicted by correlating to electron concentration. In addition, bulk electronic and magnetic properties are also a result o f the electron state. Therefore, measurements o f these properties should correlate to the micro structure and phases present in metal alloys. Because the aluminum-copper alloy phase and micro structure has been thoroughly studied and documented, it was
selected as a model system and an alloy o f aluminum with 4 wt. pet. copper was used. The magnetic susceptibility was selected as the measured property, based on its known
relationship to the electron concentration and the electronic nature o f a metal. The magnetic susceptibility measurement exhibited three regions that correspond to the
aluminum-copper alloy micro structure. The regions identified include: 1) metastable GP1 phase refinement, 2) formation o f metastable GP2 and 9' phases, and 3) 0' phase refinement and 0 phase formation. Based on these findings, it appears possible to non-destructively determine the m icrostructure and phase stability o f an alloy by making electronic and magnetic measurements.
T A B L E O F C O N T E N T
Page
ABSTRACT ... iii
LIST OF FIGURES ... vi
LIST OF TABLES ... vi
ACKNOW LEDGM ENTS ... vii
CH A PTER 1: IN TRO D U CTIO N ... 1
1.1 Objective o f Research ...v... 1
1.2 Scope o f Research ... 4
1.3 Thesis Organization ... 5
CH A PTER 2 LITERA TURE REV IEW ... 6
2 .1 Physics o f M etals ... 6
2.1.1 Fermi Surfaces ... 8
2.1.2 Brillouin Zones ... 9
2.1.3 Density o f State ... 10
2.1.4 Alloy Phase Stability ... 11
2.2 Electronic M easurem ents ... 15
2.2.1 M agnetic Susceptibility ... 18
2.2.1.1 Orbital Diamagnetism ... 21
2.2.1.2 Conducting Electron Diamagnetism ... 23
2.2.1.3 Pauli Param agnetism ... 24
2.2.2 Hall Effect ... 27
2.2.3 M agnetic Phase Analysis ... 30
2.3 Aluminum-Copper Alloy System ... 31
2.3 .1 Solution H eat Treatm ent ... 32
2.3.2 Quenching ... 32
2.3.3 Aging ... 35
CH A PTER 3: EX PERIM EN TA L PRO CED U RES ... 41
3 .1 Sample Preparation ... 41
3.2 Sample M atrix ... 42
3.3 M agnetic Susceptibility M easurem ent ... 42
3.4 Analytical Techniques ... 46
TABLE OF CO NTENT (CO NTINUED)
CH APTER 4: D ISCU SSIO N OF RESULTS ... 48
4.1 Region 1 ... 61
4.2 Region 2 ... 64
4.3 Region 3 ... 70
4.4 Statements o f Completion ... 73
CH APTER 5: CO N CLU SIO N ... 77
REFERENCES CITED ... 78
APPEN DICES ... 81
Appendix A: Alloying Param eters ... 81
Appendix B: Raw D ata ... 84
Appendix C: ASTM Standard E l8 -8 9 (a) ... 92
LIST OF FIGURES
Figure Description Page
2.1 Baker-N utting Diagram ... 13
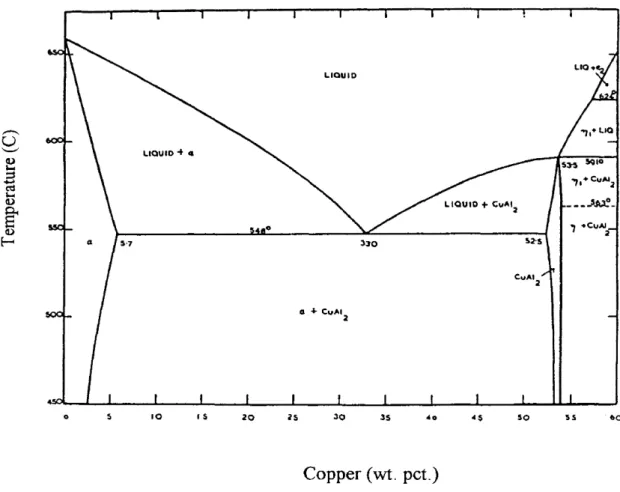
2.2 Al-Cu Phase Diagram ... 33
2.3 Coherent and Incoherent Precipitate Schematic ... 40
3.1 Quantum Design M agnetic Property M easurement System ... 45
4.1 M agnetic Susceptibility at 300 K as a function o f Aging Time at 473 K . . . . 50
4 .2 M agnetic Susceptibility at 300 K as a function o f Aging Time at 473 K for Samples with Copper between 4.0 and 4.4 wt. p et... 52
4.3 M agnetic Susceptibility at 300 K as a function o f Aging Time at 473 K for Samples with Copper betw een 4.4 and 4.8 wt. p et... 53
4.4 M agnetic Susceptibility at 300 K as a function o f Aging Time at 473 K for Samples with Copper betw een 4.8 and 5.2 wt. p et... 54
4.5 M agnetic Susceptibility at 300 K as a function o f Aging Time at 473 K for Samples with Copper between 3.8 and 4.2 wt. pet... 55
4.6 Linear Regression Analysis o f M agnetic Susceptibility D ata . ... 57
4.7 Linear Regression Best Fit Line Through M agnetic Susceptibility D ata . .. 59
4.8 Hardness as a function o f Aging Time at 473 K ... 60
4.9 TEM M icrographs o f Sample 1 ... 62
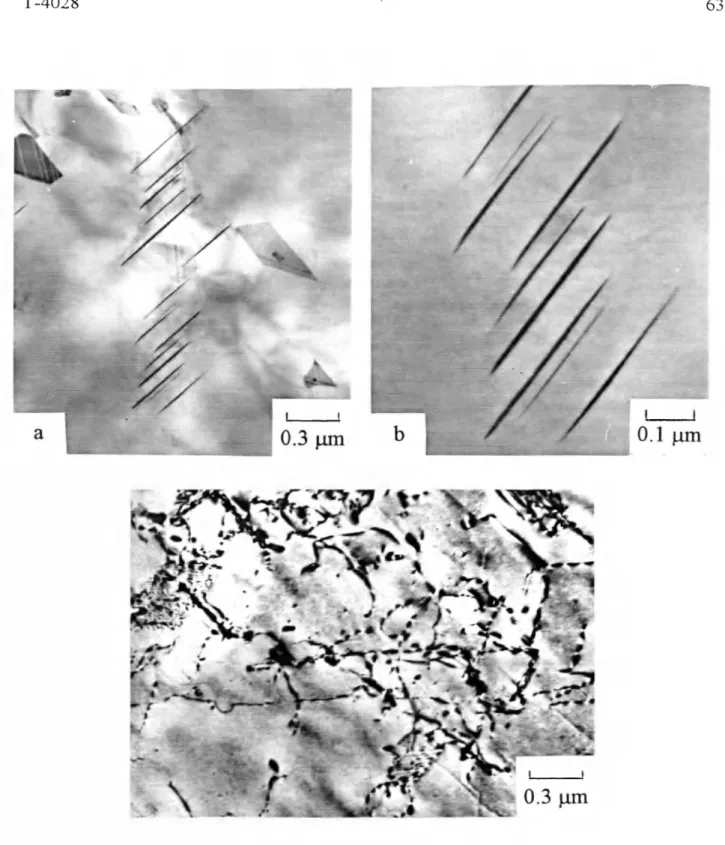
4.10 TEM M icrographs o f Sample 4 ... 63
4.11 TEM M icrographs o f Sample 8 ... 66
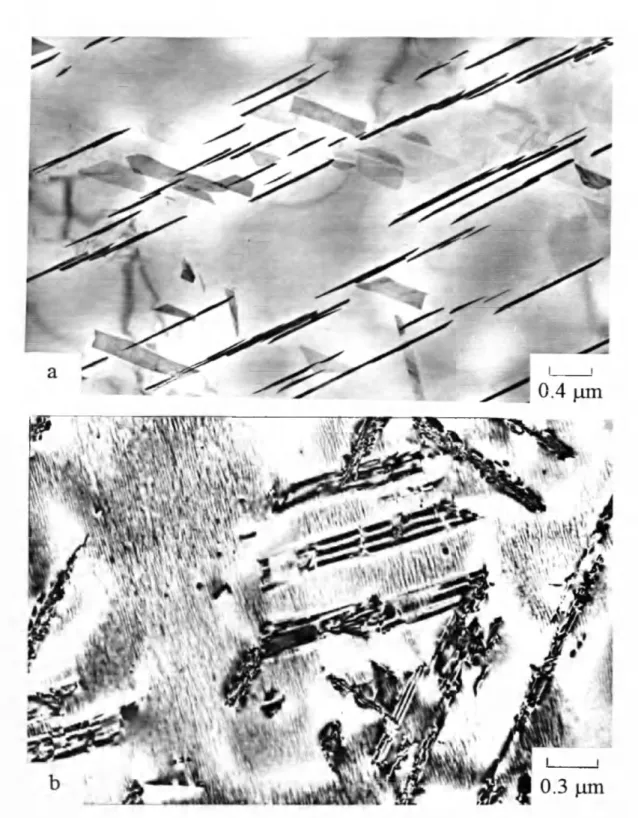
4.12 TEM M icrographs o f Sample 12 ... 67
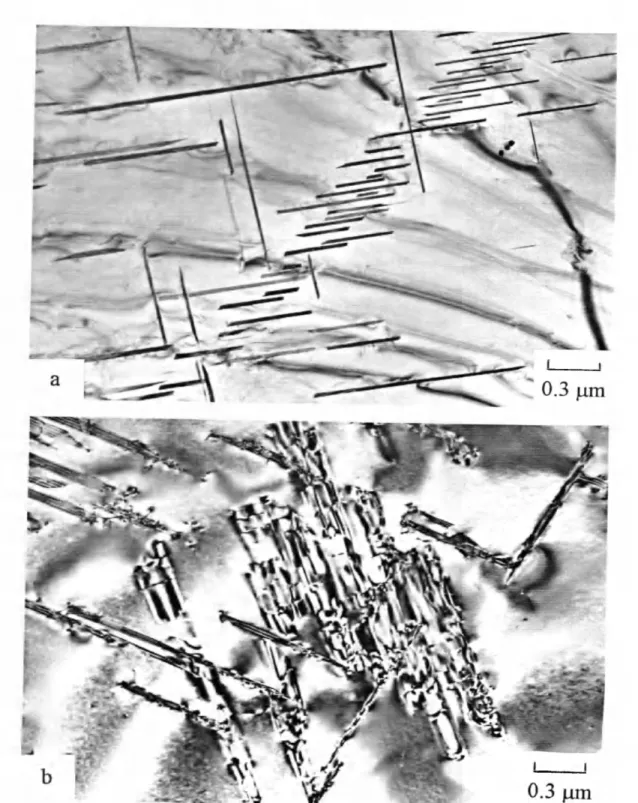
4.13 TEM M icrographs o f Sample 16 ... 68
4.14 TEM M icrographs o f Sample 22 ... 69
4.15 TEM M icrographs o f Sample 27 ... 71
4.16 TEM M icrographs o f Sample 32 ... 72
4.17 Hardness as a function o f M agnetic Susceptibility ... 74
A -l First Alloy Melt Vacuum Furnace Param eters ... 82
A-2 Second Alloy M elt Vacuum Furnace Param eters ... 83
LIST OF TABLES Table Description Page 2 .1 Susceptibilities and Permeabilities o f Various Elements ... 20
2 .2 Room Tem perature Values o f the Hall Coefficient ... 29
3.1 Sample M atrix ... 43
4 .1 Summary o f M easured Properties ... 49
A C K N O W LED G M EN TS
I want to express my sincere gratitude to my thesis advisor, Dr. David Olson, for his guidance on the project. I also want to thank the committee members, Dr. Brajendra Mishra, Dr. John M oore, Dr. John Trefny. Mr. Robert M cG rew provided the guidance and instruction needed to produce the quality Transmission Electron Microscopy. I am grateful for the assistance o f Mr. Steve Donelson in machining the samples needed for measurement. Mr. Alcides Raraz assisted with vacuum furnace operations for alloying the
V aluminum and copper.
It is a pleasure to acknowledge the assistance o f Mr. Robert Cross at the National Institute o f Standard and Technologies, who provided the equipment and materials needed to complete the magnetic susceptibility measurements. Mr. Cross provided training on equipment operations and insight on technique for obtaining accurate results.
The EG & G Rocky Flats M aterials and Surface Technology department, managed by Ms. Wendy Sticka, provided financial support for this project in the form o f tuition reimbursement. The cooperation and assistance o f my coworkers, in particular the adjustment o f w ork schedule to attend classes, has enabled me to earn this degree.
G ratitude is extended to my parents, B ruce and Dorothy, for instilling curiosity and the desire to learn from an early age. Finally, I would like to thank my wife, Diane, for her encouragement, and more importantly, her understanding o f time spent pursuing this degree.
C H A PTER 1 INTRO DUCTIO N
1.1 Objectives O f Research
The objective o f this research is to determine w hether bulk electronic and magnetic properties can be used to evaluate the micro structure and phase stability o f an alloy. The ability to characterize alloy properties and phase stability through correlation with
electronic measurements may allow significant improvements in the non-destructive evaluation o f advanced alloy properties and the prediction o f service life. For example, the aluminum industry would benefit from improved methods o f phase determination to assure desired m icrostructure and resulting strength exists within the alloy [1].
The metallurgical stability o f intermetallic phases as well as some o f the mechanical properties in certain alloys have been successfully predicted by correlating to electron concentration. H um e-Rothery [2] has identified that intermetallic phases occur at specific electron to atom ratios and has called these phases electron compounds. Brew er [3-5] has established a relationship between electron concentration and the compositional range for a specific crystal structure or phase. Cho [6] connected many mechanical properties, including bulk modules, shear modulus, and Young's modules to the electron
There is a sound fundamental basis to expect that the electronic state o f an alloy can be correlated to metallurgical properties [7-10], For example, in a simple free electron gas theory, the isothermal bulk modules, B, can be expressed as:
B = fE Fne (1)
where E F is the Fermi energy and ne is the carrier density, which for conductivity by electrons is equivalent to electron concentration. The Fermi Energy at 0 K, 0 K), is also related to the electronic concentration by the following relationship.
V
£ f (0 K ) = ( h 2/2m)(3 n 2n e )2/3 (2)
where 2 n h = /?, h is the Planck’s constant, and m is the effective mass o f the electron. These relationships imply that a change in the Fermi energy or electron concentration could effectively influence the mechanical properties o f metals.
The concept o f using calculated electron concentrations to predict, from known alloy composition, the susceptibility o f an alloy to form topological close packed
intermetallic phases has been developed and is named Phacomp. Phacomp involves a calculation o f an electron number which is com pared with a criteria value. W hether the electron number is greater or smaller than this criteria value allows prediction o f phase stability. The Phacomp calculation method and the m ore recent improved N ew Phacomp m ethod have been successfully used to evaluate the susceptibility o f forming sigma phases
in superalloys. These analytical techniques do suggest that the electronic state is important to the phase state o f the alloy.
If the mechanical properties are fundamentally a function o f electron
concentration, and there has been success correlating calculated electronic states to
mechanical properties and alloy phases, could the electron concentration be measured with advanced bulk electronic or magnetic m ethods? Can these measurements provide insight into the condition o f the alloy, and its structural properties? In an attem pt to
V
non-destructively determine the properties o f materials, electronic and magnetic
m easurements have been conducted on several alloy systems. The correlation between magnetic susceptibility and the precipitation o f solute in heat-treatable aluminum alloys has been investigated [11]. M agnetic phase analysis has been used for alloys with no more than tw o phases, which have known and widely differing susceptibilities. One application is the measurement o f the am ounts o f the body-centered cubic and face-centered cubic phases in iron-rich binary alloys at high tem peratures [12]. Hall coefficient and electrical resistance m easurements have been perform ed on alloys (Bismuth alloys, Fe-Co, Pd-Fe, Pb-Ni, Pd-Co) to investigate the dependence on structural modifications, composition, and tem perature. [13-21], M agnetic Barkhausen Noise signals have been used to characterize the m icrostructures in aged 17-4-PH stainless steel, and tem pered 2.2 5 C r-lM o bainitic steel [22, 23].
1.2 Scope O f Research
To evaluate the use o f electronic and/or magnetic measurements requires the selection o f an alloy system which has been thoroughly studied as to its phase stability. The binary aluminum-copper system, with its well investigated phase transitions during annealing, which include GP1, GP 2, 0', and 0 phases, makes a model system for this investigation. The phase transitions go from pre-precipitation conditions with coherent interfaces to non-coherent precipitates. Samples o f Aluminum - 4 wt. pet. Copper with
V
varying micro structure w ere prepared through a series o f designed thermal treatments, and fully characterized. Tw o practiced electronic and magnetic measurements, magnetic susceptibility and Hall coefficient, w ere examined to determine the physical nature o f these measurements, their dependence on electron concentration, and a relationship to phase stability. Because o f its known relationship to the electron concentration and the electronic nature o f a metal, the magnetic susceptibility was selected as the measured property. M agnetic susceptibility measurements w ere made on the prepared samples, and results w ere com pared with micro structural information. The magnetic susceptibility was found to correlate with various phase conditions. Based on the correlation, the magnetic susceptibility can assist with nondestructively measuring alloy phase stability or the service life o f a precipitation strengthened alloy.
1.3 Thesis Organization
Chapter 2 presents the literature review conducted for this thesis. The relevant electronic physics describing the behavior o f metals is developed so that the relationship between electron concentration and material properties is understood. To discern both magnetic susceptibility and Hall coefficient and the information each represents, a summary on the magnetism and Hall effect is presented. The details o f the Al-Cu alloy system are also discussed.
V
Chapter 3 presents the experimental procedures used in preparing samples, measuring the magnetic susceptibility, and characterizing sample microstructure.
Chapter 4 examines the correlation betw een magnetic susceptibility and alloy properties. Conclusions drawn from the investigation are presented in Chapter 5. The cited
C H A PTER 2 LITERATUR E REVIEW
2.1 Physics O f M etals
In the simplest view, atom s in metallic crystals are ionized and a metal is an assemblage o f positive ions in a periodic lattice, immersed in a cloud o f electrons. M etallic crystals are held together by the electrostatic attraction between the negative electrons and the positively charged ions. The electronic potential in the interior o f the metal varies periodically as a result o f the presence o f the positive ions arranged on a space lattice. The motion o f a conduction electron in this periodic potential is described by a system o f waves. The use o f w ave mechanics to characterize the velocities that a wavelike electron can have as it moves around in a metal with a periodic potential has been classified as the band theory o f solids. However, many o f the important relationships can be derived by ignoring the periodic potential, and considering what is called the fr e e
electron theory.
The wavelength that describes the motion o f the electron depends on the velocity o f the electron according to the relation:
X - 2 n h /m v (3)
w here 2% h = h, h is the Planck's constant, m is the effective mass o f the electron, and v is its velocity.
A much used quantity in electron theories is the wave num ber k , which is the inverse wavelength multiplied by 2%. Thus,
k = 2n/'k = mv/tl (4)
which shows that the w ave number o f a free electron is proportional to its momentum mv. Since the kinetic energy o f a free electron, E k, w ith wave number k is
it can be expressed as
E k = (h 22m)1c (6)
in which form it is clear that the kinetic energy is proportional to Jc. In the free electron theory o f solids, the relation between kinetic energy and wave number is parabolic, and the curve is symmetrical about k = 0 because electrons moving in opposite directions with the same velocity would have the same energy.
It is convenient to indicate both the magnitude and the direction o f the momentum o f an electron in a crystal by plotting a vector in k space. As suggested by equation 3, the
k space is actually a reciprocal lattice space with symmetries determined by the symmetry
2.1.1 Fermi Surfaces
At 0 K, all electrons reside in the lowest possible energy states. By the Pauli exclusion principle, only tw o electrons can occupy any state, one with spin "up" and one with spin "down." As a consequence o f this principle, at absolute zero the electrons fill all the states up to a certain maximum energy level and none have energies above this state. The level which divides the filled and vacant levels is known as the Ferm i level at absolute zero and is denoted by E f 0). At higher tem peratures some electrons are excited to higher energy levels. The energy level at which the probability o f occupation by an electron is Vz is defined as the Ferm i level E F [24].
In the free electron theory, the Fermi level, expressed as an energy [25], is given by:
E F = ( h 2/2m)(3 7Z2n f 3 (7)
It is clear from this equation that the maximum energy o f the electrons is a function o f ne, the number o f electrons per unit volume or electron concentration, and not o f the size or shape o f the whole crystal. While this observation is made by considering the free electron case, it suggests a relation that should hold similar for electrons in a periodic potential
In k space, the k vectors o f electrons that have energies at the Fermi level
terminate upon a surface, the F erm i surface. At absolute zero this surface separates the occupied from the "empty" quantum states. At higher tem peratures, even though there is
a slight spread o f vacant and occupied states near the Fermi surface still essentially provides all the electron states that can play any significant part in the properties o f metals.
2.1.2 Brillouin Zones
The interaction o f electrons with the periodic lattice o f the solid will cause Bragg reflection to occur for electron waves in crystals. The Bragg reflection leads to an energy gap in the distribution o f the conducting electron states.
Any electron will be. reflected from a set o f atomic planes in a crystal if Bragg's
V
law, nX = 2 d sin 0, is satisfied. For an electron moving exactly along the x axis o f a crystal, reflection from (100) planes, o f spacing a , will occur when nX = 2a, since 0 = 90°. Since the wavelength o f the electron is A, = 2n/k, the reflecting condition can be written
2 m = 2ak cos(90 - 0), which in vector notation can be rewritten as k*x = kx = m /a .
In general for the three dimensional k space, any planes will reflect when kd, the com ponent normal to them, is given by:
kd = rur/d. (8)
w here d is the spacing o f the planes, and n is an integer that describes order o f reflection. The energy gaps occur when the k vector ends on one o f the planes normal to k and at distances n7ddhkl from the origin. The allowed ranges o f the wave vector k are called
The wave equation describing the motion o f electrons is known as the Schrodinger equation. Many periodic functions can be used to model the potential field that the lattice ions exert on the conducting electrons. For w hatever potential function used to describe the ionic atoms arrangement, the solutions o f the Schrodinger equation have the following characteristic. For certain ranges o f energy, there exist traveling-wave-type solutions o f the Schrodinger equation. These energy ranges, called bands, are separated by an energy gap in which no traveling w ave can exist. That is, there may arise a substantial region o f
V
energy m which solutions o f the wave equation do not exist.
2 .1.3 Density o f States
The interaction o f the Fermi surface with the Brillouin zone boundaries is an
im portant phenomenon in understanding the properties solids exhibit. A critical param eter in the interaction is the number o f states available to an electron near a given energy, which is termed the density o f states.
I f the Fermi surface lies well within the Brillouin zone, the relationship between the energy E and the density o f states N (E) in the band is parabolic and is given by:
N (E) = m 3/2(E - E o) m / ( 2 ll2K2h 3) (9)
w here E is the energy at the state o f interest, and E 0 is the energy o f the lowest states in the band.
Contact between the Fermi surface and the Brillouin zone will correspond to a peak in the density o f states as the Fermi surface first overlaps the boundary. The peak in the density o f states results because any deviation from sphericity for a given volume increases the surface area. Following contact, the density o f states rapidly decreases because the total area o f the Fermi surface decreases as the corners o f the zone are filled. F or the energy states near the top o f a band, the energy is measured down from the top o f the band (EmsK) to give an expression for the Density o f States as:
V
N (E ) = m >,2(E max - E )'12 / (2 " W ) (10)
Since k space is a reciprocal lattice spacing, the shape o f the Brillouin zone is determined by the crystal planes most widely spaced. Crystal structures with the widest spaced planes will have the smallest Brillouin zones. W hen the density o f states decreases following contact between the Fermi surface and the Brillouin zone, it may become favorable for a crystal to transform to closer planes, smaller lattice spacing, which would enlarge the zones, and make m ore states available to electrons.
2.1.4 Alloy Phase Stability
To obtain the best properties and performance, the major alloy systems depend upon control o f the solid-state phase equilibria. In certain cases, segregation can alter the phase equilibria and degrade the alloy, even w ithout the appearance o f a second phase. In other circumstances, the material may degrade because o f an undesirable second phase.
Paradoxically, in other alloy systems, adequate performance is dependent on the type, concentration, morphology, and size distribution o f second phase particles. The use o f second phase in the form o f precipitates is fundamental to the successful use o f
superalloys, aluminum alloys, chrolloys and stainless steels. The material composition, thermo-mechanical processing sequences and the service life o f the alloy part will
influence the nature o f precipitation. The second phase formation and grow th are a strong function o f both time and tem perature. Num erous different precipitates are involved in many o f these alloys. Each precipitate appears vat a given time and temperature, in a very characteristic state o f development, as seen by the carbide precipitation in 2.25C r-lM o steel (Figure 2.1). Each characteristic state o f precipitation produces a specific condition o f alloy performance, with definite limits to the alloy's chemical, physical, and mechanical behavior. For most o f the commercial alloys, special practices for mechanical working and heat treatm ent help produce the correct state o f precipitation consistent with optimal mechanical and corrosion perform ance [26].
Empirical studies have shown that in many alloy systems the electron concentration is the important param eter that influences such factors as the extent o f primary solid
solubility, the presence or absence o f a particular crystallographic structure, the range and stability o f intermediate phases, the form ation o f long-period superlattices, trends in lattice spacings, the number o f vacant sites in defect structures, the magnetic susceptibility, and many others [2]. The stability o f electron phases, like the stability o f the primary solid solutions, appears to be the consequence o f interactions between the Fermi surface and the
o UJ § < IT UJ CL 2 UJ l-o z £E UJ CL 2 UJ 4 0 0 5 10 50 100 V TEMPERING TIME (h ) 1000 QUENCHED o UJ cr 13 h-< cr K s UJ \-r o <r UJ CL 2 LU 5 0 0 4 0 0 J I____ 0.5 I 5 10 50 100 TEMPERING TIME (h) 1000
Figure 2.1: Baker-N utting Diagram which shows tim e-tem perature dependence o f carbide stability for 2.25 Cr- 1 Mo steel a) quenched and tem pered b) normalized and tem pered [27].
Brillouin zones o f these structures, with emphasis on the influence o f such interactions upon the density o f states N(2iF) at the Fermi surface. As the number o f conduction
electrons is varied by the alloying constituents o f a different valence from that o f the solute matrix, the relative positions o f the Fermi surface and zone boundaries are altered. It is not certain whether or not, on alloying, all the valence electrons o f a solute atom enter into the conduction band o f the alloy, since some o f them may fill in d-levels and produce more localized and directional electronic interactions in the metal.
It is apparent that there is an intimate connection between the electron
concentration at which a new phase appears and the electron concentration at which the Fermi surface makes contact with the Brillouin zone boundary and a peak in the density o f states. The general explanation o f the association is that it is expensive energetically to add further electrons once the filled states contact the zone boundary. Additional electrons can be accom m odated only in states above the energy gap characterizing the boundary or in the states near the corners o f the first zone. The number o f states near the corners falls o ff markedly as a function o f energy. In this circumstance it is often
energetically favorable for the crystal structure to change, the final structure being one which contains a larger Fermi surface. In this way the sequence a (1.36 e/a), p (1.48 e/a), y (1.54 e/a), s (1.69 e/a) is made plausible, w here the numbers in parentheses refer to the electron concentration per atom at which contact between the Fermi level and the
2.2 Electronic M easurem ents
In an attem pt to nondestructively determine the properties o f materials, electronic and magnetic measurements have been conducted on several alloy systems. The
correlation between magnetic susceptibility and the precipitation o f solute in heat-treatable aluminum alloys has been investigated [11]. The Aluminum-Copper, Aluminum-Zinc, and Aluminum-Magnesium alloy systems w ere studied. For both the Aluminum-Copper and Aluminum-Magnesium alloy systems, varying solute compositions were measured in tw o
v
extreme tempers, completely annealed and as-quenched. M easurem ents on the
Aluminum-Zinc alloy w ere carried out at tem peratures high enough to assure complete solid solution. This investigation com pared the measured magnetic susceptibilities to calculated magnetic susceptibilities based on a mixture o f components not alloyed, but simply mixed together in their pure states without producing a new phase. The data indicate that the difference betw een the magnetic susceptibility o f a mixture o f pure com ponents and an alloy o f the same bulk composition is equivalent to the Pauli paramagnetism o f the aluminum metal associated with the alloy phases. The study calculated the number o f aluminum atom s affected by solute such that their Pauli paramagnetism was not measured. The calculations supported the existence o f short-range order in dilute solid solutions. In the quenched solid solutions, the solute atoms tend to avoid being nearest neighbors to an extent greater than that which would result from a purely random arrangement, supporting the Hum e-Rothery prediction o f
short-range order. Calculation for the fully aged samples showed excellent agreement with predicted equilibrium phases. For example, in the alumimum-copper alloy, roughly tw o aluminum atoms w ere associated with each copper atom which corresponds to the predicted CuA12 phase.
M agnetic phase analysis has been used for the Iron-Carbon and Iron-Silicon systems [12, 28] These alloy systems have ferromagnetic phases with established magnetic characteristics. A series o f samples covering the composition range was
v
annealed The spontaneous magnetizations w ere measured for the annealed samples at a several temperatures. The overall sample magnetization is known to be the sum o f the m agnetization for individual phases times the respective fractions o f these phases in the alloy. It is therefore possible to solve for the fraction each phase occupies in the total sample. For the Iron-Carbon system, these investigations were able to determine what com position o f the alloy was precipitated as cementite (Fe3C) and what fraction contained carbon in solid solution as ferrite. Analysis o f the Iron-Silicon system w as able to map the phases present across the phase diagram at various temperatures. The study was able to chart the change in weight fraction o f a , a " , and q phases during annealing.
Hall coefficient measurements have been performed on Palladium-Iron alloys [17], The dependence on tem perature and concentration were investigated for alloys ranging from 0.5 to 99.5 at. pet. iron in the range o f 2-300 K. The alloys provided a continuous series o f disordered solid solutions. Alloys with less than 77 at. pet. iron have an
cubic structure. The changes in the crystal structure w ere found to alter the tem perature dependence and the sign o f the Hall coefficient.
The Hall effect and electrical resistance throughout the entire Iron-Cobalt alloy system has been investigated in a tem perature range from liquid nitrogen to 800 K [14]. The composition dependence o f Hall effect and resistivity was found to be analogous at all tem peratures. B oth values reached peaks at compositions with 10 and 80 at. pet. cobalt. The lowest values w ere found for alloys containing approximately the same amount o f
v
both components. These minimum values w ere apparently due to the formation o f superstructure known to form in that compositional range.
M agnetic Barkhausen N oise (M BN) signals have been used to characterize the micro structures in aged 17-4-PH stainless steel, and tem pered 2.2 5 C r-lM o bainitic steel [22, 23], This method o f analysis tracks a signal generated by sweeping a ferromagnetic material through a magnetic hysteresis loop. A plot is obtained in which the X-axis denotes the scan betw een maximum magnetization field strength (80,000 A/m) and
minimum magnetization field strength (full reversal o f the maximum field), and the Y-axis denotes the variation in M BN rms voltage. The M BN signals are generated at the steep portion o f the hysteresis loop. The peak height o f the plot is taken as a param eter to assess the micro structure. In the aged 17-4-PH stainless steel material, the M BN plot was able to track the coherency strains associated with the copper precipitates that provide peak hardness, as well as the precipitation o f austenite along the lath boundaries. In the tem pered 2.2 5 C r-lM o bainitic steel, the linearity in the plot showed that M BN peak
height can be used as a nondestructive param eter for assessing the tempering process. The decrease in hardness with increase in tempering tem perature was due to the removal o f the internal quenching strains and the precipitation o f carbides which corresponded to an increase in M BN peak heights.
This Literature Review presents tw o practiced electronic measurements, magnetic susceptibility and Hall coefficient. The physical nature o f these measurements is examined and a relationship to phase stability is developed.
2.2.1 M agnetic Susceptibility
If a substance is placed in a magnetic field it becomes a source o f a measurable magnetic field. The magnetic field within the substance will be either greater or smaller than the applied magnetic field. The different types o f magnetic materials are usually classified on the basis o f their permeability or susceptibility. The permeability is defined as
\i = B /H (i d
and the susceptibility is defined as
% = M / H (12)
w here H is the magnetic field, B is the magnetic induction, and M is the magnetization [29].
The magnetic induction, B , is the vector sum given by
B = \x0(H + M ) (13)
where p 0 is the permeability o f free space = 4tu x 10~7 in SI units.
Sometimes the relative permeability o f a medium, pr, is used. It is given by
The relative permeability is closely related to the susceptibility and the following equation is always true.
M agnetization o f the material, AT, is generally more interesting to the material scientist because it relates how a material responds to a magnetic field. Understanding the mechanisms behind the response provides information on the physical mechanics o f the material. The various different types o f magnetic materials are classified according to their bulk magnetic susceptibility, % [30], Table 2.1 lists the observed bulk susceptibility and relative permeability o f several metals.
The first group o f materials for which % is small and negative are called
diamagnetic, and their magnetic response opposes the applied magnetic field. Within a diamagnetic substance, a field opposite to the applied field is created, causing the internal field to be smaller.
(14)
T A B L E 2 . 1 S U S C E P T I B I L I T I E S A N D P E R M E A B I L I T I E S O F V A R I O U S E L E M E N T S (lAsc) P r Diamagnets Bi -1.21 x 10** 0.99983 Be -1.85 x 10⁻⁶ 0.99998 Ag -2.02 x 10⁻⁶ 0.99997 Au -2.74 x 10⁻⁶ 0.99996 Ge -0.56 x 10-* 0.99999 Cu -0.77 x 10-* 0.99999 Paramagnets P-Sn 0.19 x 10** 1.00000 K 0.47 x 10-* 1.00001 Na 0.68 x 10-* 1.00001 A1 1.65 x 10-* 1.00002 W 6.18 x 10-* 1.00008 Pt 21.04 x 10-* 1.00026 Mn 66.10x10-* 1.00083
I f the internal field is greater, the substance is creating a magnetic field parallel to the applied magnetic field. When the magnetic field acts individually upon atoms, with no mutual interaction between them, the effect will exist only when the external magnetic field is present, and is termed paramagnetic.
The most widely recognized magnetic materials are termed ferromagnetic. Like paramagnetic solids, the magnetic field is strengthened within the substance. In a ferromagnetic substance, the magnetic m oments o f adjacent atoms orient themselves mutually parallel with the aid o f an external magnetic field, and a magnetic order is established. As a result, ferromagnetic behavior is much stronger than paramagnetic, and permanent magnetism o f the substance can result.
The magnetic properties o f metals are the result o f the metallic electrons which belong to the crystal as a whole, and the localized electrons on each particular ion. F or a metallic specimen like an Al- 4 wt. pet. Cu alloy, the measured bulk magnetic
susceptibility will be the sum o f three separate contributions; orbital diamagnetism from the ion, diamagnetism, and Pauli paramagnetism from the conducting electrons [31].
2.2.1.1 Orbital Diamagnetism
All electrons below the Fermi level give rise to an orbital diamagnetism. The physical origin o f diamagnetism can be seen from the classical picture o f an atom as electronic charges circulating around the nucleus in definite orbits. An electric charge in a
ARTHUR LAKES LIBRARY COLORADO SCHOOL OF MINES
closed loop m otion is known to generate a magnetic moment given by
V„ = >A (16)
where i is the current and A is the area o f the loop. For an electron in orbital motion
v-m = eA /T O 7)
where e is the charge on the electron and r i s the orbital period. For a circular orbital area
A = 7 tr and r=2^r/v, where v is the instantaneous tangential velocity o f the electron and r is
the radius o f the orbit. The magnetic moment obtained as a result o f the orbital m otion o f an electron is then
evr / i q \
P™ = — (18)
In the absence o f a magnetic field the orbital moments o f paired electrons within an atom will cancel. An applied magnetic field FT will accelerate or decelerate the orbital m otion o f the electron and thereby contribute to a change in the orbital magnetic moment. The action o f a magnetic field causes changes in the velocity o f electrons in the atom in such a way that the induced moment opposes the field producing it. The susceptibility resulting from the magnetic field effect on the orbital electrons is given by
( N„ p ^ ( n„Ze2r 2)
k \ W J 6m V ’
w here N a is Avogadro's number, p is the density, WA is the relative atomic mass, Z is the number o f outer electrons with orbit o f radius and m is the effective mass o f an electron.
As shown by this equation, it is the electrons with large orbital radius that contribute the most to orbital diamagnetism.
2.2.1.2 Conducting Electron Diamagnetism
The magnetic susceptibilities o f metals are affected by the fact that the outerm ost electrons are at the Fermi level and are partially freed in the solid. Calculation o f the susceptibilities o f the metals must therefore take account o f the behavior o f these electrons in the Fermi distribution. The free electrons o f a metal make both diamagnetic and
paramagnetic contributions to the susceptibilities, but since the paramagnetic behavior is larger, the net contribution o f the free electrons is paramagnetic.
The external magnetic field effects the motion o f the valence electrons and produces a diamagnetic behavior. The field produces a force on the moving electrons, causing them to move in spiral paths betw een collisions, rather than in straight lines. The effect is diamagnetic, and in the free electron theory, the magnitude is about 1/3 the magnitude o f the Pauli paramagnetism. The quantity cannot be calculated with any
accuracy in real metals, and cannot be experimentally separated from other contribution to the magnetic susceptibility.
One o f the most powerful techniques for studying the electronic structure o f pure metals is the de Haas van Alphen effect, which measures the oscillatory energy absorption o f a metal as the magnetic field is varied [32], Since the energy o f the metal is raised by application o f a magnetic field, conservation o f energy requires the energy gain by the metal to be absorbed from the magnetic field. The diamagnetism resulting from the
conducting electrons counteracts the energy increase. As these conducting electrons are at the Fermi level, information on the Fermi surface can be obtained. The period o f oscillatory variation in the magnetic susceptibility is inversely proportional to the
maximum area o f the Fermi surface. The de Haas van Alphen effect does not depend on the magnitude o f only on the frequency and amplitude o f the oscillations with magnetic field.
2.2.1.3 Pauli Paramagnetism
The electron possesses a spin defined by the spin quantum number s which has the values ±V2. If an electron is visualized as a rotating electric charge, it is equivalent to a circular current flow so that an electron always possesses a magnetic moment. The magnitude o f this atomic magnetic moment, f i ^ is found experimentally to be
U s p . n = ^ ^ ( 2 0 )
In the absence o f a magnetic field, a metal has a complete balance o f electron spins, and the spin has no effect upon the energy.
In a magnetic field, H , the occupation o f spin states is altered. An electron parallel to the field, 5 = +Vz, has its energy lowered by p spmM.0# An electron with spin
anti-parallel, s = -Vz, increases in energy by the same amount. If the electron w ere isolated it would simply align itself parallel with the field. In a Fermi gas however almost all the electrons are in states w here the opposite spin state is already occupied. The electrons near the Fermi level occupy a closely spaced set o f energy levels, and M.spm# is generally
larger than the spacing o f the energy levels. Those electrons o f antiparallel spin within 2 p spinp.o/ / o f the Fermi level can lower their total energy by reversing their spin and
occupying an unfilled energy level with spins parallel to the field. When the Fermi energy o f the parallel spin balances that o f the anti-parallel spin, there is a net imbalance in the spins. After the field is applied and the electrons transfer, more electrons exist with spin parallel, and they create a net magnetization parallel to the field. The closer the spacing o f the energy levels at the Fermi level (higher density o f states) the more electrons will
reverse their s, and the higher the paramagnetic susceptibility.
The macroscopic magnetization, M, is given as a product o f the number o f electrons which change their spin direction and twice the spin magnetic moment. This factor o f 2 arises because each electron which transfers from one distribution to the other contributes twice its magnetic moment to the total magnetic moment o f the system. Thus
M - (number o f transferred electrons) x 2\xspm (21)
The total number o f electrons which change their direction is equal to the density o f states in one o f the spin distributions times the change in energy,
Transferred electrons = N +(EF)\x.spin\x.0H (22)
w here N +(EF) designates the density o f states in the spin-up distribution at the Fermi level, which is one-half the total density o f states. The final expression for the total
paramagnetic magnetization is
The magnetization is thus proportional to the external magnetic field, and so the
susceptibility is proportional to the density o f states times the square o f the spin magnetic moment for the electrons.
Based on this expression, the paramagnetic susceptibility o f the free electrons in a metal is then temperature-independent. However, an increase in tem perature can have tw o effects on the paramagnetic susceptibility. First, electrons at the Fermi level are thermally excited to higher energy states so that the application o f a magnetic field allows m ore electrons to reverse their spin since they can now occupy the levels vacated by the thermally excited electrons. This effect tends to increase the paramagnetic susceptibility. Secondly, the thermal energy tends to disorient those electron that have been aligned by the magnetic field and tends to decrease the susceptibility. The tw o effects approximately cancel in the noble and alkali metals so that the Pauli paramagnetism is approximately tem perature-independent. In most o f the non-magnetic transition metals, one effect dominates and the Pauli param agnetism either increases or decreases slightly with temperature.
For most metals including aluminum, the Pauli paramagnetism is larger than both diamagnetic effects and the magnetic susceptibility is slightly positive. In metals, the magnetism is based on the paramagnetism o f the free electrons which are free to move throughout space occupied by the metal. As explained previously, these electrons also provide a bonding mechanism for the metal as a whole. Therefore, a correlation between magnetism and bonding or phase stability should exist.
N ot all metals are paramagnetic. Although the density o f states at the Fermi level is normal, which makes paramagnetic behavior o f its valence electron quite normal,
C opper is diamagnetic. Copper comes at the end o f the first long transition period, and it has a newly filled 3d shell. Since the radius o f the d shell is large, the diamagnetic effect o f each o f these 3 d electrons is large. The 3 d state contains 10 electrons, and so the total diamagnetic behavior is large. These tw o factors - large orbit o f 3d electrons and large number o f 3 d electrons - make the diamagnetism o f the closed shells o f Copper larger than the paramagnetism o f the free 4s electron. Copper is thus weakly diamagnetic [29],
2.2.2 Hall Effect
W hen a conductor is placed in a magnetic field perpendicular to the direction o f current flow, a voltage is developed across the specimen in the direction perpendicular to both the current and the magnetic field. The voltage is called the Hall voltage [33, 34]. It is developed because the moving charges making up the current are forced to one side by the magnetic field. The charges accum ulate on a face o f the specimen until the electric field associated with the accumulated charge is large enough to cancel the force exerted by the magnetic field.
The Hall potential VH is generally given as:
VH = RoIH/t (24)
w here t is the thickness o f the sample, I the current flowing in the +x-direction, H the magnetic field in the +z-direction, VH the potential measured in the +y-direction, and R 0 a
constant o f the metal called the Hall coefficient. R 0 is negative when conduction is by electrons moving in the -x-direction, and is positive when conduction is by "holes" moving the +x-direction. Table 2.2 lists the room tem perature Hall coefficient o f some common metals.
The interpretation o f the Hall potential is divided into its tw o component parts, the ordinary Hall effect present in all metals and the anomalous Hall effect present only in ferromagnetic metals. W hen considering the ordinary Hall coefficient, the free electron theory yields a rather simple tem perature-independent result for R 0 [25, 35],
Ro = — Lr r = (25)
n0eN0 Ne
w here N 0 is the number o f atoms per cm3, n0 is the number o f current-carrying electrons per atom, and e is the charge on the electron. The Hall constant is negative for free electrons and the carrier concentration N = n 0N 0 is the electron concentration. M easurem ents o f R 0 for copper, silver, gold, lithium and sodium give values o f n 0
between 0.75 and 1.5 and for A1 a value o f n0 = 3 [35], M easurements o f R 0 for copper, silver, gold, lithium and sodium give values o f n0 betw een 0.75 and 1.5 and for A1 a value o f n0 = 3 [35],
As the Hall measurements are primarily influenced by the electron concentration o f the metallic matrix, the Hall coefficient should characterize the state o f the metal matrix. As stated previously by equation 6, the electron concentration determines the Fermi level,
TA BLE 2.2
RO O M TEM PERATU RE VALUES OF THE H A LL COEFFICIENT
Metal R0
10'u m3/A sec
Current Carriers per Atom (sign = carrier charge)
Li -17.0 -0.8 Na -24.5 -1.0 K -42.0 -1.2 Cu -6.0 -1.3 A1 -4.0 -2.6 Be +24.4 +0.2 Zn +3.3 +2.9 Ag -8.4 -1.3 Au -7.2 -1.5 Mg -11.3 -1.4 Mn +8.4 +0.9 Sn -0.5 -40.0 W + 11.3 +0.8 Fe +2.5 +3.0 Ni -5.6 -1.2 Zr +13.7 +1.1 Cr +36.3 +0.2 Mo + 18.0 +0.5
which has been shown to influence the properties o f the alloy. Comparing equation 6 with equation 11 reveals:
so that the Hall coefficient should be a m easurement o f Fermi level and therefore will be related to material properties.
2.2.3 M agnetic Phase Analysis
The nucleation and grow th processes o f precipitation involve the mass transport o f specific elements which are responding to a chemical potential gradient. Formation o f second phase will alter the composition o f the matrix material [36] (at least at locations adjacent to the precipitates), change the chemical potential o f the various species in the matrix, and cause changes in the electron concentration and Fermi energy level. These changes in electron concentration and Fermi energy are due to the transport o f electrons as required to maintain the electron chemical potential equal between the matrix and precipitating phase. A change in the density o f states will result as the Fermi level moves closer or further from the Brillouin zones. This change in the density o f states should affect the Pauli paramagnetism o f the alloy and therefore the bulk magnetic susceptibility. In addition, the change in electron concentration should alter the Hall coefficient o f the alloy. Thus, second phase formation results in changes in the electrical and magnetic properties which could be m onitored in part by magnetic susceptibility and Hall coefficient measurements.
2.3 A lum inum -C opper Alloy System
The first heat-treatable aluminum alloy was based on the Aluminum-Copper system, and w rought aluminum alloys having copper as the main alloying element are designated as 2X X X alloys using the four-digit numerical system developed by the Aluminum Association [36]. Copper is one o f the most important alloying elements for aluminum because it provides solid-solution strengthening. Since the copper atom has a diameter about 11 pet. less than the aluminum atom, the cubic lattice param eter between copper and aluminum is less than that o f the aluminum matrix. Therefore, the matrix is strained tetragonally. These strained sites impede dislocation movement, and cause an increase in hardening and a decrease in ductility.
In addition, suitable heat treatm ents o f aluminum-copper alloys cause precipitate form ation that produce increased strength. The maximum solid solubility o f copper in aluminum is 5.65 wt. pet. at the eutectic tem perature o f 548 C. The solubility o f copper in aluminum decreases rapidly with decreasing tem perature from 5.65 wt. pet. to less than 0.1 wt. pet. at room tem perature. The change in solid solubility with tem perature is a primary factor in the heat treatm ent o f aluminum-copper alloys. The thermal treatm ents are designed to alter the mode o f occurrence or m orphology o f the soluble copper alloying elements. Mechanical and physical properties depend not only on whether the solute is in or out o f solution but also on specific atomic arrangements, as well as on size and
alloys, five structures can be identified: (1) supersaturated solid solution a , (2) GP1 zones, (3) GP2 zones (also called 0" phase), (4) 0', and (5) 0 phase, CuA12. N ot all o f these phases occur from every heat treatm ent [36],
2.3.1 Solution Heat Treatm ent
As shown by Figure 2.2, regardless o f the initial structure, holding a 4.0 wt. pet. Cu alloy at approximately 495 C to 570 C until equilibrium is attained causes the copper to go completely into solid solution. Holding an Al-Cu alloy in this range is generally
known as "solution heat treating" [38], I f the tem perature o f a 4.0 wt. pet. Cu alloy is then reduced to below 495 C, the solid solution becomes supersaturated and there is a tendency for the excess solute no longer soluble to precipitate. The driving force for precipitation increases with the degree o f supersaturation and, consequently, with decreasing temperature. But the precipitation rate also depends on the atom mobility, which is reduced as tem perature decreases.
2.3.2 Quenching
The solid solution formed at a high tem perature may be retained in a supersaturated state by rapidly cooling to some lower tem perature usually near room temperature. The objective o f quenching is to avoid precipitation in the intermediate tem perature range, w here high rates o f diffusion and precipitation take place. The most im portant effect on mechanical properties o f the aluminum-copper alloys occurs after this cooling or
T em p er at u re (C ) L I Q « < L I Q U I D -!.♦ UQ L I Q U I D 4 a L I Q U I O + C u A I , 1 7 C u A I a + C u A I I O I S 5 20 3 0 3 5 5 0 5 5 <>o o 4 0 C opper (wt. pet.)
Figure 2.2. Aluminum-Copper Equilibrium Phase Diagram showing the solid solubility o f copper in aluminum is 5.65 wt. pet. at the eutectic tem perature o f 548 C
pronounced effect on corrosion behavior and mechanical properties o f the
precipitation-hardenable aluminum alloys. The effects o f precipitation during the quench on properties have been investigated by considering kinetics o f precipitation. A method which accurately predicts the type o f corrosion attack or themechanical properties from the cooling curve has been developed [39],
The precipitation can be controlled more precisely at the lower tem peratures that follow the quench. The formation o f precipitates requires diffusion o f copper to enable nucleation and growth. Diffusion o f the substitutional copper, as well as aluminum self-diffusion, is believed to occur primarily by a vacancy exchange mechanism. An atom can diffuse by moving into a vacant lattice position, leaving behind a new vacant lattice site. This mechanism o f diffusion is energetically favorable to the diffusion that occurs by tw o atoms changing places. In addition, the substitutional copper atom is close in size to the aluminum atom so that interstitial diffusion does not happen. Therefore, the increased low -tem perature solute mobility required for the high rate o f precipitate formation is explained by a nonequilibrium high vacancy concentration at the low temperature. The equilibrium concentration o f vacancies in aluminum increases with increasing temperature. Quenching not only retains solute copper atoms in solution, but maintains a certain
minimum number o f vacant lattice sites to prom ote the low-tem perature diffusion required for precipitation nucleation and grow th
In aluminum-copper alloys, the nucleation o f a new phase is greatly influenced by the existence o f discontinuities in the lattice. The precipitate will strain the surrounding
solid-solution matrix, and there is a driving force to minimize this lattice strain energy. Therefore, nucleation is heterogeneous and takes place preferentially at locations o f greater disorder and higher energy than the solid-solution matrix. As a result, grain boundaries are preferred sites for nucleation o f precipitates. Dislocations formed by condensation o f vacancies or by introduction o f plastic strain are also very active
nucleation sites for precipitation. Variations in dislocation density resulting from different quenching rates and the degree o f vacancy and solute retention achieved during the
quench are factors in determining the effects o f quenching rates on strengthening. The most rapid quenching rates establish conditions for more uniform precipitation throughout the alloy. M ore uniform precipitation provides a maximum number o f strengthening units which is the most effective strengthening condition [40],
2.3.3 Aging
M ost aluminum alloys exhibit property changes at room tem perature after
quenching. This process o f change is called "natural aging," and is the result o f precipitate strengthening. It may start immediately after quenching, or after an induction period. The rates vary from one aluminum alloy to another over a wide range, so that the approach to a stable condition may require only a few days or several years. In some alloys, sufficient precipitation to yield stable products with properties adequate for many application occurs in a few days at room tem perature. Historically, magnesium has been added to Al-Cu alloys to improve natural aging characteristics [41].
Atomic and crystallographic structural changes occur in supersaturated solid solutions during precipitation. These changes involve a complex sequence o f
tim e-dependent and tem perature-dependent steps. At relatively low tem peratures and during initial periods o f artificial aging at moderately elevated temperatures, the principal change is a redistribution o f copper atoms within the solid-solution lattice to form clusters or zones (Guinier-Preston zones). These zones are considerably enriched in solute. This local segregation o f solute atoms produces a distortion o f the lattice planes, both within the zones and extending for several atom layers in the matrix. With an increase in number or density o f zones, the amount o f disturbance to the regularity and periodicity o f the lattice increases. This increased irregularity interferes with the motion o f dislocations through the lattice. Strengthening occurs by the inability o f dislocations to move through the matrix to cause plastic strain.
During natural aging o f Al-Cu alloys, the dissociation o f the supersaturated solid solution begins by coherent precipitation o f copper-rich zones only a few atoms thick (40 to 60 nm). These precipitates are tw o dimensional discs and are named Guinier-Preston 1 (GP1) zones. The GP1 zones form clusters on the {100} cubic planes o f the aluminum solid solution matrix and are usually 300-500 nm in diameter. They stress the aluminum lattice, and because o f their great number, form a dense netw ork which impedes the movement o f dislocations during deformation. The zone size does not change with aging time, but the number increases until in the average distance between zones is about
The effects o f precipitation on mechanical properties are greatly accelerated and accentuated by reheating the quenched material to about 100 to 200°C. As aging tem peratures or time are increased, the zones are either converted into or replaced by particles having a crystal structure distinct from that o f the solid solution and also different from the structure o f the equilibrium phase. These particles are referred to as transition precipitates. They have a specific crystallographic orientation relationship with the solid solution, such that the tw o phases remain coherent on certain planes by adaptation o f the matrix through local elastic strain. Slowing the movement o f dislocations, the lattice strains and precipitate particles create a strengthening effect. The operation o f heating above room tem perature to grow precipitant is called "artificial aging" or precipitation heat treating [42].
GP1 zones go back into solution in a short time at 150-200°C. This "reversion" leads to a tem porary reduction in hardness, and suggests that the arrangement o f the strengthening atoms, after artificial aging, is basically different from that after natural aging. Artificial aging causes new enrichment o f copper atoms in Guinier-Preston 2 (GP2) zones soon after the end o f the reversion. GP2 zones are sometimes referred to as 0".
As in the case o f G P 1 zones, GP2 zones have a tetragonal structure and are coherent with the {100} matrix planes. The GP2 zones range in size from 100 to 400 nm thick and 1,000 to 10,000 nm in diameter. Although these precipitates are only a few atom layers in thickness, they are considered three-dimensional and have an ordered atomic arrangement.
The increase in strength continues indefinitely at room tem perature, although the rate o f change may be extremely slow after months or years. Aging at elevated
tem peratures is characterized by a different behavior, in which strength and hardness increase to a maximum and subsequently decrease. Maximum hardness and strength occur when the amount o f GP2 is essentially maximum. The softening effects, observed as more complete precipitation occurs during extended isothermal aging at elevated tem peratures, are referred to as "overaging" [40],
Overaging is characterized by a reduction in the hardness, tensile strength, and elongation. Softening results from changes in both type and size o f the precipitated particles, and from dilution o f solid solution.
As the artificial aging continues at approximately 150°C, the formation o f a
metastable phase, 0', takes place 0' forms after the GP2 but coexists with it over a range o f time and tem perature. 0' has the same composition as the equilibrium phase 0 (CuA12),
but has a different crystal lattice and exhibits coherency with the solid solution lattice. 0' is fully coherent with the matrix along the broad faces, and the {001} planes and <001 > directions o f the 0' are parallel to the {001} planes and < 0 0 1> direction o f the matrix. This phase nucleates heterogeneously, especially on dislocations that can act to relieve the misfit associated with the precipitate. D eform ation prior to aging can accelerate the form ation o f 0' at the expense o f the GP zones. The size o f the 0' phase depends on the time and tem perature o f aging, and ranges from 1,000 to 60,000 nm or more in diameter with a thickness o f 1,000 to 1,500 nm [38],
As the amount o f 0' increases, particle grow th eventually decreases the coherency strains. This loss in coherency, together w ith the simultaneous decrease in GP2, causes overaging. Figure 2.3 shows lattice arrangem ents that represent the transition from coherent to partially coherent to incoherent precipitates.
Aging at tem peratures o f about 190°C or above for extensive times will produce the equilibrium incoherent 0 phase, CuA12. This phase has a body-centered tetragonal structure. 0 can form from 0' or directly from the matrix, and is present when the alloy is in a highly overaged condition. This softest, low est-strength condition o f the heat
treatable alloys has the maximum amount o f solute precipitated as relatively large particles, leaving the solid solution as dilute as possible.
O
Aluminum atoms;
•
Foreign atoms (e.g. Cu)
Figure 2 .3: Schematic representation o f (a) a solid solution with a random distribution o f foreign atoms; (b) coherent precipitation; (c) a partially coherent intermediate phase in a solid solution. The vertical crystal planes are coherent, the
C H A PTER 3
EX PER IM EN TA L PROCEDURES
3.1 Sample Preparation
Selection o f an alloy system w ith a thoroughly studied phase stability is required to evaluate the use o f electronic and/or magnetic measurements. The binary
aluminum - copper system, with its phase transitions during annealing from GP1 to GP 2 to 0' to 0 phase, was chosen for this investigation. These phase transitions range from pre-precipitates with coherent interfaces to incoherent stable precipitates.
A 2 kilogram ingot o f 99.999 wt. pet. aluminum and 500 grams o f 99.9 wt. pet. copper shot, 1 to 10 mm in diameter, w ere procured from the Johnson M atthey Chemical Company. Two 750 milliliter conical crucibles, tw o crucible covers, and one 750 milliliter rectangular back-up tray, all fabricated o f alumina, w ere procured from Ceramicon
Designs Ltd.
The aluminum ingot was cut into pieces, and 940.0 grams o f aluminum along with 37.6 grams copper w ere charged in a alumina crucible to produce an aluminum alloy with 4 wt. pet. copper. The crucible was covered with a lid, set in the rectangular tray, and placed in the vacuum furnace. The furnace w as programmed and the metal was melted according to the param eters shown in Appendix A, Figure A - l . Using a band saw, the produced ingot was then cut and the pieces mixed and place in the second conical crucible. The alloy was remelted in the vacuum furnace in the sequence indicated in Appendix A, Figure A-2.
From the resulting ingot, rectangular prisms were cut with dimensions o f approximately 10 mm x 10 mm x 70 mm. Eight o f these prisms w ere then turned on a lathe to produce 5 mm cylinders. The cylinders w ere cut to 10 mm lengths resulting in 32 samples being prepared.
3.2 Sample M atrix
To achieve a 0 phase in a reasonable aging time, artificial aging at 200 C was selected. Using the 32 samples to cover the range o f micro structures and precipitates anticipated, a matrix o f aging times was developed. Samples w ere prepared according to the heat treatm ent outlined in Table 3 .1.
3.3 M agnetic Susceptibility M easurem ent
The magnetic susceptibility measurements were performed on a Quantum Design M agnetic Property M easurem ent System (M PM S) at the National Institute o f Standards and Technologies (NIST), Boulder, Colorado. The M PM S is a modular integration o f a superconducting quantum interference device (SQUID) detection system and a precision tem perature control unit residing in the bore o f a superconducting magnet. The system is controlled by a computer.
The SQUID detection allows measurement o f the magnetic response o f a material. The SQUID consists o f a superconducting ring with a small insulating layer which serves as a 'weak link', and is known as a Josephson junction [30], The magnetic flux passing through the ring is quantized once the ring has gone superconducting but the w eak link
![Figure 2.1: Baker-N utting Diagram which shows tim e-tem perature dependence o f carbide stability for 2.25 Cr- 1 Mo steel a) quenched and tem pered b) normalized and tem pered [27].](https://thumb-eu.123doks.com/thumbv2/5dokorg/4416570.105479/21.918.230.662.154.945/figure-diagram-perature-dependence-carbide-stability-quenched-normalized.webp)