Smartphone-based Parkinson’s disease
symptom assessment
Somayeh Aghanavesi
Dalarna Licentiate Thesis No. 6
Smartphone-based Parkinson’s disease
symptom assessment
Somayeh Aghanavesi
Microdata Analysis
School of Technology and Business Studies
Dalarna University
Sweden
2017
Abstract
This thesis consists of four research papers presenting a microdata analysis approach to assess and evaluate the Parkinson’s disease (PD) motor symptoms using smartphone-based systems. PD is a progressive neurological disorder that is characterized by motor symptoms. It is a complex disease that requires continuous monitoring and multidimensional symptom analysis. Both patients’ perception regarding common symptom and their motor function need to be related to the repeated and time-stamped assessment; with this, the full extent of patient’s condition could be revealed. The smartphone enables and facilitates the remote, long-term and repeated assessment of PD symptoms. Two types of collected data from smartphone were used, one during a three year, and another during one-day clinical study. The data were collected from series of tests consisting of tapping and spiral motor tests. During the second time scale data collection, along smartphone-based measurements patients were video recorded while performing standardized motor tasks according to Unified Parkinson’s disease rating scales (UPDRS).
At first, the objective of this thesis was to elaborate the state of the art, sensor systems, and measures that were used to detect, assess and quantify the four cardinal and dyskinetic motor symptoms. This was done through a review study. The review showed that smartphones as the new generation of sensing devices are preferred since they are considered as part of patients’ daily accessories, they are available and they include high-resolution activity data. Smartphones can capture important measures such as forces, acceleration and radial displacements that are useful for assessing PD motor symptoms.
Through the obtained insights from the review study, the second objective of this thesis was to investigate whether a combination of tapping and spiral drawing tests could be useful to quantify dexterity in PD. More specifically, the aim was to develop data-driven methods to quantify and characterize dexterity in PD. The results from this study showed that tapping and spiral drawing tests that were collected by smartphone can detect movements reasonably well related to under- and over-medication.
The thesis continued by developing an Approximate Entropy (ApEn)-based method, which aimed to measure the amount of temporal irregularity during spiral drawing tests. One of the disabilities associated with PD is the impaired ability to accurately time movements. The increase in timing variability among patients when compared to healthy subjects, suggests that the Basal Ganglia (BG) has a role in interval timing. ApEn method was used to measure temporal irregularity score (TIS) which could significantly differentiate the healthy subjects and patients at different stages of the disease. This method was compared to two other methods which were used to measure the overall drawing impairment and shakiness. TIS had better reliability and responsiveness compared to the other methods. However, in contrast to other methods, the mean scores of the ApEn-based method improved significantly during a 3-year clinical study, indicating a possible impact of pathological BG oscillations in temporal control during spiral drawing tasks. In addition, due to the data collection scheme, the study was limited to have no gold standard for validating the TIS. However, the study continued to further investigate the findings using another screen resolution, new dataset, new patient groups, and for shorter term measurements. The new dataset included the clinical assessments of patients while they performed tests according to UPDRS. The results of this study confirmed the findings in the previous study. Further investigation when assessing the correlation of TIS to clinical ratings showed the amount of temporal irregularity present in the spiral drawing cannot be detected during clinical assessment since TIS is an upper limb high frequency-based measure.
Keywords: Parkinson’s disease; symptom assessment; spiral; tapping; smartphone; temporal irregularity; timing variability; approximate entropy;
Included papers
This thesis is a summary of the following four papers, which are referred to them in the text as Paper I Paper II, Paper III, and Paper IV.
Paper I – Aghanavesi S., and Westin J. (2016). A review of Parkinson’s disease cardinal and dyskinetic motor symptoms assessment methods using sensor systems. EAI International Conference on IoT Technologies for HealthCare. LNICST 187, pp. 52–57, 2016. Published.
Paper II – Aghanavesi S., Nyholm D., Senek M., Bergquist F., and Memedi M. (2017). A smartphone-based system to quantify dexterity in Parkinson’s disease patients. Journal of Informatics in medicine unlocked. Accepted for publication.
Paper III – Memedi M., Aghanavesi S., and Westin J. (2016). A method for measuring Parkinson’s disease related temporal irregularity in spiral drawings. IEEE-EMBS International Conference on Biomedical and Health Informatics (BHI). Published.
Paper IV – Aghanavesi S., Memedi M., Dougherty M., Nyholm D., and Westin J. (2017). Verification of a method for measuring Parkinson's disease related temporal irregularity in spiral drawings. Journal of Biomedical and Health Informatics. Submitted.
My contributions to the papers were as follows:
Paper I – I planned the literature review in the paper together with Jerker Westin. I conducted the review and wrote the paper and revised it.
Paper II – I have been in a session for data collection and I performed the data processing, development of the methods, and data analysis. I wrote the first version of the manuscript and revised it.
Paper III – I was involved in method development, analysis of the results, and writing and revising parts of the manuscript.
Paper IV – I performed data processing, method development, as well as the data analysis, and I wrote the manuscript and revised it.
Table of Contents
Introduction ... 1
I. Review of methods and measures (Paper I) ... 3
II. Smartphone-based system to quantify Parkinson’s disease dexterity (Paper II) ... 4
III. Measuring Parkinson’s disease related temporal irregularity (Paper III) ...6
IV. Verification of Parkinson's disease temporal irregularity measure (Paper IV) ……….7
Conclusion and future research ……….……….……….8
Acknowledgements ... 9 References ... 9 PAPER I ... 12 PAPER II... 19 PAPER III ... 37 PAPER IV ... 45
1
Introduction
This is a licentiate thesis in microdata analysis. In the study of Parkinson’s disease (PD) motor symptom assessment, microdata is information at the level of subjects' time-based motor movements, and time-based treatment. The time levels of collected data in this thesis refer to the movement and treatment data that were collected and analyzed during two schemes. In one data collection scheme, the data was collected during 36-month whereas during another data collection scheme it was collected during a day at various time points. The variables were recorded separately for each subject who performed the tests. The subjects’ data with their time stamp ranging from months to seconds were analyzed. Large quantities of data were involved and the analyses were separately performed for subjects based on variables. An advantage of performing research in microdata is that the results are aggregated from the data that were analyzed at micro-level. However, summarizing results to an aggregate level may result in information loss. Exploring the relationships between variables from aggregated results are not possible. Therefore having access to microdata allows to investigate the interactions between variables and perform detailed analysis. The aim of microdata analysis in this thesis was to fill the identified gaps between data, information, and knowledge. PD is the second most common neurodegenerative disorder (Shin et al., 2016) and is characterized by degeneration of dopaminergic neurons in the substantia nigra. It is characterized by motor and non-motor symptoms that can impact on the function to a variable degree. The four cardinal motor symptoms of PD comprise tremor, rigidity, bradykinesia and postural instability. Common treatments for PD are levodopa and dopamine agonist tablets, deep brain stimulation (DBS) and levodopa/carbidopa intestinal gel (LCIG) (Schapira, 2009). The primary goal of therapy is to maintain good motor function.
Motor symptoms of PD are typically assessed using clinical scales such as Unified PD rating scale (UPDRS) which is used to evaluate the presence and severity of PD motor symptoms as well as symptom fluctuations. However, clinical scales-based measurements are not able to capture variations in symptoms continuously and they are insensitive to subtle changes. To reveal the full extent of patients’ condition and prevent recall and reporting bias, the symptoms need to be captured frequently, before and after medication (Isacson, et al., 2008a). In addition, the therapeutic decision making requires accurate, comprehensive and accessible quantification of symptoms. Electronic sensor-based systems can facilitate remote, long-term and repeated symptom assessments. They are able to capture the symptom fluctuations more accurately and also they are effective with patient’s hospitalization costs.
Recent advances in information and communication technologies have enabled remote and continuous monitoring of motor symptoms (Maetzler, et al., 2013). Previous studies have shown that such technologies provide accurate and valid objective assessment of symptoms. It was previously reported that they may assist in identifying motor functions (On, Off and dyskinesia) (Andong Zhan, 2016). From the technological point of view, data from different kinds of sensors during standardized tests and passive monitoring of physical activity have been previously analyzed and processed using signal processing and machine learning methods (Griffiths, et al., 2012; Zeng, et al., 2016). Some studies have focused on analyzing data from upper limbs during standardized tasks like finger tapping (Shima, et al., 2009), digital spiral analysis. As an alternative to wearable sensors-based systems, touch screen devices (Haubenberger, et al., 2011; X. Liu, et al., 2005; Saunders-Pullman, et al., 2008) have been the focus for some research studies for assessing dexterity performance of PD patients by analyzing their collected upper limb motor data. Such smartphone measurements were previously used for assessing different fine motor dysfunctions such as tremor (Haubenberger, et al., 2011), dyskinesia (X. Liu, et al., 2005), drawing impairments (Westin, et al., 2010a).
2
Quantitative measures during alternating tapping tests and digital spiral analysis have been previously used as measures of bradykinesia (Giovannoni, et al., 1999) and severity of PD motor symptoms (Saunders-Pullman, et al., 2008) respectively.
With a view to technologies used to detect PD dexterities, measuring rhythm and regularity in PD are found important. In research to measure the regularity, variability, complexity, and unpredictability of various movement signals in PD, Approximate Entropy (ApEn) method is identified as an essential method. Regularity was basically measured by regularity statistics which were centered on various entropy measures (Pincus, et al., 1991). In statistics, ApEn is a technique to quantify the regularity, unpredictability, uncertainty of fluctuations over time series data. For this purpose signals from ankle joint while PD patients walked on a treadmill (Kurz, et al., 2010), as well as their tremor signals (Morrison, et al., 2013), and wrist movements signals (Powell, et al., 2014) have been analyzed with this method to measure the amount of regularity. In addition, time series like biking speed signal (Mohammadi-Abdar, et al., 2016) and EEG emotional signal (Yuvaraj, et al., 2016) have been analyzed with this method to measure the amount variability in relation to PD.
As introduced in the previous paragraphs, there is a need to review the state of the art, sensors, and signals that were used to evaluate the PD motor symptoms in order to identify the potential points for further development and evaluation of the symptom assessment methods.
In view of the technologies/methods that were used to evaluate PD dexterity, there was found no study reporting an approach where tapping and spiral drawing test data were combined in a data-driven manner and related to objective measures of motor functions, various clinical ratings, and actual treatment. In addition to what is done to measure the regularities in PD movement signals, the question for temporal irregularity measure of spiral drawings that were performed by PD patients remained uninvestigated except in our last study (Memedi, et al., 2016b).
The main objective of this licentiate thesis is to develop PD symptom assessment methods. With regard to what were mentioned as missing points in the last paragraph, the following research questions arise:
• What is the current state of the art, sensor systems, and measures to detect, assess and quantify the four cardinal and dyskinetic motor symptoms?
• How to combine spiral and tapping tests data in a data-driven manner and relate them to the objective assessment of motor function in PD, various clinical ratings, and the actual treatment? • How to measure the temporal irregularity in Parkinson’s disease using spiral drawing tests?
o How to verify the findings of last research question using another screen resolution, new dataset, new patient groups, and during shorter term measurements?
In contemplation of answering last research questions, the work in this thesis has been segmented into four steps. In the first step, a review study of the state of the art and sensor systems that have been used to detect, assess and quantify the four cardinal and dyskinetic motor symptoms, has been conducted (Paper I). The review surveys the manifestation of PD motor symptoms, sensors that were used for their detection, types of signals (measure) as well as their signal processing methods. A summary of this review’s finding is represented in a table including devices, measures, and methods that were used in each reviewed motor symptom assessment study.
The second step aims to investigate whether a smartphone-based system can be used to quantify dexterity in PD (Paper II). More specifically, the aim was to develop data-driven methods to quantify and characterize dexterity in PD. The raw tapping and spiral data were processed and analyzed with time series
3
analysis techniques to extract 37 spatiotemporal features. For each of the five scales, separate machine learning models were built and tested by using principal components of the features as predictors and mean ratings of the three specialists as target variables.
During the third step, the development and evaluation of clinimetric properties of a method were done for measuring PD-related temporal irregularities using digital spiral analysis (Paper III).
Finally, the fourth step aimed to confirm the reproducibility of the results obtained in previous research using a new dataset, new patient groups, using another screen resolution, and during shorter term measurements. In addition, further investigations for assessing the responsiveness of irregularity score to treatment, and it’s correlation to clinical ratings were done (Paper IV).
The above brief description attempts to present the appended papers that are attached at the end of this thesis. The rest of the thesis is organized with summaries of papers in order. The thesis ends with conclusions and proposes possible future studies.
I.
Review of methods and measures (Paper I)
PD is a progressive neurological disorder characterized by a large number of motor symptoms that can impact on the patient’s function to a variable degree. Since electronic sensor-based systems can facilitate remote, long-term and repeated symptom assessments, these technologies attempting to assess the PD motor symptoms objectively are increasing. This paper investigates the state of the art, measures and sensor systems that were used to detect, assess and quantify the four cardinal and dyskinetic motor symptoms. The four cardinal motor symptoms of PD comprise of tremor, rigidity, bradykinesia and postural instability. Parkinson’s tremor is the most apparent well-known symptom. Rigidity symptoms cause stiffness and result in inflexibility. Bradykinesia is generally the slowness of movements. Postural instability symptom is a trend to be unstable and dyskinesia is a difficulty in performing voluntary movements, which often occurs as a side effect of long-term therapy with levodopa.
Among the developed electronic techniques to measure and analyze the PD’s symptoms the common sensors and devices for evaluation are accelerometer, electromyograph, magnetic tracker system, gyroscope, digitizing tablet (X. Liu, et al., 2005; Westin, Ghiamati, et al., 2010), video recording, motion detector, and depth sensor. Methods like Wavelet transform, Principal component analysis, Discrete Fourier Transform, Fast Fourier transform (Westin, Dougherty, et al., 2010), Detrended Fluctuation Analysis (Arora, et al., 2015b), and Spectral Analysis are identified as signal processing methods for PD’s motor symptom assessment. Furthermore, Artificial Intelligence (AI) that is used in frameworks of Visual perception, decision making, image processing, and classification techniques enables the development of computer systems to perform tasks that usually require human intelligence. Machine learning in PD symptom assessment (Sama, et al., 2012) often includes techniques to assess the magnitude of addressed symptom. In addition, linear discriminant analysis (Lopane, et al., 2015) with various alternatives of Non-parametric, generalized and multilayer perceptron analysis was invoked as a classification method in AI. The results of this review paper are summarized in a table which includes the evaluated symptoms, type of the instruments, calculated measures and employed analytical assessment methods. This table may help in recognizing the common or special types of methods and sensors to be used for different types of symptoms assessments. Based on the obtained results the two symptoms, rigidity and postural instability are mostly evaluated as single symptoms. However, among articles which assessed the combination of symptoms,
4
bradykinesia (together with tremor, dyskinesia, rigidity, and dyskinesia together) is the most studied symptom.
A common sensor for symptom detection was the accelerometer that was mostly used for detecting the tremor, dyskinesia, and postural instability. The digitizing tablet is used for assessing almost all types of symptoms. Smartphone (Arora, et al., 2015b) and Microsoft Kinect (Yeung, et al., 2014) are the latest devices in the market used for this purpose. Smartphones as a new generation of sensing devices are expanding rapidly with PD motor symptom assessments. Since wearable sensors are small, available, accurate, including high-resolution activity data, and flexible with body locations, they are preferred for PD since it’s a progressive chronic disease and symptoms need to be assessed continuously throughout the day. For this, mobile applications and wrist watches are more preferred as they are currently part of almost everyone’s daily accessories. However, their analysis methods and their validations are important and a question is whether the devices or clinical ratings will become the gold standard. Machine learning techniques are potentially good solutions in the development of assessment systems to determine the effectiveness of drug dosing. Tools that can effectively characterize the severity of symptoms and can discriminate between bradykinesia and dyskinesia are needed. Some successful products are Parkinson’s Kinetigraph, Kinesia devices, and PD Holter monitor from Rempark project.
II.
Smartphone
-based system to quantify the PD dexterity (Paper II)
The aim of this paper is to investigate whether a smartphone-based system can be used to quantify dexterity in PD. More specifically, the aim was to develop data-driven methods to quantify and characterize dexterity in PD.
The current state of the art for assessing PD motor symptoms in clinical routine and studies is by using clinical rating scales based on observations and judgments of clinicians and medical history. However, clinician-based measurements are not able to capture variations in symptoms on a day-to-day basis since they only reflect one brief point in time. To reveal the full extent of patients’ condition and prevent a recall and reporting bias, motor symptoms need to be captured frequently, before and after medication (Isacson, et al., 2008a). From the clinical point of view, it is challenging to remotely and frequently determine the current motor state of the patient to determine whether the patient is under-medicated (a state in which the PD motor symptoms such as bradykinesia, tremor, rigidity, and others appear) or over-medicated (the appearance of hyperkinetic movements related to excessive levels of medication). Therefore, assessing the current motor state of the patients is essential for deriving an optimal treatment strategy.
From the technological point of view, there are different studies with the focus on quantifying various motor symptoms. Some have focused on assessing motor dysfunctions in upper extremities (Heldman, et al., 2014), and some focused on gross motor symptoms like gait (Mariani, et al., 2010), while others focused on combination of both. As an alternative to wearable sensors-based systems, some research groups have focused on assessing dexterity performance of PD patients by analyzing upper limb motor data collected by means of touch screen devices. Smartphone measurements were previously used for assessing different fine motor dysfunctions like tremor, dyskinesia, drawing impairments and global tapping performance. Quantitative measures during alternating tapping tests and digital spiral analysis have been previously used as measures of bradykinesia and severity of PD motor symptoms. To our knowledge, there is no study
5
reporting an approach where tapping and spiral drawing test data were combined in a data-driven manner and related to clinical ratings and actual treatment.
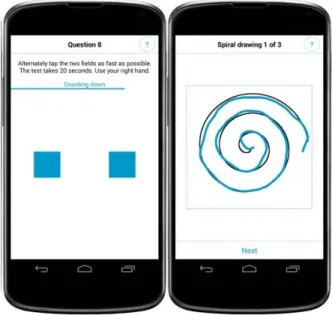
During the data collection, nineteen fluctuating PD patients and 22 healthy controls were recruited in a single center, open label, single dose clinical trial. Both patients and healthy controls were asked to perform dexterity tests (tapping and spiral drawing) using a smartphone at specific time intervals. For the patients, the dose administered was 150% of their individual levodopa equivalent morning dose to follow transitions between Off, On, and On with dyskinesia motor states. The healthy controls were asked to perform the tests, 8 times each. Along with smartphone-based measurements, patients were video recorded while performing standardized motor tasks according to Unified Parkinson’s disease rating scales (UPDRS) (Fahn, et al., 1987). The recorded videos were presented in a randomized order to three movement disorder specialists so that the ratings were blinded with respect to time from dose administration. The specialists rated three UPDRS-part III (motor examination) items including UPDRS item #23 (finger tapping), UPDRS #25 (rapid alternating movements of hands), and UPDRS #31 (bradykinesia), according to the definitions of the motor examination part of the UPDRS.
The raw dexterity data were processed with time series analysis methods to calculate 37 spatiotemporal features, which represent the severity of symptoms. Different kinematic quantities, including time, distance, speed, and velocity were used as primary signals to be processed and analyzed using time- and wavelet-domain methods. To reduce the dimensions of the features but keep the most important and related information into a smaller set, principal component analysis (PCA) using the correlation matrix method was applied on the 37 features. Seven principal component scores (PCs) were retained and used in subsequent analysis. The PCs were used as predictors to supervised machine learning methods used to map to the mean ratings of the three movement disorder specialists on the clinical rating scales used in the clinical trial. Four machine learning methods were evaluated and a stratified 10-fold cross-validation was applied to test the performance of the machine learning methods. For each of the five scales, separate models were built and tested. The performance of the machine learning methods, the agreement between the three specialists’ ratings were assessed. The mean PCs differences between the groups of patients and healthy controls were examined. The relative ability to detect the change from baseline (no medication) to follow up time points when patients were on medication was assessed by effect sizes. Test-retest reliability (or consistency) of mean specialist and smartphone-based scores was calculated.
The obtained results indicate that the methods could capture motor symptoms reasonably well as compared to the mean assessments of three movement disorder specialists on three items of UPDRS-III, TRS and dyskinesia scales. The correlations were weak to moderate between the scores generated by the methods and the mean clinical ratings, indicating that tapping and spiral drawing tests capture relevant symptom information corresponding to the clinical rating scales. In addition, the PC1 could follow transitions between motor states across the levodopa test cycle since it had similar trends as the TRS and dyskinesia scale. These results suggest that tapping and spiral drawing tests with the smartphone can detect movements reasonably well related to under- and over-medication. In contrast to the clinical rating scales, another advantage with the current system is that PD-related outcomes can be captured and assessed more frequently. As a limitation of this study, there was a considerable amount of inter-rater variability.
As a conclusion, the results presented in this paper indicate that tapping and spiral drawing tests of the smartphone contain relevant symptom information for detecting and assessing PD dexterity. The results suggest that the tests can be useful in detecting changes in motor symptoms related to treatment.
6
III. Measuring Parkinson’s disease related temporal irregularity in spiral drawings
(Paper III)
The motivation of this paper is the research question about measuring the temporal irregularity in PD using spiral drawing tests. One of the disabilities associated with PD is the impaired ability to accurately time movements (Coull, et al., 2011). Many studies have shown an increase in timing variability among patients when compared to healthy subjects, suggesting the Basal Ganglia (BG) has a role in interval timing (Buhusi, et al., 2005). Relating objective measures obtained by instrumented tests to pathological BG fluctuations would be beneficial for facilitating the assessment of high-frequency motor irregularities that could be difficult to be assessed visually (Raz, et al., 2001).
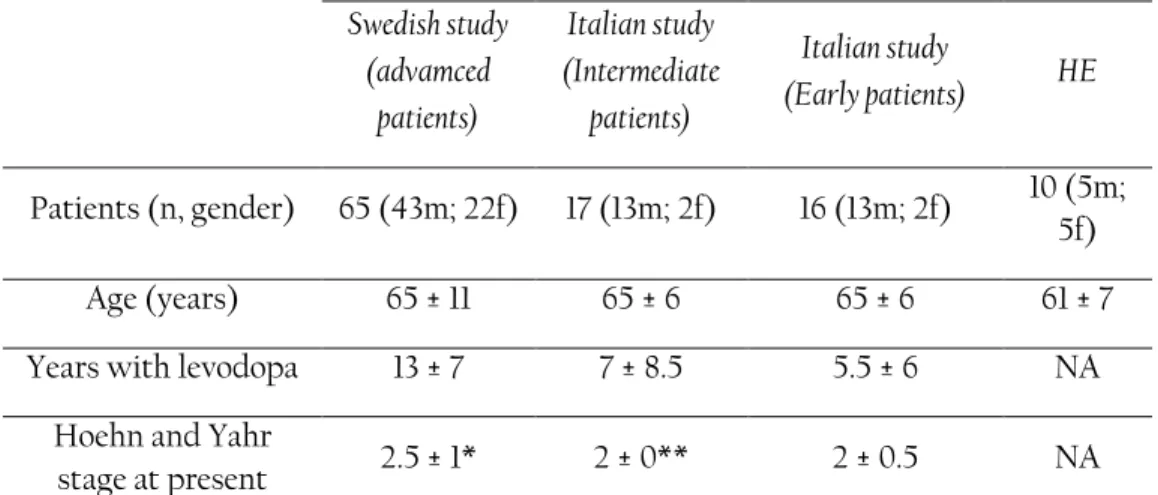
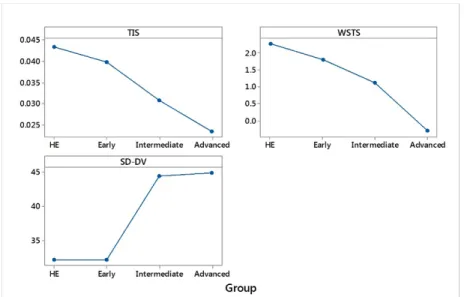
In this study, the upper limb temporal irregularity of 98 patients in different stages of PD and 10 healthy elderly subjects was investigated. The study was carried out when the subjects performed repeated spiral drawing tasks in their home environments using a touch screen device. On inclusion, 35 of these patients were treated with levodopa-carbidopa intestinal gel infusion (LCIG) and 30 patients were candidates for switching from conventional oral PD treatment to LCIG. Approximate entropy method was used to quantify the amount of temporal irregularity during spiral drawing tasks. In addition to this method, two more spiral scoring methods of a standard deviation of drawing velocity (SD-DV) (X. Liu, et al., 2005), and wavelet spiral test score (WSTS) (Westin, et al., 2010b) were adopted and their scores were compared to the ApEn-based method.
Differences in mean scores of the three methods across the four subject groups (healthy, early PD, intermediate PD, advanced PD) were assessed. Three machine learning methods of logistic regression, C4.5 decision tree, and random Forests with stratified 10-fold cross validation were tested to classify the two groups of healthy and patients. The relative ability of the methods to detect the change from baseline (oral treatment) to month 0 (LCIG) was determined. The long-term progressions of the three scores were assessed. Correlations between the three scores as well as the Test-retest reliability of the three scores were evaluated.
As result, the mean temporal irregularity score (TIS) differed significantly between healthy elderly subjects and advanced PD patients (P<0.005). The best performing classifier was the logistic regression that correctly classified the group with an accuracy of 85% and weighted AUC of 0.89. The ApEn-based method had a better responsiveness and test-retest reliability when compared to the other two methods (SD-DV, WSTS). In contrast to the other methods, the mean scores of the ApEn-based method improved significantly during a 3-year clinical study, indicating a possible impact of pathological BG oscillations in temporal control during spiral drawing tasks.
A limitation of the study was that there was no gold standard to validate the TIS. This limitation was related to the data collection scheme where subjects repeatedly used the touch screen device in their home environments without clinical supervision. That is, there was no test occasion level clinical ratings to assess the validity of TIS. This motivates to continue the study with the further investigation of the relation between TIS and clinical ratings as well as investigating the clinimetric properties of TIS on a new data set. Alternatively, since the BG oscillations are affected by deep brain stimulation (DBS) treatment frequencies another interesting research question that could be investigated in the future would be to calculate the TIS on spiral data of patients on DBS treatment. This would allow investigating the relationship between TIS and different DBS frequencies as well as during Off and On stimulation phases and whether TIS could be useful for adjusting DBS treatment.
7
IV. Verification of Parkinson’s disease temporal irregularity measure during spiral
drawings (Paper IV)
There are different studies with the focus on quantifying PD regularity, variability, complexity, and unpredictability of various signals using Approximate Entropy (ApEn). Some studies measured regularity of the ankle joint movement signal (Kurz, et al., 2010), tremor signal (Morrison, et al., 2013), and wrist movement signal (Powell, et al., 2014) in PD. In measuring the variability of signals using ApEn, studies were found that measured the amount of variability in biking speed signal (Mohammadi-Abdar, et al., 2016), and EEG emotional signal (Yuvaraj, et al., 2016). To our knowledge, ApEn has not been investigated for PD where patients performed spiral tests, except in our last study (ST1) (Memedi, et al., 2016b).
As the continuation from ST1, The purpose of this paper is to verify and further investigate the results from ST1 using the calculated upper limb temporal irregularity of PD patients with same methodology (ApEn) but using a new dataset, new patient groups, using another screen resolution, and during shorter term measurements. The paper reports properties of the temporal irregularity measure including the differences in TIS between patients in different stages of PD and healthy subjects and the test-retest reliability of TIS. In addition, the responsiveness of TIS to levodopa treatment during single dose experiments, and the correlations between TIS and clinical ratings are reported.
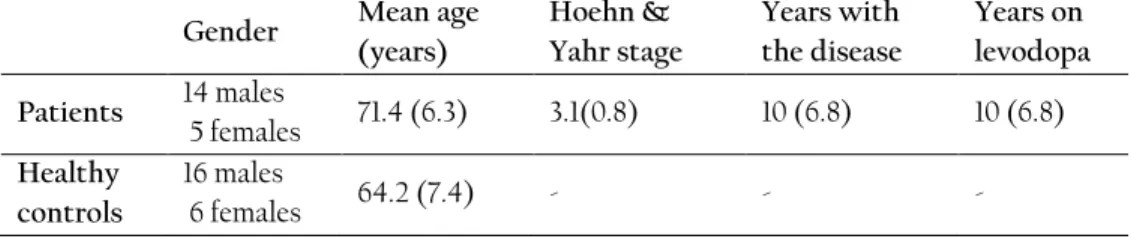
In this study nineteen PD patients and 22 healthy controls performed repeated spiral drawing tasks on a smartphone. Patients performed the tests before a single levodopa dose and at specific time intervals after the dose was given. Healthy controls were asked to perform a fine motor test (spiral drawing) using a smartphone at specific time intervals. Up to 15 samples per PD patient, and up to 8 samples per healthy control were collected. Three movement disorder specialists rated videos of the patients while performing standardized motor tasks. The specialists rated six UPDRS-part III (motor examination) items including UPDRS item #23 (finger tapping), UPDRS #25 (rapid alternating movements of hands), UPDRS #26 (leg agility), UPDRS #27 (Arising from Chair) and, UPDRS #29 (gait), UPDRS #31 (bradykinesia), according to the definitions of the motor examination part of the UPDRS. They also rated dyskinesia and overall mobility according to treatment response scale (TRS).
A temporal irregularity score (TIS) was developed using an approximate entropy method which was used to measure the repeatability of patterns within the drawing speed signals of the spiral drawings. To be able to do a comparable analysis with groups of patients in ST1, three groups of patients were defined based on the Hoehn and Yahr scale (Goetz, et al., 2004).
The significance of the mean TIS across the four subject groups of healthy, early, intermediate and advanced patients was investigated. To evaluate the consistency of the TIS, test-retest reliability of the TIS was measured. The ability to detect the change from baseline (before medication) to follow up time points when patients were on medication, was assessed. To investigate the relation between TIS and specialists’ visual assessments the correlations between TIS and clinical rating scores were assessed.
The results in the paper indicate that the mean TIS was significantly different between healthy subjects, and all other groups of early, intermediate and advanced patients. There was a good test-retest reliability (ICC = 0.81) indicating the consistency of the three extracted TIS. It can be observed in the results that TIS was worsening with increased disease severity. In addition, in this study, the sensitivity of TIS to the treatment response during single dose experiments from before to 300 minutes after dose intake, were calculated. The sensitivity results could not be comparable to the sensitivity results in ST1 due to the differences in the study designs. However, the effect sizes were related to changes in patients’ symptoms throughout the continuous tests which were performed during the day. The scores were small but could
8
capture some effects of medication that were presented in patients’ performances. For healthy subjects, the effect sizes were smaller than the effect sizes of patients. As an additional investigation, the correlations between TIS and mean clinical rating scores (UPDRS, TRS, Dys) were weak. A reason could be that TIS was related to temporal fluctuations during spiral drawing. This could be related to the fact that ApEn technique provided a high resolution of a signal by partitioning it into a smaller set of windows and sliding the windows throughout the signal. This enables the TIS to measure high-frequency irregularities in spiral drawing speed in the order of milliseconds where visual assessment of these irregularities cannot be detected.
As a conclusion, the results of this study as well as in ST1 showed that TIS was more related to disease severity than the clinical ratings. It indicates it might be more useful in long-term diagnostic tools than for detecting the treatment response. It also introduces a possibility that TIS might be related to Basal ganglia oscillations. However, to specifically be able to demonstrate the possible correlations between TIS and pathological oscillations there is a need for further investigations. DaT SPECT (Scherfler, et al., 2007) as a tool to determine the degeneration of the presynaptic neurons in the striatum of patients with PD could be used to investigate whether there is a relation between the number of dopamine receptors and TIS in future studies. In addition, the investigation of TIS properties on spiral data of patients with DBS therapy would also be of interest since the BG oscillations are affected by DBS treatment frequencies (Da Cunha, et al., 2015).
Conclusions and future work
In this licentiate thesis, several steps of microdata analysis (from data collection to reporting the results) were taken. Each step individually was considered as important in order to achieve correct results. However, the thesis focuses on data analysis. Microdata analysis as a multidisciplinary area comprise fields such as decision support systems, AI, data modeling, simulation, statistical inference, and optimization techniques that were considered as important in achieving the research goals.
Through reviewing the state of the art and measures in the first paper the potentials about motor symptoms and their assessments were observed. Best sensor systems, more suitable methods and possible measures in order to assess the symptoms were explored. Various combinations of sensor systems, as well as methodologies, could be examined to expand the research in the field of PD motor symptom assessment. Machine learning techniques were found as suitable solutions in the development of assessment systems. Therefore it motivated the data-driven machine learning approach in the next study. In the view of recent technologies, the tapping and spiral tests were combined to examine whether their combination could be used to quantify dexterity in PD. Results from combined tapping and spiral drawing tests of smartphone suggested that this combination can be useful in detecting changes in motor symptoms related to treatments. Since the development of new treatment strategies mainly depends on the clinical information derived from rating scales, there was a limitation with regard to inter-rater variability in this thesis. Even though the specialists used scoring guidelines, the analysis from rating agreements showed that there was a weak agreement between raters. Meanwhile, the temporal irregularity score calculated for the drawing speed during spiral tests found to be useful in long term diagnosis. Even though it would be interesting to investigate the TIS properties after including more patients’ data from different stages of medication (and even DBS therapy) and data from patients from various years of treatment.
9
The research is ongoing to further discover the properties of methods. The aim is to expand PD symptom assessment with including more sensor data i.e. gait data, hand movements data and etc. As has been mentioned, the overall goal of the project is to come up with a sensor index platform where all the sensor indexes are integrated and linked to PD motor symptoms and treatment.
Acknowledgments
The studies are performed in the framework of the FLOAT and MUSYQ projects, funded by Swedish knowledge foundation and Swedish innovation agency (Vinnova), in collaboration with Cenvigo AB, Sensidose AB, Swedish ICT Acreo, Uppsala University, Sahlgrenska University, and Dalarna University. I would like to thank all my supervisors and colleagues who helped and supported me in learning and perusing this research.
References
Arora, S., Venkataraman, V., Zhan, A., Donohue, S., Biglan, K. M., Dorsey, E. R., et al. (2015). Detecting and monitoring the symptoms of Parkinson's disease using smartphones: A pilot study. Parkinsonism & Related Disorders, 21(6), 650-653.
Buhusi, C. V., & Meck, W. H. (2005). What makes us tick? Functional and neural mechanisms of interval timing. Nat Rev Neurosci, 6(10), 755-765. doi: 10.1038/nrn1764
Coull, J. T., Cheng, R. K., & Meck, W. H. (2011). Neuroanatomical and neurochemical substrates of timing. Neuropsychopharmacology, 36(1), 3-25. doi: 10.1038/npp.2010.113
Da Cunha, C., Boschen, S. L., Gomez-Aa, A., Ross, E. K., Gibson, W. S. J., Min, H. K., et al. (2015). Toward sophisticated basal ganglia neuromodulation: Review on basal ganglia deep brain stimulation. Neuroscience and Biobehavioral Reviews, 58, 186-210. doi: 10.1016/j.neubiorev.2015.02.003
Fahn, S., & Elton, R. L. (1987). Unified Parkinson’s Disease Rating Scale—Recent Developments in Parkinson’s Disease. Macmillan Health Care Information, Florham Park, NJ. , 2(15), 3-163, 293-304. Giovannoni, G., van Schalkwyk, J., Fritz, V. U., & Lees, A. J. (1999). Bradykinesia akinesia inco-ordination
test (BRAIN TEST): an objective computerised assessment of upper limb motor function. Journal of neurology, neurosurgery, and psychiatry, 67(5), 624-629.
Goetz, C. G., Poewe, W., Rascol, O., Sampaio, C., Stebbins, G. T., Counsell, C., et al. (2004). Movement disorder society task force report on the Hoehn and Yahr staging scale: Status and recommendations. Movement Disorders, 19(9), 1020-1028. doi: 10.1002/mds.20213
Haubenberger, D., Kalowitz, D., Nahab, F. B., Toro, C., Ippolito, D., Luckenbaugh, D. A., et al. (2011). Validation of digital spiral analysis as outcome parameter for clinical trials in essential tremor. Mov Disord, 26(11), 2073-2080. doi: 10.1002/mds.23808
Heldman, D. A., Espay, A. J., LeWitt, P. A., & Giuffrida, J. P. (2014). Clinician versus machine: reliability and responsiveness of motor endpoints in Parkinson's disease. Parkinsonism & related disorders, 20(6), 590-595.
10
Isacson, D., Bingefors, K., Kristiansen, I. S., & Nyholm, D. (2008). Fluctuating functions related to quality of life in advanced Parkinson disease: effects of duodenal levodopa infusion. Acta Neurologica Scandinavica, 118(6), 379-386. doi: 10.1111/j.1600-0404.2008.01049.x
Kurz, M. J., & Hou, J. G. (2010). Levodopa influences the regularity of the ankle joint kinematics in individuals with Parkinson's disease. J Comput Neurosci, 28(1), 131-136. doi: 10.1007/s10827-009-0192-0
Liu, X., Carroll, C. B., Wang, S.-Y., Zajicek, J., & Bain, P. G. (2005). Quantifying drug-induced dyskinesias in the arms using digitised spiral-drawing tasks. Journal of neuroscience methods, 144(1), 47-52. Lopane, G., Mellone, S., Chiari, L., Cortelli, P., Calandra-Buonaura, G., & Contin, M. (2015). Dyskinesia
detection and monitoring by a single sensor in patients with Parkinson's disease. Mov Disord. doi: 10.1002/mds.26313
Mariani, B., Hoskovec, C., Rochat, S., Bula, C., Penders, J., & Aminian, K. (2010). 3D gait assessment in young and elderly subjects using foot-worn inertial sensors. Journal of biomechanics, 43(15), 2999-3006.
Memedi, M., Aghanavesi, S., & Westin, J. (2016). A method for measuring Parkinson's disease related temporal irregularity in spiral drawings. 2016 3rd Ieee Embs International Conference on Biomedical and Health Informatics, 410-413.
Mohammadi-Abdar, H., Ridgel, A. L., Discenzo, F. M., Phillips, R. S., Walter, B. L., & Loparo, K. A. (2016). Test and Validation of a Smart Exercise Bike for Motor Rehabilitation in Individuals With Parkinson's Disease. IEEE Trans Neural Syst Rehabil Eng, 24(11), 1254-1264. doi: 10.1109/TNSRE.2016.2549030
Morrison, S., Cortes, N., Newell, K. M., Silburn, P. A., & Kerr, G. (2013). Variability, regularity and coupling measures distinguish PD tremor from voluntary 5Hz tremor. Neurosci Lett, 534, 69-74. doi: 10.1016/j.neulet.2012.11.040
Pincus, S. M., Gladstone, I. M., & Ehrenkranz, R. A. (1991). A regularity statistic for medical data analysis. J Clin Monit, 7(4), 335-345.
Powell, D. W., Muthumani, A., & Xia, R. P. (2014). Parkinson's Disease is Associated With Greater Regularity of Repetitive Voluntary Movements. Motor Control, 18(3), 263-277. doi: 10.1123/mc.2013-0025
Raz, A., Frechter-Mazar, V., Feingold, A., Abeles, M., Vaadia, E., & Bergman, H. (2001). Activity of pallidal and striatal tonically active neurons is correlated in MPTP-treated monkeys but not in normal monkeys. Journal of Neuroscience, 21(3).
Sama, A., Perez-Lopez, C., Romagosa, J., Rodriguez-Martin, D., Catala, A., Cabestany, J., et al. (2012). Dyskinesia and motor state detection in Parkinson's disease patients with a single movement sensor. Conference proceedings : Annual International Conference of the IEEE Engineering in Medicine and Biology Society IEEE Engineering in Medicine and Biology Society Annual Conference, 2012, 1194-1197.
Saunders-Pullman, R., Derby, C., Stanley, K., Floyd, A., Bressman, S., Lipton, R. B., et al. (2008). Validity of spiral analysis in early Parkinson's disease. Mov Disord, 23(4), 531-537. doi: 10.1002/mds.21874 Scherfler, C., Schwarz, J., Antonini, A., Grosset, D., Valldeoriola, F., Marek, K., et al. (2007). Role of
DAT-SPECT in the diagnostic work up of Parkinsonism. Movement Disorders, 22(9), 1229-1238. doi: 10.1002/mds.21505
Shima, K., Tamura, Y., Tsuji, T., Kandori, A., Yokoe, M., & Sakoda, S. (2009). Estimation of human finger tapping forces based on a fingerpad-stiffness model. Conference proceedings : Annual International
11
Conference of the IEEE Engineering in Medicine and Biology Society IEEE Engineering in Medicine and Biology Society Annual Conference, 2009, 2663-2667.
Westin, J., Dougherty, M., Nyholm, D., & Groth, T. (2010). A home environment test battery for status assessment in patients with advanced Parkinson's disease. Computer methods and programs in biomedicine, 98(1), 27-35.
Westin, J., Ghiamati, S., Memedi, M., Nyholm, D., Johansson, A., Dougherty, M., et al. (2010a). A new computer method for assessing drawing impairment in Parkinson's disease. J Neurosci Methods, 190(1), 143-148. doi: 10.1016/j.jneumeth.2010.04.027
Yeung, L. F., Cheng, K. C., Fong, C. H., Lee, W. C. C., & Tong, K.-Y. (2014). Evaluation of the Microsoft Kinect as a clinical assessment tool of body sway. Gait & posture, 40(4), 532-538.
Yuvaraj, R., & Murugappan, M. (2016). Hemispheric asymmetry non-linear analysis of EEG during emotional responses from idiopathic Parkinson's disease patients. Cogn Neurodyn, 10(3), 225-234. doi: 10.1007/s11571-016-9375-3
12
Paper I
13
A review of Parkinson’s disease cardinal and dyskinetic motor
symptoms assessment methods using sensor systems
Somayeh Aghanavesi, Jerker Westin
Dalarna University, Computer Science Department, Rodavagen 3, S78188 Borlänge, SWEDEN
saa,jwe@du.se
Abstract. This paper is reviewing objective assessments of Parkinson’s disease (PD) motor symptoms, cardinal, and dyskinesia, using sensor systems. It surveys the manifestation of PD symptoms, sensors that were used for their detection, types of signals (measures) as well as their signal processing (data analysis) methods. A summary of this review’s finding is represented in a table including devices (sensors), measures and methods that were used in each reviewed motor symptom assessment study. In the gathered studies among sensors, accelerometers and touch screen devices are the most widely used to detect PD symptoms and among symptoms, bradykinesia and tremor were found to be mostly evaluated. In general, machine learning methods are potentially promising for this. PD is a complex disease that requires continuous monitoring and multidimensional symptom analysis. Combining existing technologies to develop new sensor platforms may assist in assessing the overall symptom profile more accurately to develop useful tools towards supporting better treatment process.
Keywords: Parkinson’s disease; sensors; objective assessment; motor symptoms; machine learning; dyskinesia; bradykinesia; Rigidity; tremor.
1 Introduction
The number of studies using electronic healthcare technologies and sensor systems assessing the Parkinson’s disease (PD) motor symptoms objectively are increasing. PD is a progressive neurological disorder characterized by a large number of motor symptoms that can impact on the function to a variable degree. The four cardinal motor symptoms of PD comprise of tremor, rigidity, bradykinesia and postural instability. The primary goal of therapy is to maintain good motor function. Therefore therapeutic decision making requires accurate, comprehensive and accessible quantification of symptoms. Electronic sensor-based systems can facilitate remote, long-term and repeated symptom assessments. They are able to capture the symptom fluctuations more accurately and also they are effective with patient’s hospitalization costs. This paper reviews methods and sensor systems to detect, assess and quantify the four cardinal and dyskinetic motor symptoms. The method for identifying and accessing resources involved the online databases, Google Scholar, IEEE computer society, Springer link (Springer Netherlands) and PubMed central. The evaluation of resources was based on their relevance to the topic and the year of publication (not older than 2005). Selection of articles is done to have one reference per instrument that was used to detect all our addressed symptoms. The structure of this article is formed into sections of PD symptoms, followed by corresponding sensors and instruments, and computer and statistical methods that were employed for assessments.
14
2 Parkinson’s disease cardinal and dyskinetic symptoms
Parkinson’s tremor consists of oscillating movements and appears when a person's muscles are relaxed and disappears when the person starts an action. It’s the most apparent well-known symptom. Rigidity symptoms cause stiffness of the limbs, neck or trunk and result in inflexibility. Bradykinesia (slow movement) describes the general reduction of spontaneous movement (abnormal stillness and a decrease in facial expressivity) and causes difficulties with repetitive movements. It can cause walking with short and shuffling steps and can also affect the speech. Postural instability symptom is a trend to be unstable when standing upright, rising from a chair or turning. And dyskinesia is a difficulty in performing voluntary movements, which often occurs as a side effect of long-term therapy with levodopa. Dyskinetic movements look like smooth tics (uncoordinated periodic moves).
3 Sensors, signals and measures
Among the developed electronic techniques to measure and analyze the PD’s symptoms the common sensors and devices for evaluation are accelerometer, electromyograph (EMG), magnetic tracker system, gyroscope, digitizing tablet, video recording, motion detector, and depth sensor. In accelerometry, an electromechanical sensor device is used to measure acceleration forces and capture the movements by converting it into electrical signals that are proportional to the muscular force producing motion. Gyroscope is a sensor device used to measure angular velocity (angular rate) which senses rotational motion and changes in orientation (Salarian, et al., 2007). Accelerometer and gyroscope are joint in many motion sensing instruments. Electromyography (EMG) is a technique for evaluating and recording the electrical activity produced by neurologically activated muscles using Electromyograph that records how fast nerves can send electrical signals. Digitizing tablet in PD symptom detection is a computer input device used to digitize patient’s drawing when he/she traces a pre-drawn shape (X. Liu, et al., 2005), (Westin, Ghiamati, et al., 2010) or freely writes or draws a shape. The position of the tip of the pen (x, y) and the time (milliseconds) are collected for analysis (Westin, Ghiamati, et al., 2010). Electromagnetic tracker system captures the object’s movement displacement (x, y, and z) and orientation (pitch, roll, and yaw). Active optical marker systems are used to capture and record object’s motion. Wired position markers can be placed on different locations of patient’s body to obtain object’s posture and movements.
4 Signal processing and analysis
Wavelet transform as a multi-resolution transformation method uses a variable window size at each level to obtain more information about the sensor signal in the time-frequency (time-scale) domain. Principal component analysis (PCA) is theoretically the best linear dimension reduction technique that uses rectangular transformation to convert the set of observations of possibly correlated variables into a set of values of linearly uncorrelated variables [3]. It’s the direction to where the most variance exists. Wavelet transform is usually used with PCA to reduce the number of features to most important and related ones [3]. Discrete Fourier Transform converts samples of a function (a signal that varies over time) into the list of coefficients of a finite combination of complex sinusoids (ordered frequency that has sample value). Fast Fourier transform converts time (signal) to frequency by decomposing an N point time domain signal into N signals (Westin, Dougherty, et al., 2010) and Detrended Fluctuation Analysis is a method to determine
self-15
affection of a signal (Arora, et al., 2015b). Often Spectral Analysis (SA) is used in signal processing for PD’s motor symptom assessment. The magnitude of an input signal versus a certain frequency within the full range of the frequency is measured using a spectrum analyzer. Artificial Intelligence (Visual perception, decision making, image processing, and classification techniques) enables the development of computer systems to perform tasks that usually require human intelligence. For image processing, computer vision is a method to acquire, process and analyze a patient body’s images (like face and body posture). Machine learning in PD symptom assessment (Sama, et al., 2012) often includes techniques to assess the magnitude of addressed symptom. Linear discriminant analysis (LDA) classification method is used to optimally separate populations and reduce the dimensionality (Lopane, et al., 2015), (Adkin, et al., 2005). Non-parametric, generalized and multilayer perceptron analysis are different alternatives of LDA.
5 Discussion and conclusion
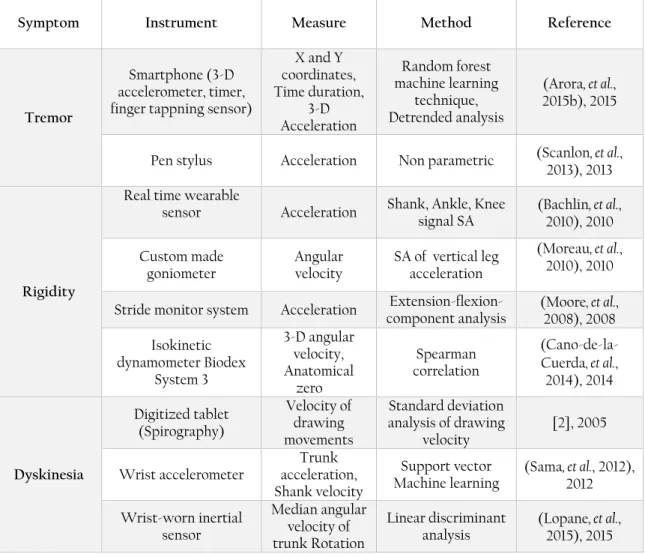
Table 1 summarizes the research studies that have evaluated the four cardinal PD motor symptoms. From left to right, it lists the evaluated symptoms, type of the instruments, calculated measures and employed analytical assessment methods.
Table 1. An overview of research studies articles that objectively assess PD motor symptoms and dyskinesia (Spectral Analysis is abbreviated as SA, and three dimension as 3-D).
Symptom Instrument Measure Method Reference
Tremor
Smartphone (3-D accelerometer, timer, finger tappning sensor)
X and Y coordinates, Time duration, 3-D Acceleration Random forest machine learning technique, Detrended analysis (Arora, et al., 2015b), 2015
Pen stylus Acceleration Non parametric (Scanlon2013), 2013 , et al.,
Rigidity
Real time wearable
sensor Acceleration Shank, Ankle, Knee signal SA (Bachlin2010), 2010 , et al.,
Custom made
goniometer Angular velocity SA of vertical leg acceleration
(Moreau, et al.,
2010), 2010 Stride monitor system Acceleration component analysis Extension-flexion- (Moore2008), 2008 , et al.,
Isokinetic dynamometer Biodex System 3 3-D angular velocity, Anatomical zero Spearman correlation (Cano-de-la-Cuerda, et al., 2014), 2014 Dyskinesia Digitized tablet (Spirography) Velocity of drawing movements Standard deviation analysis of drawing velocity [2], 2005
Wrist accelerometer acceleration, Trunk Shank velocity
Support vector
Machine learning (Sama, et al., 2012), 2012 Wrist-worn inertial sensor Median angular velocity of trunk Rotation Linear discriminant
16 Postural instability MTX Xsens sensor with 3-D accelerometer and 3-D gyroscope Acceleration, Direction and Distance Antero-posterior (AP), Medio-lateral (ML), and Vertical directions analysis (Mancini, et al., 2011), 2011 Motion detector, Depth sensor, Vicon, motion capture system
and Force plate
Ground reaction force, Body center of mass, Displacement, Velocity Segmental method, Zero-point-to-zero-point integration technique (Yeung, et al., 2014), 2014 Digital angular- velocity transducer Velocity (pitch, roll, angle), Time Linear discriminant
analysis, Anova (Adkin2005), 2005 , et al.,
Accelerometer Acceleration contextualization Posture algorithm (Ahlrichs, et al., 2016), 2014 Tremor and Dyskinesia Accelerometer, Gyroscope, Infrared camera Acceleration, Angular velocity and time Genetic Algorithm spectral classification [20], 2014 Tremor and
Bradykinesia Miniature uni-axial gyroscope
Angular velocity in roll,
yaw and pitch direction Biomedical signal processing (Spectrum Analysis) (Salarian, et al., 2007) , 2007 Tremor and Postural instability Accelerometer Mean velocity, Acceleration range, Mean acceleration Hilbert–Huang transformation of postural parameters (Mellone, et al., 2011), 2011 Bradykinesia and Dyskinesia
Digitized tablet (spiral and tapping) Pocket PC device Radius, Time, Mean speed of correct proportion of taps Wavelet transform and principal component analysis (Westin, Ghiamati, et al., 2010), 2010 Ambulatory Multichannel accelerometer, Video recorder Acceleration, Body position, Time, Gravitational force, Body segment angel Direct current component, Discriminant, variance (Anova), regression analysis (Dunnewold, et al., 1998), 2005 Kinetigraph(3-D accelerometer) Time period, Wrist acceleration Expert system
approach (Griffiths2012), 2012 , et al.,
Rigidity, Bradykinesia
and Dyskinesia
Digitized tablet with finger tapping and
Spirography Speed, Accuracy, Standard deviation of radial drawing velocity Principal component analysis (Westin, Dougherty, et al., 2010), 2010
According to table 1, rigidity and postural instability are mostly evaluated as single symptoms. However, among articles which research on combined symptoms assessments, bradykinesia (with tremor, dyskinesia, rigidity, and dyskinesia together) is mostly studied. Tremor is assessed in some studies as a single symptom, and also together with each of bradykinesia, dyskinesia, and postural instability symptoms.
17
A common sensor for symptom detection was the accelerometer that was mostly used for detecting the tremor, dyskinesia, and postural instability. Digitizing tablet is used almost for all types of symptoms. Smartphone (Arora, et al., 2015b) and Microsoft Kinect (motion detector, and depth sensor) (Yeung, et al., 2014) are the latest devices in the market used for this. Smartphones (new generation of sensing devices) could expand rapidly with PD motor symptom assessments. Angular sensor detectors are used to detect rigidity and postural instability as single symptoms, and they are also used to detect bradykinesia and dyskinesia together with tremor. Video recording is often required for clinicians’ observational analysis. Wearable sensors (small, available, accurate, including high-resolution activity data, and flexible with body locations) are preferred for PD since it’s a progressive chronic disease and symptoms need to be assessed continuously throughout the day. For this, the mobile applications and wrist watches are more preferred as they are currently part of almost everyone’s daily accessories. However, their analysis methods and their validations are important and a question is whether the devices or clinical ratings will become the gold standard. Machine learning techniques are potentially good solutions in the development of assessment systems to determine the effectiveness of drug dosing. Tools that can effectively characterize the severity of symptoms and can discriminate between bradykinesia and dyskinesia are needed. Some successful products are Parkinson’s Kinetigraph (Dunnewold, et al., 1998) , Kinesia devices (Mera, et al., 2012), and Rempark (Sama, et al., 2012).
References
1. Salarian, A., et al., Quantification of tremor and bradykinesia in Parkinson's disease using a novel ambulatory monitoring system. IEEE Trans Biomed Eng, 2007. 54(2): p. 313-22.
2. Liu, X., et al., Quantifying drug-induced dyskinesias in the arms using digitised spiral-drawing tasks. Journal of neuroscience methods, 2005. 144(1): p. 47-52.
3. Westin, J., et al., A new computer method for assessing drawing impairment in Parkinson's disease. Journal of neuroscience methods, 2010. 190(1): p. 143-8.
4. Westin, J., et al., A home environment test battery for status assessment in patients with advanced Parkinson's disease. Computer methods and programs in biomedicine, 2010. 98(1): p. 27-35.
5. Arora, S., et al., Detecting and monitoring the symptoms of Parkinson's disease using smartphones: A pilot study. Parkinsonism & Related Disorders, 2015. 21(6): p. 650-653.
6. Sama, A., et al., Dyskinesia and motor state detection in Parkinson's disease patients with a single movement sensor. Conference proceedings : Annual International Conference of the IEEE Engineering in Medicine and Biology Society IEEE Engineering in Medicine and Biology Society Annual Conference, 2012. 2012:
p. 1194-7.
7. Lopane, G., et al., Dyskinesia detection and monitoring by a single sensor in patients with Parkinson's disease. Mov Disord, 2015.
8. Adkin, A.L., B.R. Bloem, and J.H.J. Allum, Trunk sway measurements during stance and gait tasks in Parkinson's disease. Gait & Posture, 2005. 22(3): p. 240-249.
9. Scanlon, B.K., et al., An accelerometry-based study of lower and upper limb tremor in Parkinson's disease. Journal of Clinical Neuroscience, 2013. 20(6): p. 827-830.
10. Bachlin, M., et al., A wearable system to assist walking of Parkinson s disease patients. Methods of information in medicine, 2010. 49(1): p. 88-95.
11. Moreau, C., et al., [Gait disorders in Parkinson's disease: and pathophysiological approaches]. Rev Neurol (Paris), 2010. 166(2): p. 158-67.
12. Moore, S.T., H.G. MacDougall, and W.G. Ondo, Ambulatory monitoring of freezing of gait in Parkinson's disease. J Neurosci Methods, 2008. 167(2): p. 340-8.
18
13. Cano-de-la-Cuerda, R., et al., Isokinetic dynamometry as a technologic assessment tool for trunk rigidity in Parkinson's disease patients. NeuroRehabilitation, 2014. 35(3): p. 493-501.
14. Mancini, M., et al., Trunk accelerometry reveals postural instability in untreated Parkinson's disease. Parkinsonism Relat Disord, 2011. 17(7): p. 557-62.
15. Yeung, L.F., et al., Evaluation of the Microsoft Kinect as a clinical assessment tool of body sway. Gait & posture, 2014. 40(4): p. 532-8.
16. Ahlrichs, C., et al., Detecting freezing of gait with a tri-axial accelerometer in Parkinson's disease patients. Med Biol Eng Comput, 2016. 54(1): p. 223-33.
17. Mellone, S., et al., Hilbert-Huang-based tremor removal to assess postural properties from accelerometers. IEEE transactions on bio-medical engineering, 2011. 58(6): p. 1752-61.
18. Dunnewold, R.J., et al., Ambulatory quantitative assessment of body position, bradykinesia, and hypokinesia in Parkinson's disease. J Clin Neurophysiol, 1998. 15(3): p. 235-42.
19. Griffiths, R.I., et al., Automated assessment of bradykinesia and dyskinesia in Parkinson's disease. J Parkinsons Dis, 2012. 2(1): p. 47-55.
20. Mera, T.O., et al., Feasibility of home-based automated Parkinson's disease motor assessment. J Neurosci Methods, 2012. 203(1): p. 152-6.
19
Paper II
20
A smartphone-based system to quantify dexterity in
Parkinson’s disease patients
Somayeh Aghanavesi1, Dag Nyholm2, Marina Senek2, Filip Bergquist3, Mevludin Memedi1,4,* 1 Computer Engineering, School of Technology and Business Studies, Dalarna University
2 Dept. of Neuroscience, Neurology, Uppsala University 3 Dept. of Pharmacology, University of Gothenburg 4 Informatics, Business School, Örebro University
*Author to whom correspondence should be addressed: Email: mevludin.memedi@oru.se; Tel.: +46-19 303 478;
Abstract
Objectives: The aim of this paper is to investigate whether a smartphone-based system can be used to quantify dexterity in Parkinson’s disease (PD). More specifically, the aim was to develop data-driven methods to quantify and characterize dexterity in PD.
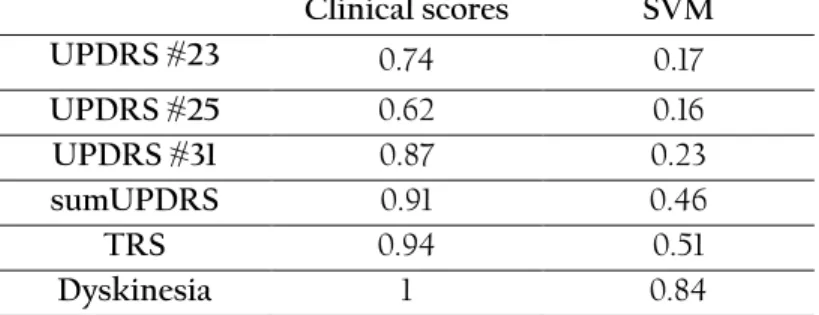
Methods: Nineteen advanced PD patients and 22 healthy controls participated in a clinical trial in Uppsala, Sweden. The subjects were asked to perform tapping and spiral drawing tests using a smartphone. Patients performed the tests before, and at pre-specified time points after they received 150% of their usual levodopa morning dose. Patients were video recorded and their motor symptoms were assessed by three movement disorder specialists using three Unified PD Rating Scale (UPDRS) motor items from part III, the dyskinesia scoring and the treatment response scale (TRS). The raw tapping and spiral data were processed and analyzed with time series analysis techniques to extract 37 spatiotemporal features. For each of the five scales, separate machine learning models were built and tested by using principal components of the features as predictors and mean ratings of the three specialists as target variables.
Results: There were weak to moderate correlations between smartphone-based scores and mean ratings of UPDRS item #23 (0.52; finger tapping), UPDRS #25 (0.47; rapid alternating movements of hands), UPDRS #31 (0.57; body bradykinesia and hypokinesia), sum of the three UPDRS items (0.46), dyskinesia (0.64), and TRS (0.59). When assessing the test-retest reliability of the scores it was found that, in general, the clinical scores had better test-retest reliability than the smartphone-based scores. Only the smartphone-based predicted scores on the TRS and dyskinesia scales had good repeatability with intra-class correlation coefficients of 0.51 and 0.84, respectively. Clinician-based scores had higher effect sizes than smartphone-based scores indicating a better responsiveness in detecting changes in relation to treatment interventions. However, the first principal component of the 37 features was able to capture changes throughout the levodopa cycle and had trends similar to the clinical TRS and dyskinesia scales. Smartphone-based scores differed significantly between patients and healthy controls.
Conclusions: Quantifying PD motor symptoms via instrumented, dexterity tests employed in a smartphone is feasible and data from such tests can also be used for measuring treatment-related changes in patients.
Keywords: Parkinson’s disease; motor assessment; spiral tests; tapping tests; smartphone; dyskinesia; bradykinesia; objective measures; telemedicine
21
1. Introduction
Parkinson’s disease (PD) is the second most common neurodegenerative disorder (Shin et al., 2016) and is characterized by degeneration of dopaminergic neurons in the substantia nigra. A common treatment for PD is levodopa. Over the course of the disease, levodopa dose and timing of intake have to be adjusted to optimize the therapeutic effect (Schapira, 2009). PD is a multidimensional, progressive disease and patients have different symptom profiles, which makes it difficult for healthcare professionals and patients themselves to assess and manage PD symptoms. From the clinical point of view, it is challenging to remotely and frequently determine the current motor state of the patient to determine whether the patient is under-medicated (a state in which the PD motor symptoms such as bradykinesia, tremor, rigidity, and others appear) or over-medicated (the appearance of hyper-kinetic movements related to excessive levels of medication). Therefore, assessing the current motor state of the patient is essential for deriving an optimal treatment strategy.
The current state of the art for assessing PD symptoms in clinical routine and studies is by using clinical rating scales based on observations and judgments of clinicians and medical history. The most commonly used clinical rating scale is the Unified PD Rating Scale (UPDRS) (Martínez-Martín et al., 1994), which is used to evaluate the presence, severity and progression of PD symptoms as well as symptom fluctuations. However, clinician-based measurements are not able to capture variations in symptoms on a day-to-day basis since they only reflect one brief point in time. To reveal the full extent of patients’ condition and prevent a recall and reporting bias, the motor symptoms need to be captured frequently, before and after medication (Isacson et al., 2008). Combining the elements of common rating scales with frequent self-assessments and objective tests can also help with covering more aspects of the disease than what can actually be obtained by clinical ratings alone.
Recent advances in information and communication technologies have enabled remote and continuous monitoring of motor symptoms (Maetzler et al., 2013). Previous studies have shown that such technologies provide accurate and valid objective assessment of symptoms. It was previously reported that they may assist in identifying motor functions (On, Off and dyskinesia) (Andong Zhan et al., 2016; Galli et al., 2014). The technology-based measures not only generate more valid endpoints for clinical studies but also can be useful in routine clinical care. There is a growing interest in investigating how useful the measures are when providing feedback to patients to increase their symptom and treatment outcome awareness (Bot et al., 2016).
From the technological point of view, data from different kinds of sensors during standardized tests and passive monitoring of physical activity have been previously analyzed and processed using signal processing and machine learning methods (Griffiths et al., 2012; Zeng et al., 2016). There are different studies with the focus on quantifying various motor symptoms. Some have focused on assessing motor dysfunctions in upper extremities (Heldman et al., 2014; Westin, et al., 2010), some on gross motor symptoms like gait (Mariani et al., 2010), while others on combination of both. For instance, Tsipouras et al. (2012) analyzed data from accelerometers and gyroscopes, which were placed on different parts of patients’ bodies with the aim of quantifying drug-induced involuntary movements or dyskinesia, using Fourier transform. A similar approach was employed by Salarian et al. (2007) to quantify bradykinesia and tremor. Other studies have focused on analyzing data from upper limbs during standardized tasks like