ADVANCED PERFLUORINATED ANION EXCHANGE MEMBRANE POLYMERS AND THEIR ISSUES IN ELECTROCHEMICAL CONVERSION DEVICES
By
© Copyright by Ashutosh G. Divekar, 2020 All rights reserved
ii
A thesis submitted to the Faculty and the Board of Trustees of the Colorado School of Mines in partial fulfillment of the requirements for the degree of Doctor of Philosophy (Chemical Engineering).
Golden, Colorado Date_____________________ Signed:____________________ Ashutosh G. Divekar Signed:____________________ Dr. Andrew M. Herring Thesis Advisor Golden, Colorado Date_______________________ Signed:_____________________ Dr. Anuj Chauhan Professor and Head Department of Chemical and Biological Engineering
iii
ABSTRACT
After decades of dedicated efforts in research and development of the polymer electrolyte membranes for electrochemical conversion devices, the technology is nearing their large-scale commercialization. Improvements like utilization of thin mechanically supported membranes (< 15 μm), advanced Pt catalysts with enhanced activity have made the proton-exchange membrane class of polymers very attractive for vehicular fuel cell and other electrochemical conversion applications. However, with the increasing energy demand for the rapidly growing population high performing commercial devices with non-precious catalysts need further attention. Anion exchange membrane polymers perfectly fit this description due to its compatibility with the cheaper electrochemical catalysts. In this work, the potential of novel perfluorinated anion exchange membranes primarily for low- temperature fuel cell applications were tested.
Three iterations of polymer membranes with a PTFE backbone were electrochemically, physiochemically, and morphologically characterized to conclude that the six-carbon alkyl spacer chain is the most promising candidate with a high ionic (OH-) conductivity. Ex-situ characterization of this class of polymers was performed to understand the interaction of the hydroxyl charge carrier with the atmospheric CO2 in the ambient air as in a commercial fuel cell device, ambient air is used as an oxidant. It was concluded that the CO2 not only interacts with the ionic domains of the polymer but also hampers the crystallinity of the backbone which could potentially lead to mechanical failures while operating for longer durations. From the knowledge gained from this study, a standard fuel cell device was tested to report the highest air-fed anion exchange membrane fuel cell performance to date (446 mW cm-2).
iv
For the first time, the segmented fuel cell hardware was used to understand the spatial differences in the anion exchange membrane fuel cell performance due to the variation in humidification, fuel or oxidant starvation and the durability issues. Over several days of operation, it was found that the cell degrades primarily in the feed inlet section due to difference in the hydration or water accumulation over the channel length. FTIR analysis was performed to prove that the chemical functionality of the membrane changes due to the fuel cell operation. The catalyst-ionomer interface was investigated using polymer dispersion spin-coated on model Si and Ag substrates. From the grazing incident x-ray scattering study, phenomenon like parallel polymer chain alignment with respect to the surface at a higher ionomer thickness and their variation with hydration and type of substrate was investigated. With increasing thickness, the film formation undergoes two transition regimes: formation of crystalline polymer domains followed by intra-molecular alignment of CF2 units within the polymer chain. It was also found that the silver surface is interacting strongly with the polymer. From the knowledge gained, it is recommended to design the catalyst inks with lower ionomer content so that the parallel alignment of the polymer chains is limited to mitigate the mass-transport limitations.
This work can serve as a guide to design higher performing catalyst inks, optimal conditions of water management, and ambient air operation to produce higher-performing fuel cell devices. However, learnings can also be applied to other electrochemical devices like water-splitting, electro-dialysis, CO2 reduction, and lead-air batteries. Understanding of the CO2 limitations from this work could also help in designing CO2 sequestration devices containing anion conducting ionic liquids.
v
TABLE OF CONTENTS
ABSTRACT.………...……….. iii
LIST OF FIGURES.………...……….………. ix
LIST OF TABLES.…………...………...………... xvi
LIST OF ACRONYMS.………..………..….…...………… xvii
ACKNOWLEDGEMENT..………...………..… xx
DEDICATION.………...………..……….……… xxii
CHAPTER 1 INTRODUCTION………...… 1
1.1 Energy and importance of H2………...…………..….………….…….. 1
1.2 Fuel cells current state-of-art…………...……….……….….………… 4
1.3 Anion-exchange membranes……….…………..………….……….… 7
1.4 Perfluorinated anion exchange membranes……….…..………. 9
1.5 Block polymer anion exchange membranes………..… 12
1.6 Carbon dioxide reaction with hydroxide………...……….. 15
1.7 Effect of air on physiochemical and electrochemical properties of AEMs……….…………..……… 20
1.8 Self-purging mechanism in AEMFC…..………….………….……… 22
1.9 CO2absorption theory……….……...……….………. 24
1.10 Segmented fuel cell………...….……….……….. 27
1.11 Catalyst ionomer interaction of thin-film polymers……….…...…… 35
1.12 Problem Statements………....….…………. 38
1.13 Thesis Statements……….……… 40
vi
CHAPTER 2 THE IMPACT OF ALKYL TRI-METHYL AMMONIUM
SIDE-CHAINS ON PERFLUORINATED IONIC MEMBRANES
FOR ELECTROCHEMICAL APPLICATIONS……….…….. 56
2.1 Motivation……….………….……….………. 56
2.2 Abstract………..…………....………. 57
2.3 Introduction……….…… 57
2.4 Experimental………..……….……… 62
2.5 Results and Discussion………. 71
2.6 Conclusions………...…. 87
2.7 Acknowledgements……… 88
2.8 References and Notes………...…… 89
CHAPTER 3 IN-DEPTH UNDERSTANDING OF THE CO2 LIMITATION OF AIR FED ANION EXCHANGE MEMBRANE FUEL CELLS……… 93
3.1 Abstract……… 93
3.2 Introduction………...….. 94
3.3 Experimental……….…………..… 98
3.4 Results and Discussion………...………… 104
3.5 Conclusions………..……… 119
3.6 Conflicts of interest………..…… 121
3.7 Acknowledgements………...……….. 121
3.8 Notes and references………..… 122
vii
CHAPTER 4 STUDY OF PERFORMANCE AND DEGRADATION IN
A PERFLUORINATED ANION EXCHANGE MEMBRANE FUEL CELL AS A FUNCTION OF HUMIDIFICATION,
STARVATION, AND CARBONATION EFFECTS……….…. 133
4.1 Introduction………..…. 133
4.2 Experimental details………...………….… 139
4.3 Results and Discussion………...… 141
4.4 Conclusions………..………… 152
4.5 Acknowledgements………...……….. 154
4.6 References……… 154
CHAPTER 5 A STUDY OF THIN-FILM POLYMER-CATALYST INTERFACIAL PROPERTIES OF A PERFLUORINATED ANION EXCHANGE MEMBRANE WITH VARIATION IN THICKNESS, HYDRATION, AND TYPE OF SUBSTRATE FOR ELECTROCHEMICAL APPLICATIONS………..……. 159
5.1 Introduction………...…… 159
5.2 Materials and Methods……… 163
5.3 Results and Discussion………...………… 165
5.4 Conclusions………..……… 182
5.5 Acknowledgements………...……….. 183
5.6 References……… 184
CHAPTER 6 CONCLUSIONS AND FUTURE RECOMMENDATIONS………..188
6.1 Conclusions………..…… 188
6.2 Future recommendations……… 193
viii
APPENDIX A KINETIC EQUILIBRIUM STUDY OF CO2 POISONING
OBSERVED IN ANION EXCHANGE MEMBRANES
WHEN EXPOSED TO AMBIENT AIR AND VARYING LEVELS
OF CO2 PPM……….……… 199
APPENDIX B GAUSSIAN OPTIMIZATION INPUT FILE OF
PFAEM_CH3_C6………..……….…. 208
ix
LIST OF FIGURES
Figure 1.1 Estimated U.S. Energy use in 2018 broken down by source
and sector………...….. 1
Figure 1.2 Incorporation of H2 in the energy production and utilization……….. 3
Figure 1.3 Effect of H2 at scale on the energy rejection……… 3
Figure 1.4 Effect of H2 at scale on the CO2 emissions……….. 4
Figure 1.5 A schematic representation of a proton exchange membrane fuel
cell (H2)……….. 6
Figure 1.6 Schematic representation of an anion exchange membrane fuel
cell (H2)………...……... 8
Figure 1.7 Anion conductivities reported in the literature for AEMs in the
past decade……….……..… 9
Figure 1.8 Concentration profile of OH-, CO32-, and HCO3- when OH- form
of A201 AEM is exposed to air……….. 17
Figure 1.9 Concentration profile of OH-, CO32-, HCO3- when OH- form
of radiation grafted AEM is exposed to air………..… 17
Figure 1.10 Concentration profile of a membrane immersed in N2 purged
DI water and then exposed to air……….. 19
Figure 1.11 Concentration profile of species in uncross-linked FAA-3 when
OH- form of AEM is exposed to air……….. 19
Figure 1.12 In-plane conductivity vs time when OH- form of
ETFE-g-PVBTMA AEM is exposed to air at 60 °C and 95%RH…. 21
Figure 1.13 Residual CO2 amount of CO32- anion in the membrane at each current density, in the case of clean air and ambient air………….. 24 Figure 1.14 Concentration profile for the carbonation of lime suspension……. 25
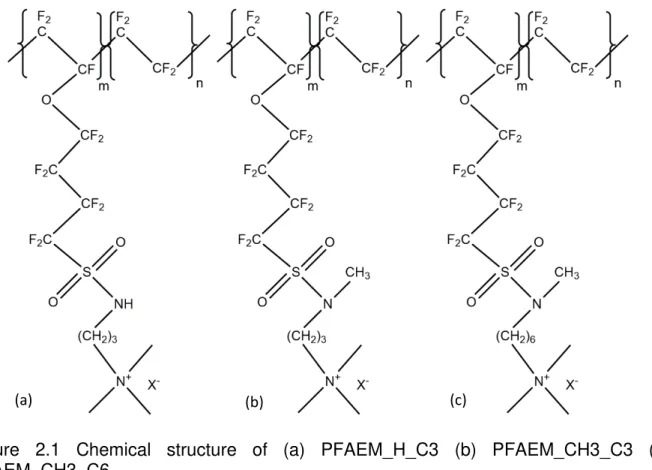
Figure 2.1 Chemical structure of (a) PFAEM_H_C3 (b) PFAEM_CH3_C3
(c) PFAEM_CH3_C6………. 60
Figure 2.2 Synthesis scheme of perfluorinated AEMs. PFAEM_H_C3:
R1 = H, x = 3; PFAEM_CH3_C3: R1 = CH3, x =3;
x
Figure 2.3 1H MAS-NMR spectra of the three polymers (a) PFAEM_H_C3,
(b) PFAEM_CH3_C3 and (c) PFAEM_CH3_C6, (d) λ vs %RH for
Cl- PFAEM_CH3_C3, Cl- PFAEM_CH3_C6 and OH-
PFAEM_CH3_C6 at 60 °C………..………. 73
Figure 2.4 (a) SAXS data of PFAEM_CH3_C3 and PFAEM_CH3_C6 in Cl-
form from dry to 95%RH at 60 °C (b) SAXS data of OH- form of PFAEM_CH3_C6 at 60 °C and dry to 95%RH (c) Annealing studies of PFAEM_CH3_C3 (Cl-) and PFAEM_CH3_C6 (Br-) heated to 220°C for 5 min and cooled down. (d) d-spacing vs λ of PFAEM_CH3_C3 Cl-, PFAEM_CH3_C6 Cl-, and
PFAEM_CH3_C6 OH-……….…………..… 78
Figure 2.5 Wide angle x-ray scattering data of OH- form of PFAEM_CH3_C6
at 60 °C and dry to 95%RH……….…………. 79
Figure 2.6 Conductivity of PFAEM_CH3_C3 and PFAEM_CH3_C6 in Cl-
and OH- form……….……….………. 80
Figure 2.7 (a) FTIR spectra of PFAEM_CH3_C3 and PFAEM_CH3_C6 in
the Cl- form under wet conditions. (b) FTIR spectra of
PFAEM_CH3_C6 equilibrated at 30 °C and 0, 25, 50, 75, and
95 %RH and wet spectrum………..…. 82
Figure 2.8 PFAEM_CH3_C6 molecule with Cl- counter-ion after geometry
and energy optimization using DFT………. 84
Figure 2.9 Peak assignment of PFAEM_CH3_C6 IR spectrum as per
DFT calculations………. 86
Figure 3.1 (a) Mass uptake for the membrane when it is exposed to ambient air at 60 °C and 85%RH containing 400 ppm CO2. (b) No. of water molecules per cation(λ) vs %RH for pure OH- and HCO3- form exposed to CO2 free N2 gas for 24 h (60 °C and 75%RH)
before testing the water content………. 104
Figure 3.2 Transient conductivity change when a pure OH- form of the
PFAEM is exposed to ambient air containing 400 ppm CO2 at 60 °C and (a) 75%RH or (b) 85%RH. (c) Transient change
in conductivity of the PFAEM at 60 °C and 75%RH when inlet gas is switched from compressed air (400 ppm CO2) to UHP N2 and
back to air again………..…. 106
Figure 3.3 Transient small angle x-ray scattering data of PFAEM
xi
(400 ppm CO2) at 60 °C and (a)50%, (b) 75%, and (c) 85%RH. Transient drop in intensity of the ionomer feature, q ~ 0.12 to 0.15 Å-1, for the membrane vs time at (d) 50%RH, (e) 75%RH, and (f) 85%RH when exposed to air containing 400 ppm CO2….. 107
Figure 3.4 Transient wide-angle x-ray scattering data of PFAEM
Equilibrated using UHP Ar and then exposed to compressed air (400 ppm CO2) at 60 °C and (a) 50%, (b) 75% and
(c) 85%RH. Gaussian fits of inter-chain feature observed at
(d) 50%, (e) 75%, and (f) 85%RH………..…… 111
Figure 3.5 Ion-exchange capacity and water content (λ) vs time of OH- charge carrier depletion for the PFAEM, a commercial
hydrocarbon AEM, Tokuyama A201, a radiation grafted ETFE AEM, and an uncross linked version of a second AEM, FAA-3…. 113
Figure 3.6 Schematic of carbon-dioxide absorption process and the down-
stream effects on the membrane……… 116
Figure 3.7 (a). Current density vs time when the fuel cell is switched from clean air (< 3 ppm CO2) to ambient air (400 ppm CO2) (b) Voltage vs current density and power vs current density of the
H2/O2, H2/clean air, and H2/ambient air………. 117 Figure 3.8 Transient drop in the intensity of the interchain CF2-CF2 spacing
feature, q =1.2 Å-1, for the membrane vs time at (a) 50%RH, (b) 75%RH, and (c) 85%RH when exposed to air containing 400
ppm CO2………..……. 127
Figure 3.9 Transient drop in the area of the gaussian features fit to the wide angle x-ray scattering data for the membrane observed at
q=1.1 Å-1, q=1.2 Å-1 and q=1.5 Å-1 at (a) 50%, (b) 75%, and
(c) 85%RH when exposed to air containing 400 ppm CO2………. 128 Figure 3.10 Transient change in the height of the Gaussian peaks, q =1.1,
1.2, and 1.5 Å-1 fit to the wide-angle x-ray scattering data for the membrane, at (a) 50 %RH, (b) 75%RH, and (c) 85%RH when exposed to air containing 400 ppm CO2. Transient change of the width of the gaussian peaks, q =1.1, 1.2, and 1.5 Å-1 fit to the wide-angle x-ray scattering data for the membrane at (d) 50%RH, (e) 75%RH, and (f) 85%RH when exposed to air
containing 400 ppm CO2………... 129
Figure 3.11 Ionic equilibrium of stock solution titration mixtures. (a) Data for titration of a stock solution containing only OH- ions (with 10% excess BaCl2 solution) vs titration of a stock solution containing
xii
only OH- ions without BaCl2. Equilibrium fraction of (b) OH-, (c) CO32-, and(d) HCO3- ions as evaluated from the titration vs the mixing fraction of OH-, CO32, and HCO3- ions in the stock
solution……….. 130
Figure 3.12 Species concentration profile of OH-, CO32- , and HCO3- in the membrane vs time of exposure to air containing 400 ppm CO2
at 60 °C and (a) 50%, (b) 75%, and (c) 85%RH……….……….… 131
Figure 3.13 Fuel cell data of PFAEM ionomer and membrane with Pt/C
loading of 0.485 mg/cm2, on each electrode, operated at 60 °C using H2/ Ambient air and 85%/85%RH at anode or cathode. (a) Stack resistance vs time when the fuel cell is switched from clean air to ambient air (b). Current density vs time when a fully air equilibrated fuel cell operated at voltages between OCV and 0.6V. (c). Stack resistance vs time when a fully air equilibrated fuel cell is operated at voltages between 0.5V and 0.2V.
(d) Current density vs time when a fully air equilibrated fuel cell
is operated at voltages between 0.5V and 0.2V……….…….. 132
Figure 4.1 (a) Anode or cathode operated at %RH = 100/100, 95/95, and
90/90 under H2/Air (< 3 ppm CO2) at a constant current of 10 A and cell temperature of 60 °C. (b) Anode/cathode operated at %RH = 85/85 & 80/80 under H2/Air (<3 ppm CO2) at a constant current of 2 & 1.5A respectively, cell temperature is 60 °C…..…. 141 Figure 4.2 Current density maps of the serpentine flow field data collected
at (a)100/100, (b) 95/95, (c) 90/90, (d) 85/85, and (e) 80/80%RH for anode or cathode compartment respectively. The cell
temperature is 60 °C and operated in the current control mode of 10A for 100, 95, and 90%RH; 2A for 85%RH and 1.5A for
80%RH……….……. 142
Figure 4.3 (a) Hydration variation on the cathode from 75%RH to 100%RH
with %RH, 100% at the anode. (b) Hydration variation on the anode from 75%RH to 100%RH with %RH, 100% at the
cathode………... 143
Figure 4.4 (a) Flow rate variation on the anode from 700 to 50 sccm with
flow rate, 2500 sccm at the cathode. (b) Flow rate variation on the cathode from 1500 to 100 sccm with flow rate, 1000 sccm at
the cathode………... 145
Figure 4.5 (a) Polarization curve of the overall cell voltage vs current density (A/cm2) at 100, 50, 25, and 5% H2 concentration diluted with N2. (b) The current distribution of cell performance at a
xiii
constant voltage of 0.5V along the segments from inlet to outlet at 100, 50, 25, and 5% H2 concentration diluted with N2.
(c) Polarization curve of the overall cell voltage vs current density (A/cm2) at 100, 50, 25, and 5% O2 concentration diluted with N2. (d) The current distribution of cell performance at a constant voltage of 0.5V along the segments from inlet to outlet at 100, 50, 25, and 5% O2 concentration diluted with N2…………. 146
Figure 4.6 (a) Current distribution at a constant voltage of 0.5V collected over a period for a cell operated at 60 °C, 100/100 %RH at
anode/cathode using pure H2/O2. (b) Fourier transform infra-red (FTIR) scan of pre-fuel cell test, post-fuel cell inlet,
and outlet segment samples……….. 148
Figure 4.7 Current distribution over time (a) 0, (b) 1, (c) 2.5, (d) 5, (e) 7.5, and (f) 10 minutes in a serpentine flow field segmented fuel cell switched to 400 ppm CO2 containing air at a constant voltage of 0.5V at 60 °C, 95/95 %RH at anode/cathode from H2/Air
(< 3 ppm CO2)………... 150
Figure 4.8 Current density vs time for segments: 1, 41, 81, and 121 when
the serpentine flow field segmented cell is (a) exposed to 400 ppm CO2 containing air from < 3 ppm CO2 air and (b) exposed to < 3 ppm CO2 air from fully 400 ppm CO2 containing air
equilibrated cell……….... 151
Figure 4.9 Current distribution over time (a) 0, (b) 25, (c) 75, (d) 100,
(e) 170, and (f) 780 minutes in a serpentine flow field segmented fuel cell switched to < 3 ppm CO2 containing air at a constant voltage of 0.5V at 60 °C, 95/95 %RH at anode/cathode from
H2/Air (400 ppm CO2) at time 0 min……….……. 152
Figure 5.1 Illustration of grazing-incidence small or wide angle x-ray
scattering technique……….... 165
Figure 5.2 The thin-film thickness of the PFAEM_CH3_C6 polymer cast
onto an (a) plain silicon substrate or a (b) silicon substrate
coated with Ag (3 Å)………... 166
Figure 5.3 2D GISAXS images of thin films coated on plain silicon
substrates, labeled with the film thickness obtained from
ellipsometry at ambient conditions……….... 167
Figure 5.4 2D GISAXS images of polymer thin films on Ag-coated silicon
substrates, labeled with the film thickness obtained from
xiv
Figure 5.5 Vertical line cut analysis of GISAXS data………... 168
Figure 5.6 Atomic force microscopy scans of thin films coated on plain Si: (a) 1μm x 1μm (Height trace), (b) 1μm x 1μm (Phase trace), (c) 120nm x 120nm (Height trace), (d) 120 nm x 120 nm (Phase trace); Ag/silicon: (e) 1 μm x 1 μm (Height trace), (f) 1 μm x 1μm (Phase trace), (g) 120 nm x 120 nm (Height trace),
(h) 120 nm x 120nm (Phase trace)……….... 170
Figure 5.7 GISAXS data of polymer thin films (concentrations: 0.5 and 1%)
spin-cast on substrates of plain silicon ((a), (b), and (c)) and silicon-coated with Ag ((d), (e), and (f)). The samples were equilibrated at 60 °C and dry conditions ((a) and (d)), 75% RH
((b) and (e)), 95% RH ((c) and (f))……….… 172
Figure 5.8 GISAXS data of thin films coated on top of plain silicon and exposed at 60 °C and (a) 0, (b) 75, and (c) 95% RH.
Horizontal (d) and vertical (e) line cuts of the respective data…… 173
Figure 5.9 GISAXS data of thin films coated on plain silicon and
Equilibrated at 60 °C and (a) 0, (b) 75, (c) 95% RH.
Horizontal (d) and vertical (e) line cuts of the respective data…… 175 Figure 5.10 GIWAXS data of plain Si coated with thin films from polymer
concentrations: (a) 0.125, (b) 0.25, (c) 1, (d) 1.88, (e) 2.5, (f) 3, (g) 5 % solution in n-pa water solvent at ambient conditions and
their vertical cuts (h)………. 177
Figure 5.11 GIWAXS data of polymer thin films on top of Ag coated silicon with concentrations: (a) 0.25, (b) 0.5, (c) 1, (d) 1.88, (e) 2.5, (f) 5 and (g) 7.5% polymer solution in npa-water solvent at ambient conditions and their vertical line cuts (h)………... 179 Figure 5.12 Schematic of the effect of thickness and hydration on the
ordering of polymer domains, inter-planar and intra-planar
ordering in thin films……….... 181
Figure 6.1 SAXS of PFAEM_CH3_C6 tethered with the imidazolium cation
at (a) 60 °C-dry and 95%RH; (b) Annealing of the polymer at
220 °C……….... 195
Figure 6.2 Process flow diagram of incorporating CO2 stripper before
AEMFC used for the stationary power applications………. 196
xv
Figure A.2 Chemical structure of PFAEM-Gen2 polymer………..…… 202
Figure A.3 Equilibrium species concentration of CO32- and HCO3- vs
temperature……….. 204
Figure A.4 Equilibrium species concentration of OH- vs CO2 ppm in a
sample environment……….... 205
Figure A.5 Equilibrium species concentration of HCO3- and CO32- vs CO2
xvi
LIST OF TABLES
Table 2.1 Previous work of synthesizing perfluorinated anion exchange
membranes………. 61
Table 2.2 Potassium weight % and % total side chains zwitterionic from
ESEM elemental analysis……….…….... 74
Table 2.3 Frequency (cm-1) and vibrational bond modes observed in the
DFT calculations………. 85
Table 3.1 Initial and equilibrium porod slope of SAXS data……….… 109
Table 3.2 Time constants of conductivity, ionomer feature intensity
(SAXS), and inter-chain feature intensity (WAXS) vs time of
exposure to air (400 ppm CO2)………... 110
Table 5.1 D-spacing of polymer feature (nm) observed by taking line cuts
horizontally and vertically for plain silicon and Ag/silicon
substrates………...….. 176
Table 5.2 D-spacing (Å) of inter-chain and intra-chain feature observed
in GIWAXS data of polymer thin films spin-coated on top of
xvii
LIST OF ACRONYMS PEMFCs: Proton exchange membrane fuel cells. AFC: Alkaline fuel cells.
PFSA: Perfluorinated sulfonic acid. AEMs: Anion exchange membranes.
AEMFCs: Anion exchange membrane fuel cell. ASU: 6-azonia-spiro[5.5]undecane.
DMP: N,N-dimethylpiperidinium. ASR: Area-specific resistance. TMA: Trimethylamine.
DABCO: Quaternized 1,4-diazobicyclo [2,2,2] octane. NMR: Nuclear magnetic resonance.
SAXS: small-angle x-ray scattering. KOH: Potassium hydroxide.
IEC: Ion exchange capacity.
SEM: Scanning transmission electron microscopy. VBTMA: Vinyl benzyl trimethyl ammonium.
TEM: Transmission electron microscopy. MPRD: Methyl piperidinium.
Na2CO3: Sodium bicarbonate. NaOH: Sodium hydroxide.
ETFE: Ethyl tetra-fluoroethylene. QCM: Quartz-crystal microbalance.
xviii
mA cm-2: milliamperes per centimeter. MEA: Membrane electrode assembly. GDL: Gas diffusion layer.
MPL: Microporous layer.
DMFC: Direct methanol fuel cell. PEFC: Polymer electrolyte fuel cell.
EIS: Electrochemical impedance spectroscopy. STR: Stirred tank reactor.
AFM: Atomic force microscopy. PTFE: Polytetrafluoroethylene.
PFAEM_H_C3: Perfluorinated anion exchange membrane with three carbon alkyl spacer chain without methylated imide.
PFAEM_CH3_C3: Perfluorinated anion exchange membrane with three carbon alkyl spacer chain and methylated imide.
PFAEM_CH3_C6: Perfluorinated anion exchange membrane with six carbon alkyl spacer chain and methylated imide.
DFT: Density Functional Theory. UHP: Ultra-high purity.
DVS: Dynamic Vapor Sorption.
ESEM: Environmental Scanning Electron Microscope. EDS: Energy Dispersive System.
AgNO3: Silver nitrate.
xix
PFAEM: Perfluorinated anion exchange membranes. WAXS: Wide-angle x-ray scattering.
GDE: Gas diffusion electrode. CCM: Catalyst coated membrane. SFC: Segmented fuel cell.
NREL: National Renewable Energy Laboratory. XRF: X-ray Fluorescence.
OTS: n-octyltrichlorosilane.
GISAXS: Grazing-incident small angle x-ray scattering. GIWAXS: Grazing-incident wide angle x-ray scattering. SiO2: Silicon dioxide.
SERS: Surface-enhanced Raman spectroscopy. PFAEM-Gen2: Same polymer as PFAEM_CH3_C6. Sccm: Standard cubic centimeters.
xx
ACKNOWLEDGEMENT
I want to express my heartfelt appreciation of Prof. Andrew M. Herring and Dr. Bryan S. Pivovar. Your guidance and constructive criticism was incredibly helpful throughout my PhD. I want to thank you both for continually supporting me through fellowship and allowing me to attend the US as well as international conferences. The work in this thesis was supported by the Department of Energy. Grant # DE-AC36-08GO28308. I would also like to acknowledge the consistent support of my old as well as existing lab colleagues at Colorado School of Mines: Himanshu Sarode, Tara Pandey, Ye Liu, James Horan, Vinh Nguyen, Mei-Chen Kuo, Andrew Motz, Nora Buggy, Lipin (Ivy) Wu, Isaac Alvarez, Ali Teymuri, ChulOong Kim (Chris). I would especially like to thank Andrew Motz for his support as a lab mentor as well as a hiking buddy.
At NREL, I would like to thank post-docs and staff scientists working in Bryan’s group: Ami C. Yang-Neyerlin, Derek Strasser, Christopher Antunes, Luigi Osmieri, Ellis Klein, Guido Bender and Doug. I would also like to thank the advanced facilities in Energy System Integration Facilities building at NREL.
This research used resources of the Advanced Photon Source, a U.S. Department of Energy (DOE) Office of Science User Facility operated for the DOE Office of Science by Argonne National Laboratory under Contract No. DE-AC02-06CH11357. I would like to thank the beamline scientists- Soenke Seifert and Xiaobing Zuo for helping me with my experiments and making sure I have everything that I needed. I will truly miss the thrilling night shifts at APS and also Soenke’s coffee!
xxi
I want to thank my old and existing roommates in Golden: Aakash Katageri, Abhijit Kale, Piyush Chaudhari, Muthu Vinayak Thyagarajan, Vinay Dudempudi, Aniket Prabhu, Rohit Narayanan, and Prasun Garg. I would like to thank a few of my friends who live far away currently: Bansi Bandi, Rishika, and Ashwin Ravichandran. My days in Golden wouldn’t be better without Eiman Al Munif and Amogh Thatte. I would like to thank Isha foundation for teaching me yoga for my well-being.
I want to finally thank Divekar family- Sadhana, Ganesh, and Hrishikesh for their constant support throughout my PhD. And also my aunts – Hema, Rekha, Shobha, and their families for supporting me financially during my under-grad studies which may not be directly related but still I want to express my gratitude.
xxii
In loving memory of my Grandfather, Dr. Vishnu Damodar Divekar
1
CHAPTER 1 INTRODUCTION
1.1 Energy and importance of H2
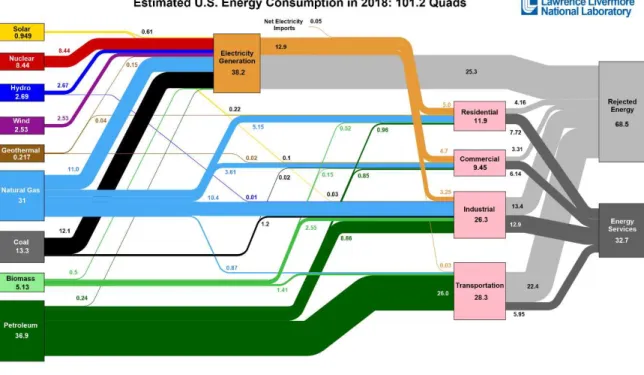
Figure 1.1 Estimated U.S. Energy use in 2018 broken down by source and sector.1
The increasing needs of human civilization make the energy demand a very crucial topic. Most of this energy is produced by the combustion of fossil fuels which releases carbon dioxide. It is reported that the carbon-dioxide levels in the atmosphere have increased from approximately 300 ppm in 1880 to ~400 ppm in the 21st century.2 It is also reported that the rise in carbon dioxide concentration in the atmosphere leads to an increase in the global temperature which might lead to natural disasters like drought or floods, polar ice cap melting and hence rise in the sea-level. Knowing this, it is very
2
important to reduce carbon dioxide emissions. Switching to renewable energy technologies is one promising solution to reduce carbon emissions.
From Figure 1.1 we get a better understanding of the amount of energy consumed in each sector. We notice that out of all the sectors, transportation is one of the greatest sinks of the rejected energy. 90% of the energy required for transportation uses petroleum as a source which acts as a fuel in vehicles operated on internal combustion engine. The internal combustion engine is very inefficient and hence the lower utilization of energy. The other problem of using an internal combustion engine is the release of carbon dioxide which causes global warming. To reduce the amount of rejected energy and carbon-dioxide emissions, it is very important to utilize efficient and cleaner technologies in the transportation sector. These technologies are mainly classified into two types: battery and fuel cells. Modern zero-emission battery vehicles have entered the consumer market since the early 1990. Automobile companies have recently commercialized hydrogen fuel cell vehicles that offer advantages like higher efficiency, no emissions except water vapor. These vehicles need lower H2 charging time and has higher mileage. Therefore, it is very important to consider H2 as a sustainable energy source in the near future.
The cheapest way of producing hydrogen is through steam reforming which has applications in the petroleum industry. However, it can also be produced by water splitting using electricity from renewable energy sources like wind/solar. Apart from its application as a fuel for zero-emission vehicles, it could also be used to synthesize artificial fuels from CO2 reduction, biomass, ammonia, fertilizer, metals refining, heating, etc. (Figure 1.2).
3
Figure 1.2 Incorporation of H2 in energy production and utilization.3
4
Figure 1.4 Effect of H2 at scale on CO2 emissions.1
The amount of hydrogen produced in 2014 was 10 million metric tons and most of it was used in the petroleum-based industry. If the production of H2 is increased to 50 million metric tons, then it is projected that the rejected energy will significantly decrease due to its incorporation in the transportation sector and industry as indicated in Figure 1.3.1 This will ultimately lead to a 45 % reduction in the amount of CO2 emissions as shown in Figure 1.4. Therefore, H2 fuel cell vehicle technology is promising for mitigating energy inefficiencies and carbon emissions.
1.2 Fuel cells current state-of-the-art
Fuel cells are electrochemical energy conversion devices that directly convert chemical energy into electrical energy. Fuel cells can be used as a device providing large power densities in portable as well as being scalable to large stationary applications. The working principle of a fuel cell was first demonstrated in 1839.4 Fuel cells are mainly
5
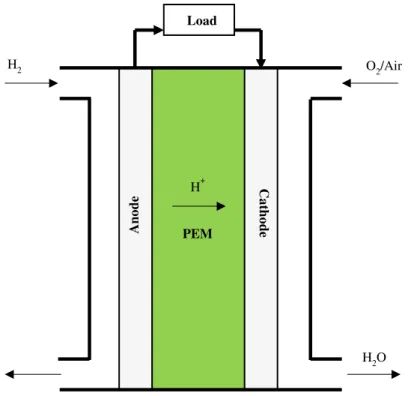
classified based on electrolyte. The following are the types of fuel cells: Proton exchange membrane fuel cells (PEMFCs), alkaline fuel cells (AFC), phosphoric acid fuel cells, molten carbonate fuel cells and solid oxide fuel cells. The first two types are operated at low temperatures (below 100 °C) and the later are usually operated at higher temperatures. There has been a lot of work on developing PEMFCs and they have already started getting applied in backup power and transportation. Several automakers are developing H2fuel cell cars. Recently, Toyota’s Mirai, Honda’s Clarity, and Hyundai’s NEXO have entered the consumer market. Current PEMFC technology has been commercialized using perfluorinated sulfonic acid (PFSA) polymers as a proton exchange membrane and precious metal platinum as a catalyst for optimal performance.5-7 Platinum is an expensive precious metal and its market cost is not stable. PFSA is an expensive product and its manufacturing process has severe environmental impacts. Currently, the PEM research is mainly focused on reducing the platinum loading and making them highly durable. The working of the fuel cell can be understood from the schematic shown below in Figure 1.5.
Electrode reactions for PEMFCs using H2 are as follows:
Anode: H2→ 2H+ + 2e- (1.1) Cathode: O2 + 4e- +4H+→ 2H2O (1.2) Overall reaction: H2 + ½O2→ H2O (Ecell = 1.23V at 1 bar, 298.15K) (1.3) In PEMFCs, the proton (H+) produced from the oxidation of hydrogen at the anode migrates to the cathode where the reduction reaction occurs. The electron released from the anode travels through the external load to the cathode where the reaction is
6
completed. Overall, this process produces direct current, water, and heat. Apart from H2, other fuels could also be used like ethanol, methane, etc.
Figure 1.5 A schematic representation of the proton exchange membrane fuel cell (H2).
Like PEMFCs, alkaline fuel cells (AFCs) can be used for power generation. This technology has been implemented by the national aeronautics and space administration (NASA) since the 1960s in the U.S. space programs.8 The alkaline fuel cell uses aq. KOH as an electrolyte. However, for terrestrial applications the oxidant-ambient air contains CO2 and the catalyst cannot be a highly precious metal loaded catalyst. It also has certain disadvantages like corrosion of the electrode and the reaction of KOH to atmospheric CO2 resulting in the formation of insoluble metal carbonates and bicarbonates that reduce the activity of the catalysts and hampers the steady electrode operation.8 To avoid these problems, researchers moved to develop solid electrolytes where the cations are tethered to the polymer backbone and the counter-ions are dissociated within the polar phase in
H2 O2/Air H2O Ca th od e Ano de H+ Load PEM
7
the solid electrolyte. These electrolytes are referred to as anion exchange membranes (AEMs).
1.3 Anion-exchange membranes
In the past decade, there has been an increasing interest in the use of AEMs in electrochemical energy conversion applications. AEMs are operated on a similar principle as PEM except the transporting ion is OH- (anion) instead of a proton (cation). The pH of operation is also higher to maintain alkaline conditions. This in principle gives the ability to use non-noble metal catalysts and hence would be advantageous over the PEMFCs.9 The advantage of using AEMs over PEMs is the facile oxygen reduction kinetics in the alkaline environment.10 The AEM technology currently faces certain hurdles that limit its commercialization. The AEMs degrade at higher temperatures in the alkaline conditions due to the nucleophilic attack of OH- ions on the cationic group through Hoffman’s degradation (E2 elimination), E1 elimination, and SN2 nucleophilic substitution which leads to loss of functionality and hence a deterioration in the ion exchange capacity of the membrane (IEC).10 This problem can be potentially solved by synthesizing membranes with cations that display higher resistance to degradation.
Electrode reactions for AEMFCs (figure 1.6) using H2 are as follows:
Anode: 2H2 +4OH- → 4H2O + 4e- (1.4) Cathode: O2 + 2H2O + 4e-→ 4OH- (1.5) Overall reaction: 2H2 + O2→ 2H2O (Ecell = 1.23V at 1 bar, 298.15K) (1.6) Marino and Kreuer has performed a degradation study of different model quaternary ammonium cations at 160 °C and NaOH concentration of 10 mol L-1.11 The report suggests that some cyclic cations display higher resistance to degradation which reflects
8
to longer half-life. Out of all the small molecules, two groups (ASU and DMP look very promising and have demonstrated a half-life degradation higher than trimethyl ammonium which is widely used as a cation functional group in AEMs). Novel imidazolium cations synthesized by Holdcroft and co-workers also have demonstrated exceptional alkaline stability.12
Figure 1.6 Schematic representation of Anion exchange membrane fuel cell (AEMFCs). A fuel cell membrane should have high ionic conductivity so a thin membrane can have a low area-specific resistance (ASR) of 0.02 Ω cm2 which makes it high performing. Therefore, the mobility of ions in the film is a very important property. Initially it was thought that the mobility of an H+ is higher than OH-.10 New AEMs which were getting developed initially reported very low values of the hydroxide conductivity in comparison to Nafion®. Like H+, OH- can also conduct via Grotthus hopping.13 Therefore, in the past
couple of years, researchers have developed materials with very high OH
-H2 O 2/Air Cath o d e A n o d e OH -Load AEM H2O
9
conductivities.14, 15 In Figure 1.7, we can observe the trend of increasing reported OH -conductivities over the past years of work:
Figure 1.7 Anion conductivities reported in the literature for AEMs in the past decade.9 There is a lot of scope for improvement in the catalysis of the AEMFC. Most of the performance reported in the literature is data using Pt as a catalyst. About 81% of the fuel cell tests reported are operated using Pt electrodes, 5% Pt cathode, 8% Pt anode and 6% Pt-free cell.9 The reported power densities of non-Pt fuel cells are in the range of 50
to 500 mW cm-2 depending on the kind of catalyst loading. Pd-CeO2/Ag kind of catalyst loading gives the best among all. However, we should also consider that Pd is also another kind of precious metal. The power density of the catalyst loading with non-precious metal: Ni/Ag and Cr@Ni/Ag is about 50-70 mW cm-2.
1.4 Perfluorinated anion exchange membranes
PFSAs have displayed excellent chemical, mechanical and electrochemical properties as a cation exchange membrane. Therefore, many attempts were made to take these as a starting material and modify it to synthesize an anion exchange membrane.16 The idea behind this approach is to obtain an excellent material that has excellent mechanical and
10
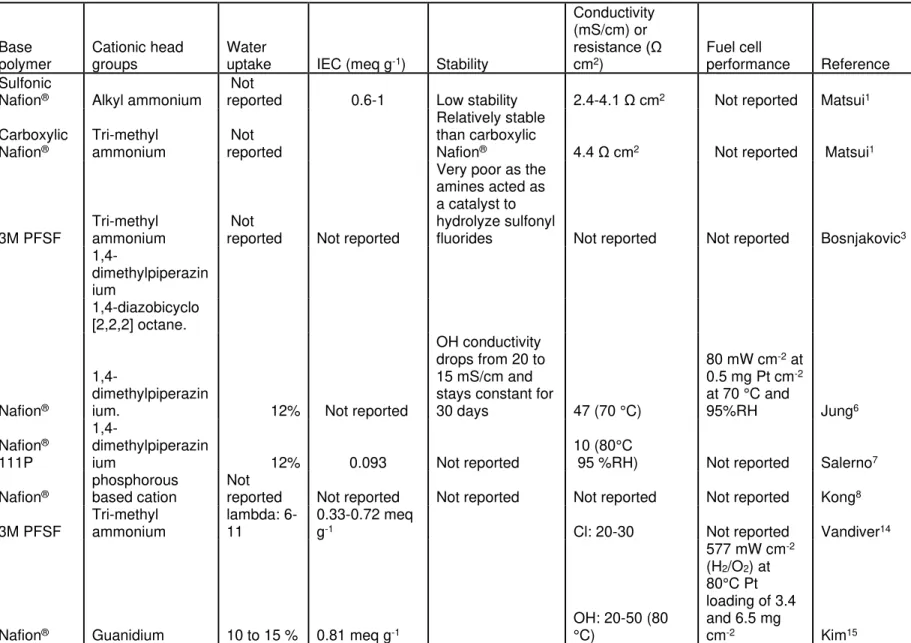
phase segregation properties which have been thought to make PFSAs more conductive.17 The modifications are classified into two different classes: one involving Nafion® in its carboxylic form,10 and secondly in its sulfonic form.18 The carboxylic form requires several steps to complete the modification. The material exhibited decent electrochemical properties with an electrical resistance of 4.4 Ω cm-2. However, they had low chemical stability in alkaline media. The sulfonyl Nafion® was modified by condensing the sulfonate group with amine and then functionalizing it with a quaternary ammonium.10
The polymers exhibited IECs in the order of 0.6-1.0 x10⁻³ mol g-1 and electrical resistance
of 2.4 to 4.1 Ω cm-2. Unlike the carboxylic type membrane, these membranes were chemically stable.
Out of all attempts, very few succeeded in synthesizing a decent modification of PFSAs to perfluorinated AEMs. Jung et al. has reported a material with sulfonyl fluoride as a starting material which was modified with the 1,4-dimethylpiperazine (DMP) to facilitate the formation of quaternary ammonium as a cationic site.19 The OH- form of the
membrane had a very low ionic conductivity value of around 10 mS cm-1. The water uptake of the DMP-derived membrane was 60% which is not good as far as mechanics of the material is considered. However, the material shows good resistance to chemical degradation, which can be observed by having a constant conductivity value maintained after being immersed in 2M KOH at 60 °C for 30 days. But, a more accurate test of degradation is immersing the material at 80 °C and then testing it. The fuel cell testing has reported a peak power density of 80 mW cm-2 at 0.5 mg Pt cm-2 loading at 70 °C and 95%RH using feed H2/O2 gas. This fuel cell performance is significantly lower when
11
compared to other AEM candidates with higher performances reported in the literature.14, 20, 21
Bosnjakovic et al. has attempted to synthesize perfluorinated membranes using the 3M PFSF as a starting material and attaching three different types of cations: trimethylamine (TMA), 1,4-dimethylpiperazine (DMP) and quaternized 1,4-diazobicyclo [2,2,2] octane (DABCO) amines.22 To analyze the stability of the bond formation, Fourier transform infra-red spectroscopy (FTIR) and Nuclear Magnetic Resonance (NMR) spectroscopy was used. However, the attempt to generate AEMs was failed and the amines acted as the catalyst for hydrolysis of the sulfonyl fluorides which led to the generation of SO3- anions which was confirmed by observing a peak at 1052 cm-1 in the FTIR spectra. Salerno et al. has reported a DMP derived AEM with Nafion® 111P as a
starting material.23 The conductivity values were obtained in the orders of 10 mS cm-1 in
the OH- form at 80 °C and 90%RH. The water uptake of the membrane is reported as
12%. The lower conductivity is attributed to the lower IEC of 0.093 meq g-1. FTIR spectra
of the AEMs give more insight into the types of peaks observed. The 1468 cm-1 feature corresponds to an asymmetric stretch of O=S=O. Kong et al. has synthesized a Nafion® modified AEM structure by chemically attaching phosphorous based cations.24 Bond formation of sulfur from the sulfonyl group in Nafion® and phosphorus was investigated using solid-state NMR techniques. However, important properties like conductivity, ion-exchange capacity, and water uptake are not reported. Vandiver et al. has performed extensive characterization of a perfluoro quaternary ammonium anion exchange membrane using the 3M ionomer as a starting material.25 The ion exchange capacity
12
when exposed to alkaline conditions. The conductivity was in the order of 20-30 mS cm-1 for membranes with the TMA cation in its Cl- form. The self-diffusion of water was 1.6 x
10-5 cm2 s-1 which was obtained using NMR techniques. The number of water or charge carriers (λ) values was in the range of 6-11. The small angle x-ray scattering (SAXS) indicated ionic aggregation with a feature size of 3.7-4.2 nm.
The most promising material was synthesized by Kim et al. by chemically modifying Nafion® sulfonyl and carboxylic types.26 The cation of the finished product was guanidinium. The extent of degradation was analyzed using the FTIR and NMR of the membrane when exposed to 0.5 M KOH at 80 °C for two polymers. The C=N peaks at 1662 and 1527 cm-1 disappeared after 24 h for the guanidinium type of membrane. However, the phenyl guanidinium membrane FTIR scan after 72 h indicates that the intensity loss or change in peaks is very insignificant. Similar results were obtained from the NMR analysis. This suggests that the phenyl guanidinium type of membrane is more chemically stable to the OH- attack. The ion exchange capacity (IEC) was in the range of
0.7 to 0.81 and the OH- conductivity was in the range of 20-50 mS cm-1 at 80 °C. The water uptake of the membranes was in the range of 10 to 15 wt.% at 30 °C. The fuel cells were tested at 80 °C and using H2/air (10 ppm CO2) and H2/O2. The fuel cell data indicates that the phenyl guanidinium type of perfluorinated AEMs delivers the highest performance with a peak power density value of 577 mW/cm2 in O2 and 466 mW/cm2 in air.
1.5 Block polymer anion exchange membranes
A self-segregated or self-assembled structure is expected to make the AEMs more conductive.27 The formation of phase segregated structures in AEMs is very challenging due to the lower hydrophobicity of hydrocarbon polymer backbones. Block polymers are
13
promising because the polymers can be synthesized in a way that a particular chemical structure with incompatible segments self-assemble into periodic structures. This arrangement enhances the mechanical strength due to the right choice of constituents of the film and would also elevate the conductivity due to good phase segregation.
An anion conductive block poly (arylene ether)s polymer was synthesized by Tanaka et al. 28 The phase segregation of hydrophobic or hydrophilic domains was confirmed by the scanning transmission electron microscopy (STEM). The membrane showed higher conductivity values of 144 mS/cm at 80 °C and water. In an actual fuel cell, the membrane is usually humidified to 95%RH. Therefore, the high conductivity value in water can be deceiving and should not be considered the same at 95%RH. The stability tests were performed to test the chemical degradation under heated and hydrothermal conditions. However, the degradation studies in strong alkaline conditions were not performed so it is difficult to analyze the actual stability of the membrane to the OH- attack.
Polystyrene based block copolymer with vinyl benzyl trimethyl ammonium (VBTMA) cation was synthesized by Tsai et al.29 The phase segregation was investigated using SAXS which revealed the formation of spherical, cylindrical, or lamellar morphologies. The samples with lamellar morphology exhibited the highest conductivity values at higher temperatures and humidified conditions. The SAXS data is reported in BF4- and OH- as a
counter-ion. The procedure of collecting OH- spectrum is not explicitly mentioned to be
CO2 free. Therefore, whether the OH- remains as a counter-ion throughout the experiment is highly doubtful.
Disabb-Miller et al. has attempted to synthesize a QA-functionalized poly (hexyl methacrylate)-block-poly (styrene)-block-poly (hexyl methacrylate) membrane.30
14
Although the membranes phase segregated decently which can be confirmed by observing the transmission electron microscopy (TEM) data, the Cl- conductivity of the membranes was only in the order of 10 mS/cm.
A bi-continuous self-segregating block copolymer was synthesized in a single step cross-linking a cation containing polymer and a hydrophobic polymer by Price et al.31 The
OH- conductivity was reported as 120 mS/cm at 60 °C and liquid water. In an actual fuel cell, the conductivity value would be lower than reported. The water uptake of the membrane is too high, and it will therefore affect the mechanical properties of the film itself.
Li et al. have attempted to synthesize a QPPO-PAES-QPPO block polymer with one block of poly (arylene ether sulfone)s and two blocks of quaternary ammonium functionalized poly (2,6-dimethyl-1,4-phenylene oxide).32 The phase segregation of the membranes was observed and confirmed by the SAXS pattern. The λ value of these membranes was in the range of 6 to 16. The OH- conductivity was reported as 120 mS/cm at 80 °C and under fully humidified condition. Robertson et al. has demonstrated the use of a ring-opening metathesis polymerization approach to generate cross-linked membrane materials.33 The authors have reported that the addition of cyclo-octane as a co-monomer increased the mechanical properties. However, we notice from the tensile stress data that the increase in stress at break increases initially and then decreases if increased further. The authors have also reported that the OH- conductivity was observed to be > 100 mS/cm at 50 °C.
Li et al. has synthesized a quaternized poly (2,6-dimethylphenylene oxide) containing clicked 1,2,3-triazoles through Cu-catalyzed “click-chemistry”.34 The λ value was
15
observed in the range of 10-20, which is not too high and hence makes them mechanically strong. The OH- conductivity was obtained in the range of 10 to 60 mS/cm from 20 to 80 °C. When OH- membranes were exposed to air, the conductivity values dropped after few tens of hours. However, it must be noted that the testing cell was immersed in water. The diffusion of CO2 through the water and its interaction with the membrane takes a long time. Therefore, this is not an accurate test of studying the transient drop in conductivity as in an actual fuel cell the drop would happen much faster even at a higher humidity condition. The stability tests of the membranes were performed by immersing the films in 1M KOH at 80 °C. The IEC of the best membrane dropped from 1.7 to 1.0 after 150 h and then stabilized. A performance of 180 mW cm-2 was observed in a fuel cell test. The best block polymer membrane was recently reported by Buggy et al. who used hydrogenated polyethelene based tri-block polymer and trimethyl ammonium (TMA) and methyl piperidinium (MPRD) cation. The polymer displays excellent ionic conductivity of 179 mS cm-1 at 80 °C and 95%RH.
Block co-polymer literature suggests that for achieving high ionic conductivity the ionic domains should phase segregate at a reasonable swelling. Perfluorinated anion exchange membranes whose swelling is limited by hydrophobic polymer backbone also phase-segregate which makes them a promising class of polymeric materials for research.
1.6 Carbon dioxide reaction with hydroxide
OH- + CO2 → HCO3- (1.7) HCO3- + OH- → CO32- + H2O (1.8)
16
Wang et al. has attempted to study the reaction kinetics of carbon dioxide with H2O
and OH-.35 They attempted to study two different types of change in pH: hydration of CO2, i.e. Na2CO3 reacts with the saturated CO2 in water and dehydration of carbonic acid or bicarbonate by reacting Na2CO3 with HCl. The pH changes were monitored by observing the absorbance of thymol blue and methyl red indicators respectively. Later, they fitted the data to five possible reaction pathways occurring and estimated the rate constants of each reaction. Here, we notice that the actual concentration profile of the OH- was never investigated. Therefore, it is not reliable to consider the reaction constants obtained from this study as the actual constants for OH- forms of AEMs reacting with the CO2. On the other hand, we can trust the second reaction (carbonate to bicarbonate) constants as it was experimentally evaluated.
Pohorecki and Monuik has studied the reaction rates of the carbon dioxide with aqueous hydroxide salt solutions using laminar-jet techniques.36 They have reported the rate constants of the CO2 reaction with three different hydroxide salts and finally concluded that the rate constant is dependent on the cationic species present and ionic strength of the solution.
There have been very few attempts for understanding the concentration profile of three species when the OH- AEM is exposed to air. The first concentration profile was reported by Yanagi et. al.37 In Figure 1.8 they determined the species concentration profile of the AEM using Warder titration at different times of exposure. From the data, we notice that the hydroxide concentration quickly drops to zero after 30 min and then the carbonate and bicarbonate concentration equilibrates. The species concentration at equilibrium was never analyzed. Here, we also notice that at any time, any one of the three species
17
concentration is zero. But, it has not been specified whether it is analyzed to be zero or assumed. In the Warder titration, there are three endpoints but, only the last two are distinctly observed and the first endpoint is very faint to accurately pinpoint. Therefore, it is not possible to estimate three different species concentrations from Warder titration alone which makes this data questionable.
Figure 1.8 Concentration profile of OH-, CO32-, HCO3- when OH- form of A201 AEM is exposed to air.37
Figure 1.9 Concentration profile of OH-, CO32-, and HCO3- when the OH- form of radiation grafted AEM is exposed to air.27, 38
m
m
ol
18
Kizewski et al. also reported the concentration profile of all three species when the samples were directly exposed to air (Figure 1.9).27,38 Here, we observe similar trends and again notice that at any time one of the species concentrations is zero. The authors have used the Warder titration method to analyze the species concentration. Therefore, it is questionable whether the species concentration is zero or assumed as zero. Apart from this they have also tried to study the concentration profile of an AEM (hydroxide form) in a CO2 free water when exposed to air. They have also mentioned that the species equilibrate (carbonate and bicarbonate) after 14 days (Figure 1.10). The reaction time is longer, because the carbon dioxide must diffuse through the layer of water to reach the AEM and then react with it. They have also exposed a complete HCO3- ion form to air, where it can be observed that an exchange happens between the carbonate and the bicarbonate species.
Marino et al. has investigated the species concentration of the uncross-linked FAA-3 membrane (Figure 1.11).39 Here, we observe that the hydroxide concentration drops after 100 min. The main reason for a longer time is higher water content in the membrane, which makes the carbon dioxide diffuse at a slower rate and hence the reaction proceeds slowly. Here, they analyzed the samples using the Warder titration method. So again, it is questionable whether it is the actual concentration. A201® anion exchange membrane was studied by Suzuki et al,40 where they have reported the species concentration vs
time when OH- AEM is exposed to air using the Warder titration method. We notice that they have reported the data of yCO3 which is equivalent to the addition of two species:
19
Figure 1.10 Concentration profile of a membrane immersed in N2 purged DI water and then exposed to air.38
Figure 1.11 Concentration profile of species in uncross-linked FAA-3 when OH- form of AEM is exposed to air.39
20
To determine this quantity, they take the fraction of volume between the two endpoints to the total volume required to titrate. We observe that it takes about 6 h to reach yCO3=1.This would mean that the first endpoint has zero volume for the last data point. The carbonate ions get converted to bicarbonate while titrating before the first endpoint.41 As per the titration data reported by Yanagi and Fukuta, the equilibrated membrane would consist of both carbonate and bicarbonate species.37 Therefore, this data is questionable as it would mean that there are no carbonate ions in the membrane. Hence, we can conclude that better titration methods need to be implemented to get accurate concentration profiles which will help us understand the nature of hydroxide AEMs for H2/Air fuel cell operations.
1.7 Effect of air on physiochemical and electrochemical properties of AEMs
Suzuki et al. has observed that the conductivity of the membrane at 50 °C and 95%RH drops as the fraction of equilibrated carbonate species increases in the membrane.40 The drop is linear between fractions 0 to 0.5 and 0.5 to 1.0 and we notice that the drop has different slope values. They have reported the mobility values of hydroxide, carbonate, and bicarbonate species separately which was compared to the mobility of the ions in aqueous electrolyte. We observe that the hydroxide species has the highest ionic mobility followed by carbonate and finally bicarbonate. The mobility of ions in the aqueous electrolyte is significantly higher than in the actual membrane. The fuel cell performance suggests that the fully carbonated film has a higher ohmic resistance when used in the fuel cell compared to the partially carbonated sample.
21
Figure 1.12 In-plane conductivity vs time when the OH- form of ETFE-g-PVBTMA AEM is exposed to air at 60 °C and 95%RH.42
Pandey et al. studied ETFE grafted AEM,42 where they exposed the OH- form of AEM to air and observed the transient drop in conductivity over time. From Figure 1.12, we see that the conductivity drops to a steady low value after 200 s. They tried to fit an exponential decay curve to the drop in conductivity and we observe that the drop has a single exponent behavior. However, if we observe closely the fit deviates from actual experimental values between 100 to 200 s and after 350 s. This might indicate that the nature of drop may have another exponential term.
Maes et al. studied poly (ethyleneimine) based AEM,43 where they obtained transient FTIR spectrum when OH- AEM is exposed to ambient air. They identified two
different C-O stretch at 1380 and 1460 cm-1, which correspond to the formation of bicarbonate and carbonate ions respectively. The area under the peak was calculated and plotted vs time. Here, we notice that the bicarbonate peak grows to be more intense than the carbonate peak. The authors did not confirm it by doing titration studies, therefore
22
it is questionable whether the kinetics of species is accurate. Also, previous literature suggests that the carbonate is a dominant species initially followed by the bicarbonate.37, 38
Bharath VJ et al. have studied the effect of air exposure to the Tokuyama A201® membranes.44 Here, they have reported a transient change in the high frequency resistance of an OH- form of the membrane when exposed to air. From the resistance graph, we understand that the resistance does not change at 0%RH after the switch. However, we notice that the resistance increases in more humid conditions. The authors report change in mass of the membrane when exposed to air using a QCM. Here they have reported the change in the form of slope in frequency. We observe that after exposure the mass increases. At equilibrium the mass of the membrane should be less than the initial mass as the carbonate or bicarbonate form has lower water uptake than the hydroxide form.39
1.8 Self-purging mechanism in AEMFC
The self-purging mechanism is oxidation of the carbonate species at the anode section which results in the formation of water and release of electron and CO2. The process is electrochemical and was first observed by Adams et al.45 The data reported in
the article suggests that OH- AEM has a slightly inferior peak power performance as
compared to CO32- AEM. Siroma et al. has attempted to explain the self-purge using a mathematical modeling approach.46 They have discussed scenarios with membrane mainly consisting of hydroxide-carbonate ion and bicarbonate-carbonate ion pairs. For the first scenario, the hydroxide concentration at the cathode increases with higher current density. They have tried to measure CO2 concentration over time as they
step-23
change the current density. We observe that as the current density changes from 100 to 150 mA cm-2 there is a spike in the CO2 concentration measured at the anode outlet. The
spike is even more intense when the current density is increased from 150 to 200 mA cm -2. The hypothesized reactions of self-purge are as follows:
H2 + CO32- → CO2↑ + H2O + 2e- (1.9) H2 + 2HCO3- → CO2↑ + 2H2O + 2e- (1.10) Fukuta et al. has performed in-situ observations of the CO2 through self-purging.47 Here, they have tested the fuel cell using Tokuyama A201® membrane and AS-4® ionomer. Ambient air and clean air performance are reported. We notice that the clean air (290 mW/cm2) has twice the peak power than ambient air. Here they have measured the CO2 purge from the anode exhaust when the fuel cell is operated in clean or ambient air using a carbonate form of film. We notice spikes in CO2 concentration when there is a step-change in current density. At a higher current density, we observe no spike in CO2 for clean air and very little change in CO2 concentration when the fuel cell is operated with ambient air. The CO2 concentration was integrated to get the total moles of CO2 leaving the anode exhaust and then the carbonate moles corresponding to it was evaluated to understand the moles of carbonate left in the membrane electrode assembly (MEA).
From Figure 1.13 we notice that all of the carbonate species get stripped above 400 mA cm-2 for clean air and for ambient air, where the carbonate or bicarbonate ions
are getting generated due to reaction of CO2 with OH-, about 5 % of carbonate is left in
24
Figure 1.13 Residual CO2 amount of CO32- anion in the membrane at each current density, in the case of clean air (solid line) and ambient air (dashed line).47
1.9 CO2 absorption theory
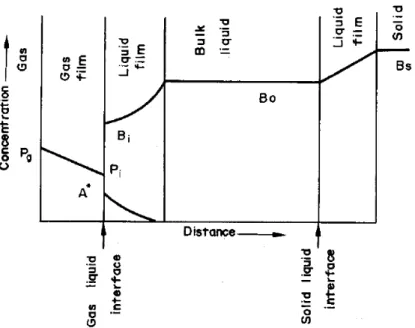
Juvekar and Sharma studied the kinetics of absorption of CO2 in a suspension of lime.48 The experiments were performed in a bubble column. The authors have discussed different models of CO2 absorption. For a better understanding of the gas-liquid interaction, a figure is reported below.
From figure 1.14 we can understand the types of resistances involved are: 1. Resistance through the gas film.
2. Resistance through the solid-liquid film.
3. Resistance through the liquid film where the absorption of CO2 is accompanied by a relatively fast reaction.
In AEMs for fuel cells, the resistance through the solid-liquid film does not exist as the counterions in the ionic polymer are already dissociated at a sufficient hydration level and also, they are not suspended like in this case.
25
Figure 1.14 Concentration profile for the carbonation of lime suspension.48 Conditions discussed are as follows:
Condition 1: √𝐷𝐴𝑘2[𝐵0] 𝑘𝐿 ≫ 1 (1.11) And Condition 2: √𝐷𝐴𝑘2[𝐵0] 𝑘𝐿 ≪ [𝐵0] 𝑧[𝐴∗]√ 𝐷𝐵 𝐷𝐴 (1.12) Where,
z = stoichiometric coefficient of the overall reaction.
kL = liquid-side mass transfer coefficient in the absence of chemical reaction.
DB = diffusivity of OH- ions in the liquid, cm2/s.
k2 = rate constant for the reaction between CO2 and OH- ions, cm3/mol s. [A*] = solubility of CO2 in aqueous phase, mole/cm3 liquid, [A*] = HPi.
26
H = Henry’s constant.
Pi = Partial pressure of CO2 at the gas-liquid interface.
The 1st model for the rate of transfer of CO2 into the liquid and then the reaction is as follows:
𝑅𝑎 = [𝐴∗]𝑎(𝐷
𝐴𝑘2[𝐵0])1/2 (1.13) Here, the [OH-] concentration in the bulk is the same as the concentration in the gas-liquid film.
Eliminating [A*] and Pi, the overall rate is as follows:
𝑅𝑎 = 𝑎𝐻𝑃𝑔√𝐷𝐴𝑘2[𝐵0]
1+ 𝑎𝐻√𝐷𝐴𝑘2[𝐵0]𝑘𝐺𝑎 (1.14)
The denominator term is assumed to equal 1 as the gas transfer resistance is negligible. In case condition 1 does not satisfy but condition 2 satisfies, then
𝑅𝑎 = 𝑎𝐻𝑃𝑔√𝐷𝐴𝑘2[𝐵0]+𝑘𝐿2 1+ 𝑎𝐻√𝐷𝐴𝑘2[𝐵0]+𝑘𝐿2𝑘𝐺𝑎
(1.15)
In this scenario, a part of the reaction between CO2 and OH- occurs in the film and the rest in the bulk liquid.
If condition 2 is not satisfied, then the reaction is instantaneous and has a rate expression: 𝑅𝑎 = 𝑎𝐻𝑃𝑔𝛷𝑘𝐿 1+ 𝑎𝐻𝛷𝑘𝐿𝑘𝐺𝑎 (1.16) 𝛷 = √𝐷𝐴𝑘2[𝐵0] 𝑘𝐿 [ 1+ 𝑧[𝐴∗][𝐵0]𝐷𝐵𝐷𝐴−𝛷 [𝐵0] 𝑧[𝐴∗]𝐷𝐵𝐷𝐴 ] 1/2 (1.17) This implies that there will be depletion of OH- ions in the liquid film and the reaction will be instantaneous.
27 1.10 Segmented fuel cell
Effect of %RH on segmented cell performance:
Cleghorn et al. has reported the effect of hydration on the SFC performance.49 Here, we notice that the cell current distribution is severely affected at lower anode or cathode humidification levels. The authors recommend air stream humidification to establish full hydration at the cathode at lower cell current densities even with thin membranes and low airflow rates. Yoshioka et al. has reported that the current distribution in the SFC is more uniform at higher humidity conditions. For low humidity operation, the current density is observed to be higher at the gas outlet location because of better hydration due to the accumulation of water.50 Hottinen et al. has reported that the flooding of the cell starts from the end of the gas flow channel.51 Holmstrom et al. has concluded that gas diffusion layer (GDL) without a microporous layer (MPL) on the cathode side suffer from higher mass transfer resistance at higher humidity conditions.52 Weng et al. has studied the SFC performance at 0%RH operation and it is noticed that the downstream segments perform better and function stable compared to the top and the middle segments due to better hydration from carried over water downstream.53 Noponen et al. has reported an increase in the SFC performance away from the inlet segments due to production of water which gets carried over upstream.54 Srivastava and Tajiri has shown that in the wet condition the current density under the land section is lower than the channel section due to higher mass transport resistance in the land section compared to the channel section. This could be due to longer distances required by the oxygen to travel to the active sites or due to higher water accumulation under the land.55 They have reported that the current densities are lower in the channel areas than land areas due to dehydration. Dong et al. has
28
reported that higher humidification leads to greater cell performance and enough humidification of the anode is necessary for avoiding local anode dry out and hence better cell performance. For dry humidification of the cathode, it is observed that the vapor fraction of the water decreases in the upstream segment and then at some point increases gradually. The decreasing trend is observed due to dominant diffusion and electro-osmotic drag observed in the inlet section which transports the water from the anode to the cathode side. The reversal in trend is due to saturation of the water vapor from the build-up of water from increased production which overcomes the drag thereby transporting the water back to the anode. The local current distribution could be classified into three regions: 1. For moist anode, cell current density follows a reducing trend, for the same anode or cathode condition, it’s constant and for dryer anode the current density increases over the location. 2. The net reversal of water flux to the anode side leads to an increase in the current density until it plateaus. 3. The current density follows a downward trend due to flooding.56
Mass-transfer, diffusion & electro-osmotic drag effects:
Noponen et al. has reported that the performance drops downstream at low humidity conditions due to the mass-transfer effects of using air as an oxidant despite having high proton conductivity.54 After conducting segmented fuel cell experiments on DMFC, Sarinen et al. has concluded that higher utilization of the fuel (methanol) on the anode reduces the cross-over issues.57 Schneider et al. has reported the experimental proof of the occurrence of low-frequency capacitive loop in air-fed PEFC impedance spectra originating from inhibition of oxygen diffusion through nitrogen in the pores of the backing layer but, they have also mentioned that it could also be attributed to the depletion of