DISSERTATION
AFRICA’S FUELWOOD FOOTPRINT AND THE BIOME-LEVEL IMPACTS OF TREE HARVEST
Submitted by Andrew T. Tredennick
Graduate Degree Program in Ecology
In partial fulfillment of the requirements For the Degree of Doctor of Philosophy
Colorado State University Fort Collins, Colorado
Summer 2014
Doctoral Committee:
Advisor: Kathleen Galvin Co-Advisor: Niall P. Hanan Michael Coughenour Stephen Leisz
Copyright by Andrew T. Tredennick 2014
ABSTRACT
AFRICA’S FUELWOOD FOOTPRINT AND THE BIOME-LEVEL IMPACTS OF TREE HARVEST
Wood biomass is the dominant energy source in sub-Saharan Africa (SSA), supplying some 75-90% of African families with the necessary energy to meet their basic human needs. Yet, despite the importance of fuelwood (firewood and charcoal) to food and energy securities in SSA, no comprehensive assessment of fuelwood supply and demand exists. Likewise, we have little understanding of how harvesting of trees affects vegetation dynamics in savannas and forests. Empirical and theoretical work over the past twenty years has focused on disturbance from fire and herbivory in savannas and forests, but most other human impacts have been ignored. This dissertation aims to increase our understanding of fuelwood dynamics from applied and theoretical angles. Specifically, I focus on four objectives: (1) empirically testing the ability of theoretical allometric scaling models to predict the relationships between morphological traits (e.g., stem diameter and height) of savanna trees important for rapid biomass assessments and ecological theory; (2) using remote sensing to estimate available wood biomass for harvest in Mali, West Africa; (3) quantifying and mapping annual fuelwood supply and demand for all of SSA; and (4) integrating fuelwood harvest into our theoretical understanding of savanna and forest vegetation dynamics.
In Chapter 2 I present a rigorous test of plant scaling models in savanna systems. Empirical data is not always available for estimating plant biomass from easily measured variables (e.g., stem
diameter), so it is important to discover if theoretical models of plant scaling based on allometri-cally ideal plants can be used in systems where multiple selective pressures may drive allometries away from ideal predictions. I found that the predictions of Metabolic Scaling Theory were most consistent with data from harvested trees from three savanna sites in West Africa. Especially for biomass, Metabolic Scaling Theory out performed the other models tested. However, I found sig-nificant departures of the Metabolic Scaling Theory prediction for stem height or branch length based on stem or branch diameter: length scaling exponents at all sites were higher than expected by theory. I hypothesized that savanna trees have realized height/length scaling exponents that are larger than predicted by underlying theory because of selection for rapid vertical growth to escape fires that are so frequent in savanna systems. Among sites there is variation in length/height scaling exponents, indicating an interaction between resource availability and selective pressure for rapid growth. However, the analysis indicates that where data is unavailable the prediction of Metabolic Scaling Theory for estimating biomass from stem diameter is able to capture the mean tendency of allometric scaling in savanna trees.
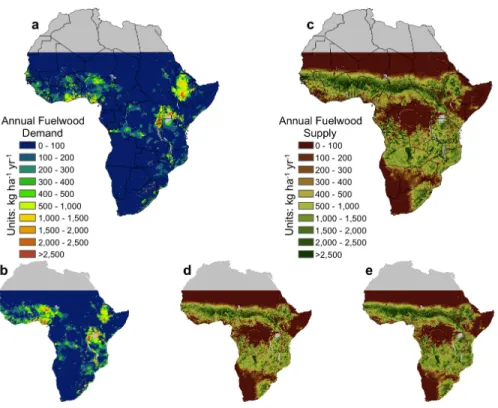
Chapters 3 and 4 present new analyses of fuelwood supply and demand at different spatial extents. In Chapter 3 I use satellite remote sensing and an extensive database to estimate wood biomass available for tree harvest in Mali, West Africa. My estimates, while associated with high uncertainty, show that wood biomass in Mali is greater than estimated from previous global and continental scale biomass mapping efforts. Chapter 4 builds on that approach to assess the patterns of fuelwood supply and demand for all of SSA. Using best-available fuelwood demand statistics, a growth model based on remotely sensed data, and current biomass estimates I created a series of maps, with associated uncertainties, showing the amount of wood needed by humans for energy in SSA and the amount produced annually. I estimate total annual wood demand is
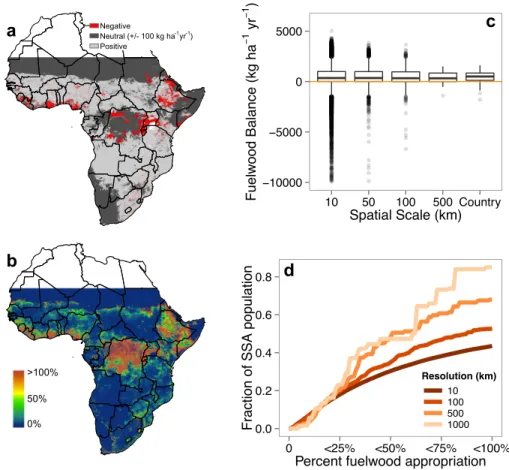
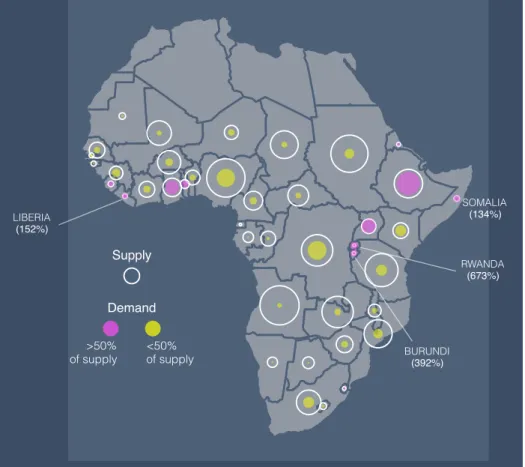
17-35% of annual wood production. But this varies greatly at local and regional scales. Regional fuelwood consumption varies from ~14-40% of annual wood production and localized areas in Central Africa, Ethiopia, and the west coast require greater than 100% of local production. In large urban centers, fuelwood appropriation of local production can exceed 1,000%. Though people are not limited to using local wood production, the areas in excess of 100% clearly require external inputs to meet local demand.
In Chapter 5 I present a theoretical analysis to explore if, on average and given our current knowledge of savanna systems, fuelwood harvest affects the stability of savanna and forest sys-tems. To do so I incorporate tree harvest into a population dynamic model of forest, savanna, and grassland vegetation dynamics. I use assumptions about the differential demographic responses of savanna trees and forest trees to harvest to show how tree harvest influences tree cover, demog-raphy, and community composition. Tree harvest can erode the intrinsic basin of attraction for forest and make a state transition via fire to savanna more likely. The savanna state is generally resilient to all but high levels of tree harvest due to the resprouting abilities of savanna trees. In the absence of active fire suppression my analysis suggests we can expect to see large and potentially irreversible shifts from forest to savanna as demand increases for charcoal in sub-Saharan Africa. On the other hand, savanna tree species’ traits seem likely to promote savanna stability in the face of low-to-moderate harvest pressure.
My dissertation work suggests that, overall, there is no large-scale fuelwood crisis in SSA and that in moderately populated savannas tree harvest is a sustainable livelihood practice. My applied work at the continental scale shows that local fuelwood shortages can be overcome if adequate mechanisms are in place to import wood from high production areas. This implies that fuelwood crises may proximately be an ecological issue, but ultimately fuelwood shortages are a social
and economic issue. My work allows for identification of localities in need of targeted socio-economic analyses and policy intervention at an unprecedented scale and extent. In savannas we find, based on well supported assumptions, that the savanna biome is generally resilient to tree harvest. However, our analysis suggests a demographic shift to low biomass tree sizes. Thus, even though savannas may be stable in the face of tree harvest, reductions in tree biomass on the landscape means there is less fuelwood available for human appropriation.
ACKNOWLEDGMENTS
I sincerely thank Niall Hanan for mentoring me over the past five years. He provided me the independence necessary to gain trust in my own abilities as a scientist while also providing critical assistance and advice when I (often) faced the edge of those abilities. I know of few advisors will-ing and able to work with a swill-ingle student on projects rangwill-ing from theoretical modelwill-ing to remote sensing to interviewing households, but Niall was more than up to the task. Niall’s healthy skep-ticism, scientific creativity, and relaxed demeanor are traits that I can only hope to have acquired over my years working with him. My co-advisor Kathy Galvin has broadened my thinking more than she knows, and more than is relayed in this dissertation. Thanks to her, I can never look at ecological systems without thinking about the complex human systems that depend on and influ-ence the ecosystems I study. Niall and Kathy are scholars of the highest caliber and I am proud to have been their student.
Mike Coughenour and Steve Leisz anchored my committee. Mike has made me a well-read scientist and broad thinker by challenging me during my preliminary exams. The stack of books he gave me on chaos, complexity, sustainability, and ecosystem ecology initially frightened me but later enlightened me. Steve’s remote sensing class gave me the foundation I needed to complete Chapter 3 and his suggestions always made me extend my skill set.
Along with my official committee, I had the great fortune of learning from the pool of exceed-ingly talented scientists at the Natural Resource Ecology Lab. In particular, my time at NREL was greatly enriched by Dave Swift and Tom Hobbs. Dave has a deep knowledge of African savannas and I am thankful he has passed some of that knowledge on to me. Dave was always there with a quick smile and a great conversation – I will always remember the stories he told me of NREL’s
early days. Tom Hobbs taught the most influential class I have ever, or will ever, take. His Systems Ecology class on data-model assimilation not only gave me an essential skill for answering the most difficult questions of contemporary ecology, it also helped me to solidify my philosophical views on models and uncertainty. His door was always open to me and I am extremely grateful for his guidance.
I owe my fond memories of graduate school to my fellow Graduate Degree Program in Ecology and Natural Resource Ecology Lab graduate students and post-docs. I have learned so much from so many peers and I can only hope our friendships and collaborations continue in the future. In particular, I have Kelly Hopping to thank for many excellent conversations about the intersections of ecology and society over coffee, and more generally for being a great friend. Shinichi Asao made me think deeply and clearly (not to mention fast) about many topics during our conversation and debates over beer. Justin Dohn proved an exceptional lab mate and I cannot think of another person I would rather had spent months with in Mali push-starting field vehicles. I also have the Knapp lab to thank for letting me join their lab meetings, especially Dave Hoover and Kevin Wilcox for reminding me science is supposed to be fun. There are too many others to mention, but I admire and am thankful to count as friends Megan Steinweg, Sarah Evans, Jessica Ernakovich, John Field, and Jared Stabach. Gabriela Bucini provided endless good cheer and her guidance on the processing of remote sensing data using IDL proved invaluable. Outside of the university, I owe Nick Van Lanen and Jonah Kliwer for keeping me sane during the final push of my graduate work.
In Mali, this work would not have been possible without support and guidance from Moussa Karembé and Fadiala Dembélé. I thank them for their essential assistance in the field and their knowledge of West African savannas. Many thanks to Salif Traoré for driving hours on end and
helping us fix the field truck in many different towns. Masaama Soumano and Labassoun Keita made my time in Bamako a joy and helped in all manners of logistics, including Labassoun acting as translator during household interviews.
My PhD work would not have possible without support from the National Science Foundation and NASA through grants to Niall Hanan, the NASA Earth and Space Science Fellowship program, the James Ellis Memorial Scholarship, the Natural Resource Ecology Laboratory, the Graduate Degree Program in Ecology, and, initially, my parents, who never made me write a proposal. During my final year, Peter Adler graciously provided me with a desk at Utah State University to finish writing this document.
I was fortunate to live near family during my PhD work. Their support was unwavering and their birthday parties a joy. I am particularly thankful to my brother and sister-in-law, Matt Tre-dennick and Sara TreTre-dennick, for always welcoming me in their home, being a constant source of support and laughter, and for taking genuine interest in my academic pursuits. My parents, Steve and Becky Tredennick, have supported by ecological interests for over ten years. Thanks to them I was able to study Costa Rican tree communities in high school and Kenyan savannas in college. They even put my publications on the refrigerator. They never doubted what I could achieve and I am thankful for them every day. My second family, the Nehring collective, has been extremely supportive over the years and I thank them for many great dinners and trips to Moab where I could could bike in the mornings and write in the afternoons.
Lastly, I owe so much to Kyle Nehring. Throughout my PhD she grounded my life outside of academia and helped me to achieve the always discussed yet rarely attained work-life balance. Her challenging questions and critiques of my work helped me to strengthen my arguments and better
communicate my science. I only hope I can provide her with the same combination of support and challenge as she undertakes her PhD.
TABLE OF CONTENTS
ABSTRACT . . . ii
ACKNOWLEDGMENTS . . . vi
1 Introduction . . . 1
2 Allometric convergence in savanna trees and implications for plant scaling models in variable ecosystems . . . 5
Summary . . . 5
2.1 Introduction . . . 6
2.2 Materials and Methods . . . 8
2.3 Results . . . 16
2.4 Discussion . . . 19
2.5 Conclusions . . . 24
2.6 Tables . . . 26
2.7 Figures . . . 28
3 Estimates of aboveground woody biomass in the savannas of Mali (West Africa) using moderate resolution satellite data . . . 31
Summary . . . 31
3.1 Introduction . . . 32
3.2 Study area . . . 34
3.3 Methods . . . 34
3.4 Results and Discussion . . . 39
3.5 Conclusions . . . 42
3.6 Tables . . . 43
3.7 Figures . . . 44
4 Sub-Saharan Africa’s fuelwood footprint: Current patterns of fuelwood supply and demand 47 Summary . . . 47
4.1 Introduction . . . 48
4.2 Methods . . . 49
4.3 Results and Discussion . . . 51
4.4 Conclusions . . . 53
4.5 Tables . . . 54
4.6 Figures . . . 55
5 Effects of tree harvest on the stable-state dynamics of savanna and forest . . . 58
Summary . . . 58
5.1 Introduction . . . 59
5.2 Methods . . . 61
5.3 Model Analysis and Results . . . 65
5.4 Discussion . . . 71 5.5 Conclusions . . . 75 5.6 Tables . . . 77 5.7 Figures . . . 78 6 Conclusions . . . 84 Literature Cited . . . 88
A Appendix for Chapter 4 . . . 103
A.8 Supplementary Methods . . . 103
A.9 Supplementary Tables . . . 112
Chapter 1
Introduction
A major challenge of contemporary ecology is to integrate uniquely anthropogenic processes into our fundamental understanding of population, community, and ecosystem dynamics (Keller et al. 2008, Cardinale 2013, Chapin III and Fernandez 2013). Thus, ecologists living in the An-thropocene (Crutzen 2002) are charged with bringing basic science to bear on applied ecological problems related to sustainability and ecosystem stewardship (Chapin III et al. 2010). At the fore of such efforts linking basic and applied ecology is work centered on forecasting the, often negative, impacts of climate change (e.g., Adler et al. 2012), biodiversity loss (e.g., Cardinale et al. 2012), invasive species (e.g., Levine and D’Antonio 2003), and land-use change (e.g., Foley et al. 2005) on ecological systems across levels of organization. However, human impacts need not always be negative, and in many ecosystems humans have been integral parts for millennia. In such cases our focus should be on i) the roles humans play in regulating ecosystem structure and function, and ii) under what conditions ecosystems can sustain continued human appropriation of ecosystem services. This is especially important in regions of the world where people depend directly on natural products to meet their basic human needs.
African savannas are a particularly compelling example of a biome influenced by humans on long time scales, as well as a biome that provides critical ecosystem services. Most evidence points toward African savannas being the origin of Homo sapiens evolution (e.g., White et al. 2003 and reviewed in Reid 2012), and recent work suggests humans have played a key role in regulating fire regimes in Africa from anywhere between 4,000 to 40,000 years before present (Archibald et al. 2012). Likewise, the dominant livelihood throughout much of Africa’s savannas, pastoralism, has persisted for centuries, mostly in concert with land and wildlife conservation (Galvin 2009, Galvin and Reid 2011, Reid 2012). Through the centuries of humans manipulating fire regimes as a range
management tactic and actively herding large mammals in Africa’s savannas, they have also been using wood biomass for the most basic of needs: cooking and heating.
Humans have likely used wood for energy for over 500,000 years (Sharpe 1976, Gowlett et al. 1981, Goren-Inbar et al. 2004), and it remains the primary energy source in sub-Saharan Africa (SSA) (Kebede et al. 2010, Sander et al. 2011) and in most developing and transition economies of the world. But compared to other human activities like pastoralism and active fire manipulation, the use of trees for wood is understudied. Several efforts focus on local-scale sustainability of fuelwood harvest in terms of deforestation (Shackleton 1993, Madubansi and Shackleton 2007, Morton 2007, Wessels et al. 2013), but rarely is tree harvest explicitly considered as an important ecological process that may influence savanna stability, structure, and function. Likewise, after receiving a large amount of attention during the ‘fuelwood crisis’ years of the 1970s and 1980s, large scale efforts to quantify fuelwood supply and demand ceased, and no contemporary analysis exists.
Currently, the highest resolution estimates of fuelwood supply and demand are at the national scale, calculated from UN Food and Agricultural Organization databases (e.g., Bailis et al. 2005). National-level studies, while informative, lack the spatial detail necessary to identify areas in need of targeted policy intervention. Local-scale studies are important for understanding the detailed drivers of fuelwood supply and demand at scales relevant to human use, but these studies are difficult to scale up and apply to other areas. The limitations of these two approaches calls for a “middle-of-the-road” approach that allows us to identify fuelwood scarcity ‘hotspots’ at relevant scales and spatial extents.
Though limited, available fuelwood demand statistics (Arnold et al. 2006) and applied research (Shackleton 1993; 2001, Ahrends et al. 2010, Wessels et al. 2013) do indicate tree harvest is a considerable disturbance in African savannas and forests. Yet, most ecological research over the past three decades has focused exclusively on herbivory and fire as key disturbances in tropical savannas and forests (see Scholes and Archer 1997, Sankaran et al. 2004, Bond 2008, for reviews). This focus, particularly on fire, has led to key insights into the role of demographic bottlenecks
in creating and maintaining the savanna biome (Higgins et al. 2000, Sankaran et al. 2005), and constraining forest and savanna as alternate stable states (Staver et al. 2011a;b, Hirota et al. 2011). The fundamental mechanism in mesic savannas is fire limiting the recruitment of tree saplings to adult life stages. It makes intuitive sense that harvest may also play a role in regulating the stability of forests and savannas because when trees resprout after harvest they go from being outside the flame zone (or ‘fire trap’) as adults to being back in the flame zone as coppicing saplings. Across the spectrum – from applied to theoretical work – more research is needed to fully understand the impacts of fuelwood harvest in savannas and forests.
The objective of my dissertation is to improve our overall understanding of the sustainability of tree harvest for fuelwood (firewood and charcoal) in SSA by focusing on the supply and de-mand of fuelwood as well as the ecological consequences of tree harvest in forests and savannas. Specifically, I sought to answer four questions:
1. Can universal allometric scaling theories provide a basis for estimating tree biomass across diverse savannas?
2. What is the current standing stock of tree biomass available for fuelwood harvest in Mali, West Africa?
3. What is the spatial distribution of fuelwood supply and demand across sub-Saharan Africa and in what areas does annual supply exceed annual demand?
4. Does tree harvest effect the stable-state dynamics of forest and savanna?
In each of the chapters that follow I use different approaches (theoretical, modeling, and empirical) at different spatial scales (local, regional, and continental) to answer my questions.
At the local scale, Chapter 2 tests the ability of ‘universal’ scaling theories to predict mor-phological traits of savanna trees existing under diverse resource environments and disturbance regimes. At the regional scale, Chapter 3 uses satellite remote sensing to estimate aboveground woody biomass in Mali, West Africa. At the continental scale, Chapter 4 uses a combination of
empirical and modeling approaches to estimate the current pattern of fuelwood supply and demand in SSA. Lastly, Chapter 5 takes a theoretical modeling approach to investigate the biome-level im-pacts of tree harvest on the stability of forest and savanna. In Chapter 6 I synthesize my findings and discuss how in combination my results show that fuelwood harvesting is a mostly sustainable livelihood strategy in African savannas.
Chapter 2
Allometric convergence in savanna trees and implications for plant scaling models in variable ecosystems1
Summary
Theoretical models of allometric scaling provide frameworks for understanding and predicting how and why the morphology and function of organisms vary with scale. It remains unclear, how-ever, if the predictions of ‘universal’ scaling models for vascular plants hold across diverse species in variable environments. Phenomena such as competition and disturbance may drive allometric scaling relationships away from theoretical predictions based on an optimized tree. Here, we use a hierarchical Bayesian approach to calculate tree-specific, species-specific, and ‘global’ (i.e. in-terspecific) scaling exponents for several allometric relationships using tree- and branch-level data harvested from three savanna sites across a rainfall gradient in Mali, West Africa. We use these ex-ponents to provide a rigorous test of three plant scaling models (Metabolic Scaling Theory (MST), Geometric Similarity, and Stress Similarity) in savanna systems. For the allometric relationships we evaluated (stem diameter vs. length, aboveground mass, stem mass, and leaf mass) the empir-ically calculated exponents broadly overlapped among species from diverse environments, except for the scaling exponents for length, which increased with tree cover and density. When we com-pare empirical scaling exponents to the theoretical predictions from the three models we find MST predictions are most consistent with our observed allometries. In those situations where obser-vations are inconsistent with MST we find that departure from theory corresponds with expected tradeoffs related to disturbance and competitive interactions. We hypothesize savanna trees have greater length-scaling exponents than predicted by MST due to an evolutionary tradeoff between
1This chapter is an edited version of Tredennick A.T., Bentley, L.P., and Hanan, N.P. 2013. PLoS One8, reproduced
here under a Creative Commons license.
fire escape and optimization of mechanical stability and internal resource transport. Future re-search on the drivers of systematic allometric variation could reconcile the differences between observed scaling relationships in variable ecosystems and those predicted by ideal models such as MST.
2.1 Introduction
One of the central goals of ecology is to identify and understand the underlying rules and mech-anisms that govern the form and function of orgmech-anisms. In particular, the existence of consistent allometric relationships across diverse taxa has led to theories that attempt to use physical first principles to predict biological scaling – that is, how organism traits vary with size. For plants, there are several ‘universal’ scaling theories that produce testable predictions including Metabolic Scaling Theory (MST; West et al. 1999), the Geometric Similarity model (GEOM; Niklas 1994), and the Stress Similarity model (STRESS; McMahon and Kronauer 1976) (Table 2.1). These mod-els all assume physical constraints to arrive at predictions of allometric scaling. However, given the variability inherent in many ecological systems, the utility of these idealized (i.e. “optimal”) models to predict real ecological phenomena (Koz´lowski and Konarzewski 2004, Muller-Landau et al. 2006) across multiple scales of inquiry (Tilman et al. 2004) has come into question (Coomes 2006, Muller-Landau et al. 2006, Coomes and Allen 2009, Price et al. 2009, Moncrieff et al. 2011, but see Brown et al. 2005, Stark et al. 2011).
Indeed, the extent to which variability and disturbances such as herbivory and fire may invali-date the allometric predictions of universal models based only on physical first principles remains uncertain. Since these models are based on optimizing assumptions about mechanical constraints that ignore the role of resources (GEOM and STRESS), or optimize resource distribution and plant uptake (MST) they may fail to predict scaling relationships in temporally and spatially heteroge-neous environments where resource uptake is constrained by resource limitation (Muller-Landau et al. 2006). Further, demographic processes may not be entirely resource-based in variable
envi-ronments where populations may be maintained in a non-equilibrium or disequilibrium state (Ellis and Swift 1988, Sankaran et al. 2005) by disturbances and resource pulses (Chesson et al. 2004). In these cases, selection for traits adaptive under conditions of spatiotemporal variability and distur-bance may be more important than selection for optimal mechanical or physiological architecture (Russo et al. 2007) – the only selective forces invoked by zero-order scaling models (seeMaterials and Methods: Scaling models).
Savannas therefore offer an interesting test case for universal scaling models because the dom-inant paradigms of savanna ecology invoke competition, environmental variability, and anthro-pogenic disturbances as mediators of tree cover and structure (Sankaran et al. 2004). Savannas are highly variable two-layer tree-grass systems broadly defined by a discontinuous and dynamic tree layer with a continuous herbaceous layer (Ratnam et al. 2011). Climate plays an integral role in constraining potential tree cover of savannas, but realized tree cover is highly variable in space and time (Sankaran et al. 2005). Moreover, tree biomass and architecture may vary in savannas based on the magnitude and extent of disturbances such as browsing (Moncrieff et al. 2011) and fire (Archibald and Bond 2003). Inter- and intra-annual variability in precipitation, competition for water, and multiple disturbances including fire, herbivory, and tree harvest establish broad en-vironmental gradients and create conditions that may select for modified allometries and lead to greater allometric variation at the level of individuals and species.
To test the ability of universal scaling models (MST, GEOM, and STRESS) to predict whole-tree and within-whole-tree allometric relationships in variable systems we examine allometric scaling relationships for three tree species from three savanna sites in West Africa. We use a hierarchical Bayesian (HB) approach to estimate scaling parameters (a, the normalizing constant, and b, the scaling exponent) from the general allometric equation,
Y = aXb (2.1)
a power-law. In this analysis we treat branch (or basal) diameter as the independent variable (X)
and calculate its relationship with four branch (or tree) traits: 1) length, 2) aboveground mass, 3) stem mass, and 4) leaf mass (Ys in Equation 2.1). We evaluate the competing scaling models by comparing our empirical estimates to theoretical predictions. All are power-law models that make specific predictions (Table 2.1) for the scaling exponent b (Equation 2.1) relating plant morphology (Y, e.g. length, mass) to plant size (X, e.g. diameter).
Specifically, the objectives of our study are to determine: 1) if tree species in savannas exhibit similar scaling relationships for length, aboveground mass, stem mass, and leaf mass; 2) if there is more variability in scaling relationships among or within species; and 3) if the scaling exponents derived from our combined branch and tree data support or reject MST and/or other scaling model predictions. Our main hypothesis is that since universal scaling models make idealizing assump-tions regarding plant architecture and the environment within which plants live, we will observe deviations from model predictions for an idealized network structure since savanna trees must re-spond to variable environmental conditions. To assess this hypothesis we proceed in two stages: 1) identify the “best” model as the model (MST, GEOM, or STRESS) with the most predictions included within our calculated 95% credible intervals for each scaling relationship; and 2) interpret any deviations from the best model by considering how factors specific to savanna systems may interact with the idealizing assumptions of the theoretical model to cause allometric deviations.
2.2 Materials and Methods
2.2.1 Field data
We collected data from three savanna sites that span the tropical rainfall gradient in Mali, West Africa. The sites vary in mean annual precipitation, tree architecture, canopy cover and height, fire frequency, grazing intensity, and species composition (Table 2.2). Across the sites mean annual precipitation ranges from 570-1,400 mm yr 1(north to south) and fire frequency ranges from 0.9 yr 1at the northernmost site (Lakamané) to 0.35 yr 1at the southernmost site (Tiendéga). Large, wild herbivores are effectively absent in West African savannas, but each site does receive some
level of grazing by cattle and browsing by goats (Table 2.2). At each site, we chose ten trees of the dominant species for harvest, except at one site (Tiorola) where we only harvested five individuals. We felled each tree and for every branch with a diameter greater than or equal to 2 cm measured: 1) branch (or basal) diameter within 5 cm of the branch points (or within 10 cm of the soil for basal measurements), 2) length, 3) wood wet weight, and 4) leaf wet weight. We took subsamples of main stem (i.e. trunk) wood (one sample per tree) and leaves (approximately 30g wet weight per tree) to obtain species-specific dry:wet weight ratios used to account for the contribution of water content to wet weights of wood and leaf. We aggregated biomass data by branch. That is, the biomass (leaf, wood) of each daughter branch was summed for each parent branch to ensure all biomass downstream of any particular branching node is attributed to that branch’s diameter. Since not all trees had branches with diameters greater than 2 cm we only used dry:wet weight ratios from the trunk, but for trees where we took sub-samples of trunk and branch wood there is a near 1:1 relationship between trunk and branch dry:wet weight ratios (data not shown) indicating there is no systematic variation in dry:wet weight ratios with regards to branch order. The dataset contains observations for 25 individual trees composed of 286 branches (including main stems) representing three savanna tree species: Deterium microcarpum Guill. and Perr. (ntree= 10; nbranch = 103), Combretum geitynophylum Loefl. (ntree = 5; nbranch = 30), and Combretum glutinosum Perr. (ntree = 10; nbranch = 128). We conducted the subsequent analysis using a combined dataset comprised of tree and branch data. Each branch, including the main stem or whole-tree, is treated as an observation and is indexed by tree and species (seeData analysis: hierarchical Bayesian model).
All necessary permits were obtained for the described field studies. All field sites are in pub-lic lands administered by the Malian Nature Ministry (Departement des Eaux et Forets). Data collection at field sites was made possible through a memorandum of understanding covering the creation and long-term operation of the sites. Field data collection did not involve or cause harm to any endangered or protected species.
2.2.2 Scaling models
The MST botanical model by West, Brown, and Enquist (WBE; West et al. 1999) postulates rules that govern plant branching architecture and can serve as a baseline for variation in plant form. In so doing, this model invokes the existence of, and selection for, optimally branching resource distribution networks (e.g. plant vascular systems). In particular, the original WBE model of plant architecture proposes that vascular networks have evolved to minimize hydrodynamic resistance and to maximize the scaling of exchange surfaces such as leaves (West et al. 1999, Enquist 2002). Quarter-power scaling then emerges as a consequence of these physiological goals and physical constraints related to buckling (West et al. 1999). Based on these assumptions, MST makes specific predictions for the scaling of branch/tree length/height (l) and total aboveground biomass (M) with branch (or basal) diameter (D) (Table 2.1). Further developments by Enquist and Niklas (2002) predict the allocation of total biomass to leaf mass (L) and stem mass (S) within the plant based on size (Table 2.1). If ‘space-filling’ and ‘area-preserving’ are the primary evolutionary drivers of network architecture across taxa and resources are homogeneously distributed, then WBE scaling exponents should be identical across divergent taxa that may differ functionally due to other traits (Enquist and Bentley 2012).
In addition to MST, we also evaluate two other scaling models that invoke biophysical limita-tions to derive scaling exponents from first principles. As in Price et al. (2009), we consider the Stress Similarity model (STRESS; McMahon and Kronauer 1976) and the Geometric Similarity model (GEOM; Niklas 1994). The STRESS model assumes that for a trunk or branch there is a constant maximum biomechanical stress level maintained throughout (McMahon and Kronauer 1976). This assumption is based on engineering principles of stress levels in beams necessary to resist buckling. GEOM has been considered a null model of plant scaling (Price et al. 2009) and it assumes length and radius (or diameter) scale isometrically (i.e., lµ D, leading to bl = 1). These models (MST, GEOM, and STRESS) all make predictions assuming an allometrically ideal plant, that is, a plant that follows the assumptions laid out by any given general theory of allometric
scaling. An ideal plant is then model-specific. Thus, we refer to any given model prediction as an “ideal” prediction.
We do not explicitly consider the elastic similarity model (ELAS) (McMahon 1973, McMahon and Kronauer 1976) because the original fractal-branching model of WBE includes the assumption of elastic similarity (West et al. 1999) and thus MST and ELAS make similar predictions for the scaling of mass and length with tree diameter (Enquist and Niklas 2002, Price et al. 2010). Also, we do not consider models of increased complexity, such as the PES model described by Price et al. (2009) or models that include competitive interactions such as proposed by Muller-Landau et al. (2006) or Rüger and Condit (2012) because our goal is to focus on simple, universal scaling models that do not need specific environmental data. Specific allometric predictions for all models are in Table 2.1.
2.2.3 Data analysis: hierarchical Bayesian model
We used a hierarchical Bayesian (HB) approach to simultaneously estimate multiple scaling relationships using the general allometric power-law in Equation 2.1 where Y is the dependent variable or plant trait/characteristic, X is branch (or basal) diameter (hereafter D in equations), a is a normalizing constant, and b is the scaling exponent. Parameters were fit using the log-form of Equation 2.1:
log(Y ) = log(a) + b ⇥ log(D), (2.2)
because recent work suggests biological power-laws are best characterized assuming multiplicative error distributions (Kerkhoff and Enquist 2009, Xiao et al. 2011).
The hierarchical Bayesian approach allows us to explicitly model measurement error on in-dependent variable D and allows for under-represented species to borrow statistical strength by assuming the allometric parameters come from some global population. Moreover, our approach allows us to simultaneously estimate tree, species, and interspecific level scaling parameters using
partial pooling (Gelman and Hill 2009).
To account for measurement error in diameter (D) for each observation i we used a Berkson “error-in-variables” model assuming 5% error on at least 5% of trees (Dellaportas and Stephens 1995) and used conditioning parameters from Price et al. (2009) to inform the prior error distribu-tion,sr. We assumed measurement error to be log-normally distributed as:
log(ri) ⇠ N ⇣
log(Di),sr2 ⌘
, (2.3)
whereriis the latent (“true”) diameter for observation i andsr2is the measurement error variance. We used a multivariate normal likelihood to estimate the parameters of several scaling relationships simultaneously (Price et al. 2009):
2 6 6 6 6 6 6 6 4 log(li) log(Mi) log(Li) log(Si) 3 7 7 7 7 7 7 7 5 ⇠ N 0 B B B B B B B @ 2 6 6 6 6 6 6 6 4
log al,s(t(i)) bl,s(t(i)) log aM,s(t(i)) bM,s(t(i))
log aL,s(t(i)) bL,s(t(i)) log aS,s(t(i)) bS,s(t(i))
3 7 7 7 7 7 7 7 5 2 6 4 1 log(ri) 3 7 5,S 1 C C C C C C C A , (2.4)
where a’s are normalizing constants and b’s are scaling exponents for the relationships between l (branch length), M (total aboveground biomass), L (leaf biomass), or S (stem biomass) and r, and S is a 4 ⇥ 4 covariance matrix. Subscripts i, t, and s refer to observation, tree, and species respectively and s(t(i)) indicates “species s associated with tree t associated with observation i”.
As suggested by the subscripts, our analysis includes a hierarchical structure to explicitly ac-count for the nested structure of our dataset (i.e. branches nested within individual trees; trees nested within species). Specifically, we account for data dependencies within species and within trees. We account for the fact that all branches within a given tree are related by including a “tree level” in the HB model (denoted by subscript t), but we do not account for specific parent-daughter branch relationships. Adding the amount of layers necessary to account for such dependencies in our hierarchical model is unreasonable due to our relatively small sample size. We acknowledge
this limitation but we believe the three-level structure described below is sufficiently conservative. Note that “tree level” does not refer to scaling exponents calculated using whole-tree data, but rather the tree level of the HB model.
Scaling exponents for the relationships between l, M, L, and S and D were calculated using the full dataset combining branch and whole-tree data at both a tree, species, and population level. Thus, for variable Y (Y = l, M, L, or S) and species s associated with tree t, the tree-level parameters, as(t)and bs(t), are hierarchically drawn from species-level parameter distributions with prior:
aY,s(t) ⇠ N ¯aY,s,s2¯aY ,
bY,s(t) ⇠ N⇣¯bY,s,s¯b2Y ⌘
, (2.5)
where aY,sand bY,s are the intraspecific (species-specific) normalizing constants and scaling coef-ficients, ands2
¯aY ands¯b2Y are the within species variances describing tree-to-tree variability in the
parameter. To assess the overall tendency of the model coefficients regardless of species but while still explicitly accounting for multiple sources of error (partial pooling) we define ¯aY,sand ¯bY,s as coming from an overall ‘global’ population (Price et al. 2009):
¯aY,s ⇠ N AY,sA2Y ,
¯bY,s ⇠ N BY,sB2Y , (2.6)
where A and B are the interspecific, population-level normalizing constant and scaling exponent, respectively. The variance terms (s2
AY and s
2
BY) describe the variability among species for both
parameters. All priors (for error terms and the hyper-parameters A and B) were chosen to follow non-informative, uniform distributions (Gelman 2006). We used a non-informative Wishart distri-bution for the precision matrix (S 1) in Equation 2.4 (Dietze et al. 2008, Gelman and Hill 2009, Price et al. 2009).
We used Markov chain Monte Carlo (MCMC) methods to estimate the joint posterior distribu-tions of each parameter as implemented using JAGS (Plummer 2003) within the statistical package
‘R’ (R Development Core Team 2012). Three parallel MCMC chains were run with only the co-variance matrixS initially estimated to define the structure of the matrix. We obtained 1,000,000 iterations of each chain, thinned by 10, after discarding an initial 200,000 iterations as burn-in. We achieved convergence of MCMC chains as assessed using the Heidelberger (Heidelberger and Welch 1983) diagnostic within the ‘coda’ package of ‘R’ (Plummer et al. 2010).
Since our hypothesis is that environmental factors will influence plant allometries we also con-ducted the analysis above with additional explanatory variables from Table 2.2. We took two approaches: 1) we included mean annual precipitation, fire frequency, and percent tree cover as potential explanatory variables in Equation 2.4 (similar to the approach taken by Rüger and Condit (2012)), and 2) we included mean annual precipitation, fire frequency, and percent tree cover as hyperparameters in a regression equation that served as a prior for the species-specific normalizing constant (aY,s) in Equation 2.5. However, for both cases the posterior distributions for the coeffi-cients of each variable (except diameter) broadly overlapped zero and r2 values did not increase. Likewise, some parameters in our HB model did not achieve convergence with the extra variables included. This is most likely because the environmental variables (specifically mean annual precip-itation and fire frequency) in Table 2.2 are taken from continental-scale, coarse-resolution remote sensing datasets. Even though those factors may be important for tree allometries in savannas, the data are not highly resolved enough to be statistically important.
2.2.4 Data analysis: posterior predictive checks
To check HB model fit we take a simple approach comparing replicated datasets as simulated from the model to the data that were used to estimate parameters (Gelman and Hill 2009). If the distribution of the simulated data is not congruent with the distribution of the real data then there may be problems with the model itself or with the prior probability distributions (Hobbs et al. 2012). Here we use posterior predictive checks (Gelman and Hill 2009) that use a test statistic from the replicated data (Trep) and an identical test statistic from the real data (Tobs; following the notation of Hobbs et al. (2012)). Using these test statistics we test for lack of fit by calculating PB,
the probability that the replicated data is more extreme than the real data:
PB = Pr ⇣
Trep(yrep,q) Tobs(y,q)|y⌘, (2.7)
where q is the vector of power-law parameters (a and b). The model shows lack of fit if PB is near 0 or 1, since it is a two-tailed probability (Gelman et al. 2004). Values nearer 0.5 indicate no lack-of-fit. To assess goodness-of-fit we calculate correlation coefficients (r2) between observed and replicated datasets. For our log-log regressions we used two test statistics, one to assess the ability of the model to capture the mean tendency of the data (Equation 2.8), and a second to assess the model’s ability to portray the variation in the data (Equation 2.9). For each trait (length, mass, leaf mass, and stem mass) we used:
Tobs= Â N i=1Yi N , Trep= ÂN i=1Yirep N , (2.8) and Tobs= N
Â
i=1 (Yi µi)2 µi , T rep=Â
N i=1 Yirep µi 2 µi , (2.9)where Yiis the real data, Yirepis the replicated data, andµiis the model prediction for length, mass, leaf mass, or stem mass. Essentially, Equation 2.9 uses a sums-of-squares approach to evaluate model fit (Hobbs et al. 2012). We refer to the corresponding PB values as PBmean and PBf it for Equations 2.8 and 2.9, respectively.
2.2.5 Data analysis: scaling model and exponent comparison
To compare the scaling models (MST, STRESS, and GEOM) we examined the mean, median, and 95% credible intervals (CIs) of the posterior distributions of the global exponents for scaling parameters estimated by our HB model. If a theoretical prediction is included in the 95% CI, then we consider that model supported by the data. More specifically, when the predicted parameters
of one of the scaling models fall within the CI of the empirical observations, that model cannot be excluded. We calculate the percentage of all CIs (at all hierarchical levels) that include the theoretical prediction of each model. We consider the scaling model with the highest percentage of inclusion to be the best model.
To compare scaling exponents for a particular relationship among species we examined the overlap of the 95% CIs. Further, we used the HB model to estimate the posterior distribution of the difference between exponents. We then used this distribution to calculate the probability that a difference between two exponents is greater than zero.
2.3 Results
2.3.1 HB model evaluation
All models explain 84% of the variation for a given trait (Table 2.3). Posterior predictive checks show the HB model is capable of replicating data consistent with the mean of the observa-tions, with all Pmean
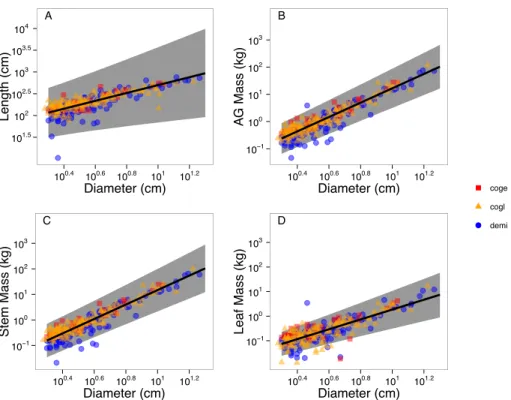
B values near 0.5 (Table 2.3). However, the HB model is less able to accurately replicate the variability inherent in the observed data since all PBf itvalues are nearer to 1 or 0 than PBmean values (Table 2.3). In particular, when predicting diameter—length scaling there is much unaccounted variability (PBf it = 0.048). This greater variation in model fit for length and leaf mass scaling compared to aboveground mass and stem mass scaling is also reflected by lower r2 values (Table 2.3). Raw data and fitted ‘global’ level allometries are shown in Figure 2.1.
2.3.2 Scaling exponents: tree, species, and ‘global’ levels
Within-trees there is considerable branch-level variability as indicated by the 95% CIs associ-ated with tree-level means (Figure 2.2). Tree-to-tree variability of scaling exponents within species is extremely low for each trait scaling relationship (Table 2.4 and Figure 2.2 ‘Tree and branch level’). Only the scaling exponents for leaf mass scaling show substantial tree-to-tree variability (Figure 2.2D).
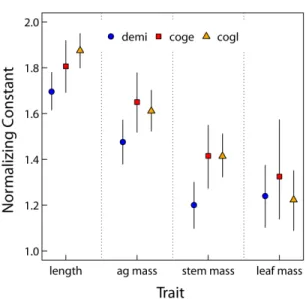
At the species level, only length scaling exponents show any interspecific variability. Fitted length scaling exponents are greater than predicted by MST and increase with mean annual pre-cipitation (Figure 2.2A, ‘Species level’ and Table 2.2). Importantly, for the species on the extreme ends of the savanna gradient we sampled (D. microcarpum and C. glutinosum), there is a 99% probability that the difference between length scaling exponents is greater than zero (Figure 2.3). There is 76% probability the scaling exponents for D. microcarpum and C. geitynophylum are dif-ferent, and a 92% probability the scaling exponents for C. geitynophylum and C. glutinosum are different (Figure 2.3). Similarly, the length-scaling normalization constants also show a directional trend, but with D. microcarpum having the lowest value and C. glutinosum having the highest value (Figure 2.4).
Given the low variance at the tree-level, species-specific exponents have 95% CIs that are primarily driven by branch-level variance, not tree-level variance. For example, for all trait scaling relationships and all species the average difference in CI width between the tree level and the species level is 0.037. However, species-level variance is greater than tree-level variance (Table 2.4). Except for the leaf mass scaling relationship, the normalization constants of D. microcarpum are lower than that of C. geitynophylum and C. glutinosum (Figure 2.4) and the 95% CIs do not overlap the means.
The combination of branch-level variability (95% CIs on tree means) and variability among species results in wide 95% CIs at the ‘global’, interspecific level (Figures 2.1 and 2.2). Tree-level variability does not contribute greatly to interspecific variation since that variance is low (Table 2.4). The ‘global’ means and associated 95% CIs indicate the overall distribution from which subsequent levels (tree and species) are derived. These distributions serve as indicators of ‘naturally possible’ scaling exponents regardless of species.
The scaling exponents arising from our dataset are generally consistent with those calculated in other studies using a diversity of species and tree functional types. For example, diameter-length scaling exponents tend to fall between values of approximately 0.3 – 0.8 (Muller-Landau et al. 2006, Dietze et al. 2008, Price et al. 2009, Moncrieff et al. 2011) and diameter-aboveground
biomass scaling exponents tend to fall between approximately 2.0 – 3.0 (Enquist 2002, Muller-Landau et al. 2006, Price et al. 2009). Few studies have examined the scaling of diameter to stem or leaf biomass specifically. But, our results for stem and leaf biomass scaling are consistent with those presented by Enquist and Niklas (2002) in their initial derivation of the proposed MST exponents. Likewise, our results for leaf mass scaling are broadly consistent with those presented by Price et al. (2009), using 2,362 individuals from over 100 species, that show leaf area scaling exponents (which are equivalent to leaf biomass exponents under the assumption that leaf biomass and area scales isometrically) to be in the range of approximately 1.3 – 2.8.
2.3.3 Scaling exponents: empirical support for theoretical scaling models
The wide 95% CIs at the ‘global’, interspecific level precludes the exclusion of any of the the-oretical scaling models. However, the universal models we evaluated make predictions assuming species-specific normalizing constants that influence the scaling exponents (Enquist and Bentley 2012). Therefore, it is important to evaluate the models with reference to all the levels in our HB model (the tree and species levels). At the tree and species levels, GEOM is most supported for length scaling and MST under predicts the length scaling exponents (Figure 2.2A). MST is gen-erally supported for aboveground mass scaling with STRESS receiving nominal support (Figure 2.2B). MST and GEOM make predictions for biomass partitioning and they perform reasonably well but with MST tending to under-predict and GEOM tending to over-predict wood-mass scal-ing (Figure 2.2C). For leaf-mass scalscal-ing MST and GEOM are equally well supported (since the predictions are identical) given their abilities to capture the means (Figure 2.2D). For all scaling re-lationships, and including all hierarchical levels (29 calculated exponents per scaling relationship), MST predictions are included in 75% of the credible intervals and GEOM predictions in 57%. For the two scaling relationships that all three models predict (length and aboveground mass) MST predictions are included in 70% of CIs, GEOM in 33%, and STRESS in 52%.
2.4 Discussion
Departures from the ideal predictions of scaling models that do not include environmental factors and variability are to be expected in natural settings where local conditions may select for modified allometries. As such, our goal was to evaluate the extent to which variable environments result in departures of tree allometries from ideal predictions. The ability to determine appropriate allometric relationships in trees is critical to scaling carbon and water fluxes from the leaf to the ecosystem level. Since there is an urgent need to better understand terrestrial dynamics of West African savanna ecosystems in light of current land use change (Anyamba and Tucker 2005) and future climate change (Held et al. 2005), here we calculated scaling exponents and tested the utility of popular allometric scaling models in these systems. Since savannas have variable rainfall, fire, and herbivory regimes, we aimed to determine if theoretical models of plant form based in metabolic and mechanical scaling models could successfully be used in these ecosystems to scale allometries.
2.4.1 Allometric convergence among and within savanna trees
Despite differences in bottom-up (mean annual precipitation, light availability) and top-down (fire, herbivory) forces important to savanna trees (Sankaran et al. 2004, Hanan et al. 2008, Hoff-mann et al. 2012, Staver et al. 2012), tree and branch scaling from three species from three sites appear to converge on similar mean allometries describing stem length, total above ground biomass and the stem and leaf mass components of total aboveground biomass (Figures 2.2 and 2.4). Thus, it appears that scaling characteristics in savanna trees converge on mean relationships among and within trees, indicating that some set of universal scaling rules applies. While the mean scaling exponents overlap among trees, there are different amounts of variation associated with exponents at each hierarchical level as discussed below.
Across all species, the most variability in exponent estimations exists around the tree and branch level scaling exponents (Figure 2.2, ‘Tree and branch levels’ 95% CIs). This indicates
that branches may have a greater “scaling space” (Sperry et al. 2012) than trees due to different limitations on mechanical strength and resource transport related to network size. For example, saplings tend to violate the MST assumption of a space-filling branching, and thus elastic sim-ilarity (McMahon and Kronauer 1976, Niklas and Spatz 2004), and there is evidence branches violate this assumption as well (von Allmen et al. 2012). Likewise, it is important to note that had we included branches smaller than 2 cm in diameter our exponent estimates may have been more variable. von Allmen et al. (2012) show that branches where diameter (D) is less than 2 cm tend to violate the elastic similarity assumption. As such, our results are biased toward branches and stems that meet the elastic similarity assumption.
With regard to exponents, the greatest variation among and within individual trees occurs in the leaf mass scaling exponents (Figure 2.2D, ‘Tree and branch levels’). It is well known that leaf area and biomass are variable in space and time at a variety of scales (Sultan 2000, Osada et al. 2001, Myneni et al. 2007). Thus, leaf biomass may be more plastic in response to micro-environmental conditions than other wood-based traits (aboveground and stem mass and length) that are more tightly linked to diameter through mechanical constraints (McMahon and Kronauer 1976) and metabolic efficiency (West et al. 1999). Discovering how micro-environmental conditions and tree size interact to produce tree- and branch-specific allometric relationships, and the width of allowable allometries, is an important avenue for future research.
2.4.2 Empirical support for theoretical scaling models
Previous tests of ‘universal’ scaling models of plant form and function have found only limited empirical support for the theoretical models considered here (Muller-Landau et al. 2006, Dietze et al. 2008, Price et al. 2009, Moncrieff et al. 2011, Rüger and Condit 2012). Our analysis shows that none of the models tested (MST, GEOM, and STRESS) can be definitively excluded at the ‘global’, interspecific level (Figure 2.2), though the models do differ in overall performance at the species and tree levels as also found in a comprehensive analysis by Price et al. (2009). This is particularly interesting given the broad climate and disturbance gradient from which the data
were gathered, the diversity of species considered (Table 2.2), and the fact that we tested these models using branch-level data. In aggregate, however, MST outperforms STRESS and GEOM in predicting the scaling relationships we observed across all levels (Figure 2.2). Many other studies also report support for the predictions and assumptions related to external branching architecture as defined by WBE and MST. For example, area-preserving branching has been widely reported (Shinozaki et al. 1964, Leopold 1971, Barker et al. 1973, McMahon and Kronauer 1976, Bertram 1989, Day and Gould 1997, Horn 2000, Sone et al. 2005, Renton et al. 2006, Dahle and Grabosky 2010, Costes and Guédon 2012), and recent studies find empirical support for elastic similarity (von Allmen et al. 2012) and self-similarity (Bentley et al. 2013). However, since the length-scaling exponents are most consistent with the predictions of GEOM (Figure 2.2), it will be important for future research to focus on the underlying assumptions of the competing models (Price et al. 2012). Only then can we truly identify departures from model predictions, as opposed to comparing data to an incorrect or incomplete model.
It is important to note that we did not consider models of differing complexity. Several au-thors have begun to relax MST assumptions (Price et al. 2007) or include competitive interactions (Muller-Landau et al. 2006, Rüger and Condit 2012) to better account for diversity in botanical form and function (Price and Weitz 2012). These more complex models have been shown to pro-vide better fits to empirical data (Price et al. 2009). Though we did not evaluate such models here, since our focus was on strictly universal models and we did not have adequate data, it is likely they would outperform the models we did evaluate. Nonetheless, our analysis does indicate MST may best capture the underlying constraints on allometric relationships, so extensions of it may prove most useful (Price and Enquist 2007, Price et al. 2007).
2.4.3 Implications for MST in ‘non-ideal’ systems
Given the data in hand and the competing scaling theories we tested, we consider MST the ‘best’ model since its predictions were included in the greatest percentage of credible intervals
(seeResults). If MST is considered the ‘best’ model, what can we conclude regarding deviations from MST predictions?
The most striking deviation from MST predictions occurs in the scaling of diameter to length (Figure 2.2A) where MST shows a strong trend for under predicting the scaling exponent. In con-cert with this deviation from the MST prediction, the length-scaling parameters display a clear directional trend among species: the exponents increase with mean annual precipitation and tree cover (Table 2.2, Figures 2.2A and 2.3) while the normalization constants decrease (Figure 2.4). The normalization constants absorb some of the environmental variation among sites, as predicted by MST (Enquist 2002) and reflected in our analysis (Figure 2.4), but not enough to produce convergent exponents. We consider this variation among species’ scaling exponents to represent an ecologically important deviation from MST and hypothesize that the following biological pro-cesses may differentially influence the scaling of tree height and branch length in savannas at multiple levels: 1) long-term adaptation to fire in savanna trees, and 2) differences in the inten-sity of resource competition among sites. Environmental factors such as fire frequency, woody cover (proxy for light competition), and mean annual precipitation were not statistically impor-tant in our model, but, as discussed previously, this was likely due to the spatial resolution of the environmental data as opposed to their lack of importance.
Fire plays a critical role in regulating savanna structure by constraining recruitment of juvenile trees into adult classes (Hanan et al. 2008). As such, fire is a strong selective force in savannas (Bond and Keeley 2005, Bond et al. 2005, Bond 2008, Staver et al. 2011a;b), and trees in fire-prone ecosystems may benefit from rapid vertical growth to escape the fire zone (Gignoux et al. 1997, Archibald and Bond 2003, Hoffmann et al. 2003). Therefore, we would expect, and our data shows, length-scaling exponents to trend toward values greater than expected from MST. As has been suggested before (Archibald and Bond 2003, Hoffmann et al. 2003; 2009), we hypothesize that savanna trees have evolved, via natural selection, to allocate growth toward height or branch length at the expense of mechanical stability and optimization of resource transport. Fire is a selective force in savannas that overrides the first-order optimization of plant vascular networks in response
to physical (water and nutrient transport) and mechanical (buckling) constraints. All species in our dataset reflect the allometric influence of fire toward a greater exponent, even while showing some interspecific variability (Figure 2.2A). Trees in South African and Brazilian savannas have shown qualitatively and quantitatively similar allometric trends (Archibald and Bond 2003, Dodonov et al. 2011, Moncrieff et al. 2011), suggesting a universal trade-off in savannas between fire escape and mechanical stability and optimization of resource transport.
While fire can explain overall deviation from the MST prediction, multiple selective pressures related to resource competition may be operating simultaneously at the intraspecific level (Figures 2.4A and 2.4). For example, light has been shown to influence forest tree allometries (Muller-Landau et al. 2006) and predictions based on optimal partitioning theory indicate that plants in reduced sunlight shift allocation toward height to gain a competitive advantage for light capture (McConnaughay and Coleman 1999). Since our calculated intraspecific exponents for length scal-ing increased with precipitation and woody cover (Table 2.2, Figures 2.2A and 2.3), our results are consistent with this theory. In dense savannas, as in forests, the competition for light may select for modified allometries with scaling exponents for diameter vs. height/length greater than 0.67 as observed here (Figure 2.2A). However, light competition in savannas has received very little attention, and water may still be the limiting factor. In that case we would not expect a light re-sponse in allometries. The directional trend observed among species could also be explained by an interaction between a bark thickness—height growth tradeoff and access to resources. Work in African, Australian, and Brazilian savannas suggests top-kill/mortality of savanna trees due to fire is most correlated (negatively) with bark thickness (Gignoux et al. 1997, Hoffmann et al. 2009, Lawes et al. 2011). Thus, Lawes et al. (2011) argue that fire escape height is better conceived as the height required to attain bark thick enough to resist fire damage; as opposed to simply being tall enough to avoid branch inflammation. Trees in fire-prone savannas must invest biomass in bark growth at the expense of height growth (Lawes et al. 2011). It follows, then, that this trade-off may be more pronounced in arid savannas where moisture is more limiting to overall growth. Then, as observed in this study, the fire response in arid savannas would lead to lower length-scaling
exponents than in more mesic savannas (Figure 2.2A). This proposed interaction among height (or length), bark thickness, and resource availability has yet to be thoroughly investigated (but see Gignoux et al. 1997).
In addition to light availability and fire frequency, browsing can also lead to intra and in-terspecific variation of length scaling and has been shown to influence savanna tree architecture (Archibald and Bond 2003, Moncrieff et al. 2011, Staver et al. 2012). Our dataset did not come from sites with large browsers, but interestingly, length-scaling exponents calculated for South African savanna trees protected from and exposed to large browsers (e.g., giraffe) are remarkably similar to our estimates (in the range of 0.57-0.74; Moncrieff et al. 2011). Moncrieff et al. (2011) do show that browsing can decrease length-scaling exponents below both our calculated value and the MST predicted value. However, the deviations from MST observed by Moncrieff et al. (2011) on trees subject to browsing may reflect near-term physiological responses to mechanical damage rather than long-term adaptations in growth strategy as proposed here.
2.5 Conclusions
Ultimately, observed plant allometries in any system will reflect some combination of multiple trade-offs that may be difficult to capture in general theories of plant form and function, such as MST. Deviations from the predictions of MST make intuitive sense when we consider the multiple costs, benefits and selective forces active in savannas. While plant architecture may reflect, in part, the morphological adaptations that optimize the efficiency of resource transport, when subject to selective forces unrelated to transport (e.g. mortality of shorter individuals in fire, or competition with neighbors for light) we can anticipate selection of traits (e.g. longer branch node-lengths) that balance the benefits of ’escape’ from fire and competition with the potential mechanical and transport ’costs’ associated with longer and thinner branches. However, unlike Moncrieff et al. (2011) who conclude that general theories including MST may be “neither general nor predictive in systems with frequent disturbance”, we find that, even in disturbance-prone savannas, MST is
generally consistent with observations (i.e. allometries for leaf, stem, and total mass). Further, in those situations where observations are inconsistent with MST (i.e. stem length) we find that departure from theory corresponds with expected tradeoffs related to disturbance and competitive interactions. Thus, we suggest two future research priorities: 1) detailed studies that empirically test the validity of model assumptions related to length scaling and 2) theoretical work aimed to-ward quantitatively predicting the magnitude and direction of allometric modifications in response to selective drivers other than core physical principles. In combination, such work could lead to an improved plant scaling model that best represents observed scaling relationships in variable ecosystems.
2.6 Tables
Table 2.1: Model predictions for scaling exponents (b).
Scaling Model Length Aboveground Mass Stem Mass Leaf Mass
Metabolic Scaling Theory (MST) 2/3 8/3 8/3 2
Stress Similarity (STRESS) 1/2 5/2 NA NA
Geometric Similarity (GEOM) 1 3 3 2
Note: The scaling exponents all refer to b in Equation 2.1 where the dependent variable (X) is diameter. For example, the 2/3 in the upper-left cell shows that under Metabolic Scaling Theory
length is proportional to diameter to the 2/3 power (lµ D2/3).
Table 2.2: Site characteristics.
Site Species MAP(mm y 1)
Woody cover (%) Domestic animal density Fire frequency (y 1)
Tiendéga Detarium microcarpum 1400 60.3 Low 0.35
Tiorola Combretum geitynophylum 1200 61.3 Medium 0.5
Lakamané Combretum glutinosum 570 12.4 High 0.9
Notes: Woody cover was estimated Sep.-Oct. 2008. Provisional estimates of the relative density (high/medium/low) of domestic animals were also made at that time. Fire frequency estimates were extracted from mapped continental-scale data. MAP = mean annual
precipitation.
Table 2.3: Posterior predictive checks of the HB model.
Trait r2 Pmean B PBf it Length 0.85 0.500 0.049 Aboveground mass 0.94 0.502 0.258 Stem mass 0.95 0.501 0.255 Leaf mass 0.85 0.502 0.369
Note: We calculated three test statistics: 1) Pearson’s r2assessing the correlation between the observed data and the replicated data, 2) PBmeanto assess the ability of the model to capture the mean tendency of the data, and 3) PBf it based on a sums-of-squares approach to assess overall model fit including its ability to capture data variability. A value of PB (for both mean and fit) near
Table 2.4: Variance components of the hierarchical Bayesian model for each scaling relationship (diameter vs. trait).
Trait Tree-level variance (s2
bY) Species-level variance (s 2 BY) Length 0.0016 (1.71 ⇥ 10 6, 0.007) 0.2700 (0.002, 2.281) Aboveground mass 0.0003 (2.77 ⇥ 10 7, 0.002) 0.1323 (1.83 ⇥ 10 5, 1.385) Stem mass 0.0003 (2.77 ⇥ 10 7, 0.002) 0.1698 (3.99 ⇥ 10 5, 1.676) Leaf mass 0.0160 (3.18 ⇥ 10 5, 0.067) 0.2160 (3.56 ⇥ 10 5, 2.026)
Note: Means are shown with 95% credible intervals displayed in parentheses.
2.7 Figures 101.5 102 102.5 103 103.5 104 A 100.4 100.6 100.8 101 101.2 Diameter (cm) Length (cm) 10−1 100 101 102 103 B 100.4 100.6 100.8 101 101.2 Diameter (cm) A G Mass (kg) 10−1 100 101 102 103 C 100.4 100.6 100.8 101 101.2 Diameter (cm) Stem Mass (kg) 10−1 100 101 102 103 D 100.4 100.6 100.8 101 101.2 Diameter (cm) Leaf Mass (kg) coge cogl demi
Figure 2.1: Fitted allometries for each allometric relationship using global level parameters. The symbols correspond to species as shown in the legend and are semi-transparent to show overlapping points. Lines show global level (interspecific) mean fit and the shaded regions are the 95% credible intervals. Note that all plots are in log-log space. Species codes: demi, Detarium microcarpum (MAP = 1400 mm y 1); coge, Combretum geitynophylum (MAP = 1200 mm y 1); cogl, Combretum glutinosum (MAP = 570 mm y 1).
Tree and ! branch level! Speci es! leve l! ‘Global’ ! leve
l! branch level!Tree and !
Speci es! leve l! ‘Global’ ! leve l! Length scaling e xponent 0.2 0.4 0.6 0.8 1.0 1.2 1.4 1.6 demi coge cogl ’global’ MST GEOM STRESS A A G mass scaling e xponent 2.2 2.4 2.6 2.8 3.0 3.2 B
Stem mass scaling e
xponent 2.2 2.4 2.6 2.8 3.0 3.2 3.4 C
Leaf mass scaling e
xponent 1.0 1.2 1.4 1.6 1.8 2.0 2.2 2.4 2.6 2.8 D
Figure 2.2: Posterior means and 95% credible intervals of scaling exponents (b) at different hierarchical levels. Symbols correspond to the species and the large diamond represents the interspecific, global-level scaling exponent. 95% credible intervals are shown as vertical lines on means. The levels along the x-axis refer to levels in the hierarchical Bayesian model. The horizontal lines represent the theoretical predictions of the three scaling models (note that in D MST and GEOM make the same prediction, see Table 2.1). Species codes are as in Figure 2.1. AG mass = aboveground mass.
Figure 2.3: Posterior densities of the difference between species-specific diameter-length scaling exponents (bl). The dashed line shows a difference of zero. Species contrasts are indicated by color as in the legend where “demi—coge” means the scaling exponent of D. microcarpum minus the scaling exponent of C. geitynophylum. The probability that a specific difference is greater than zero (which can be considered a significant difference between exponents) is displayed in parentheses in the legend. Species codes are as in Figure 2.1.
Figure 2.4: Species level posterior means and 95% credible intervals of normalization constants (a). Species codes are as in Figure 2.1 and “Traits” along x-axis refer to the scaling of diameter with that trait (e.g., “length” refers to the normalizing constants for the scaling relationship l = aDb). Symbols correspond to the species and 95% credible intervals are shown as vertical lines on means.