Lund University
Master Thesis
Department of Industrial Management and Logistics
Forming an Inventory Control Policy
in a Stochastic Environment
A Case Study at Sandvik Crushing and Screening
Authors: Supervisor:
Anders Mattisson Fredrik Olsson
David Alsmarker
i © 2018 - Anders Mattisson and David Alsmarker. All right reserved.
ii
Abstract
Title: Forming an Inventory Control Policy in a Stochastic Environment: A Case Study at Sandvik Crushing
and Screening
Authors: Anders Mattisson, David Alsmarker
Supervisor: Fredrik Olsson, Department of Industrial Management and Logistics
Background: For most companies that handle large material flows there are buffers between different
stages in the supply chain, often referred to as inventory. The main reasons for having these inventories are to achieve economies of scale when handling material flows and to buffer against uncertainties when matching demand and supply. Hence, the main objective in inventory control is to decide when and how much to order and by doing so, balance conflicting goals. These goals could be to reduce operational costs and to reduce stock on hand while achieving a certain service level to the customers.
Purpose: Forming an inventory control policy for a new warehouse which is based on the demand from
both the production of new crushers and from the aftermarket.
Research questions: (1) How to form an inventory control policy for a new warehouse? a) How to optimize
the parameters in this policy to minimize the ordering costs and the inventory holding costs? (2) How does the lead time variability affect these costs?
Methodology: In this study, a framework presented by Yin (2009) and Hillier & Liebermann (2010) has
been used to construct the research design. The initial step was to specify the problem at hand before the gathering of data was initiated which also included a literature study. Based on the gathered information, an initial analysis of the current system was performed before the mathematical model which represents the new inventory control policy was created. A statistical analysis of the lead times was conducted to provide input to the model. Finally, the constructed model was evaluated in a sensitivity analysis.
Conclusion: Based on the analysis of sales data, a compound Poisson process was chosen as an appropriate
demand model. From the theoretical foundation and current practices at the case company, an (R, Q) policy with periodic review was chosen as the new inventory control policy. Since the case company currently experience variability in the lead times, this uncertainty was incorporated in the new policy. The study showed that in the future state, where the case company would operate with a shared warehouse with 95% fill rate and take stochastic lead times into consideration, the holding costs would increase while the ordering costs would be reduced. When analyzing the effect of lowering the lead time variability in the new policy, it was shown that the holding costs were reduced while the ordering costs increased. Finally, it was concluded that in the best-case scenario where lead times are assumed constant, the total costs in the future state would be reduced compared to the current system.
iii
Acknowledgement
This thesis, and the project from which it origins, concludes the two author's Master of Science within Industrial Engineering and Management at the Faculty of Engineering at Lund University. The project was carried out in collaboration with Sandvik Group’s Product Area Sandvik Crushing and Screening. The authors would like to extend their sincere gratitude towards all involved actors at Sandvik for their invaluable guidance and support throughout the project. A special thank you to Caroline Dahlborg, Miguel Rocha and Sofia Hedenström who have been of great importance for the project to be accomplished. Furthermore, the authors would also like to extend their sincere gratitude towards, Fredrik Olsson, supervisor from the Department of Industrial Management and Logistics at the Faculty of Engineering for valuable guidance and feedback he brought into the project.
Lund, June 2018
iv
Table of Abbreviations
BA - Business Area BU - Business Unit
C&S - Crushing & Screening
CDF – Cumulative Distribution Function CO - Customer Order
COV - Coefficient of Variation ERP - Enterprise Resource Planning IL - Inventory Level IP - Inventory Position KS - Kolmogorov - Smirnov L - Lead Time ML - Maximum Likelihood MTO - Make-To-Order MTS - Make-To-Stock PA - Product Area
PDF -Probability Density Function PO - Purchase Order
POS - Point-Of-Sales R - Reorder Point
VBA - Visual Basic for Applications T - Review Period
Q - Batch Quantity Size
SMRT - Sandvik Mining and Rock Technology SMCL - Sandvik Mining and Construction Logistics SRP - Sandvik Rock Processing
v
Table of Contents
1. Introduction 1 1.1 Background 1 1.2 Company description 2 1.3 Problem formulation 21.4 Purpose of study and research questions 3
1.5 Project focus, delimitations and company directives 3
2. Methodology 5 2.1 Research strategy 5 2.1.1 Survey 5 2.1.2 Case study 5 2.1.3 Experiment 6 2.1.4 Action research 6
2.2 The chosen research strategy 6
2.3 Research design 7
2.3.1 A case study research approach 7
2.3.1.1 Plan 7 2.3.1.2 Design 7 2.3.1.3 Prepare 7 2.3.1.4 Collect 8 2.3.1.5 Analyze 8 2.3.1.6 Share 8
2.3.2 An approach for operations research modeling 8
2.3.2.1 Define the problem of interest and gather relevant data 8
2.3.2.2 Formulate a mathematical model to represent the problem 9
2.3.2.2 Develop a computer-based procedure for deriving solutions to the problem 9
2.3.2.3 Test the model and refine it as needed 9
2.3.2.3 Prepare for the ongoing application of the model as prescribed by management 10
2.3.2.3 Implement 10
2.3.3 The used research design in this project 10
2.3.4 Unit of analysis 13
2.4 Research quality 13
vi
2.4.2 Internal validity 14
2.4.3 External validity 14
2.4.4 Reliability 14
2.4.5 Research quality in this study 14
2.5 Data collection and data analysis 15
2.5.1 Types of data 15
2.5.2 Sources of data 15
2.5.3 Analysis approaches 15
2.5.4 Data collection and data analysis in this study 17
2.5.4.1 Chosen sources of information 17
2.5.4.2 Chosen data analysis approach 17
3. Theoretical Background 19
3.1 Supply chain management 19
3.1.1 Supply network 19
3.1.2 Distribution network 19
3.1.3. The lead time gap 20
3.1.4 The Bullwhip effect 20
3.2 Inventory control 21
3.2.1 Inventory 22
3.2.2 Stochastic demand distribution 22
3.2.3 Human judgement 24
3.2.4 Costs and service level 25
3.2.5 Ordering concepts 25
3.2.6 An (R, Q) policy 26
3.2.6.1 Reorder point 27
3.2.6.2 Batch quantity 29
3.2.6.3 Stochastic lead times 29
3.2.6.4 Probability of ordering 31
3.3 Distribution fitting and analysis of input data 32
3.3.1 Basic concepts in statistics 32
3.3.1 Distribution fitting and goodness-of-fit 33
3.3.2 Maximum-Likelihood Estimation 34
vii
3.3.4 Kolmogorov-Smirnov test 36
3.3.5 Inverse transformation method 37
4. Background to Sandvik Group and Sandvik C&S 39
4.1 Organization and business areas 39
4.2 Products and components 40
4.2.1 Products 40
4.2.2 Product components 40
4.2.2.1 Wear parts 41
4.2.2.2 Major components 41
4.2.2.3 Key components 41
4.2.2.4 Commercial and other components 42
4.3 Markets and customers 42
4.4 Supply network 43
5. Analysis of Current System 45
5.1. Supplier base and supplier selection 45
5.2 The three largest suppliers 46
5.2.1 Supplier A 47
5.2.2 Supplier B 48
5.2.3 Supplier C 48
5.3 Current inventory and fill rate situation 48
5.4 Ordering 49
5.4.1 Sales order pattern 49
5.4.2 Purchase order pattern 50
5.4.3 Comparison 52
6. Model Construction 55
6.1 The considered system 55
6.2 Demand model analysis 56
6.3 Lead time analysis 58
6.3.1 Input analysis of lead times 58
6.3.2 Results from the input analysis of lead times 62
6.3.3 Generating lead times from the lognormal distribution 63
6.3.4 Creating lead time scenarios 64
viii
6.4.1 Model formulation 65
6.4.2 Model results 67
6.4.3 Comparison to previous model 68
6.5 Effect of lead time variability 68
6.6 Sensitivity analysis 71
7. Conclusion 75
7.1 RQ 1: How to construct an inventory control policy for a new warehouse? 75
7.2 RQ 2: How does the lead time variability affect the total cost? 76
7.3 Future research and implementation 76
References 79
1
1. Introduction
This chapter describes the background to this master thesis project, presents the case company and the problem formulation. It will also introduce the project purpose, focus areas and delimitations.
1.1 Background
In today’s globalized world, companies are experiencing a continuously growing competition. Customers are requiring a high variety of, preferably customized, products to be delivered instantly with short notice. This development requires a logistics system that can deliver according to the customer’s expectations while at the same time contribute to improve the company’s financial performance (Chanukov, Becker & Windt, 2014). What makes the seemingly simple task to match demand and supply so difficult is the presence of uncertainty (Christopher, 2011). Variability always degrades the performance of an inventory system and will have to be buffered by some combination of inventory, capacity and time. (Hopp, Spearman, 2008). Today the total investment in inventories is enormous and the control of capital tied up in raw material, work-in-progress, and finished goods offer a substantial potential for improvement. In this context, supply chain management has become increasingly essential and the strategic importance of this area is today fully recognized by top management (Axsäter, 2006).
In order to meet the growing expectations from customers, an increased need of coordination and cooperation in the supply chain has emerged. Cooperation means that comparable activities are coordinated between different firms to achieve better results over time, which also includes cross-functional coordination. To achieve this, a system approach is needed where the total flow from the supplier to the final customer is synchronized which requires synchronization of both operational activities and capabilities within and between supply chain firms. Cooperation can also be an approach to accomplish reduction in supply chain inventories and reach other reductions in supply chain costs. For example, sharing of information regarding forecasts, inventory levels and marketing strategies can reduce uncertainty between the members of the supply chain (Mentzer, DeWitt, Keebler, Min, Nix, Smith & Zacharia, 2001).
Even though cooperation has the potential to reduce inventories in a supply chain, some inventory will be required. This is mainly due to two reasons: economies of scale and uncertainties. Economies of scale could be accomplished by creating batches through aggregating orders to accomplish increased efficiency. However, this process results in increased stock-on-hand. Additionally, supply and demand uncertainties in combination with the existence of lead times in ordering, production and transportation creates a requirement for safety stock. Even though several sources of uncertainty exist, it is still possible for most companies to accomplish reduction in their inventories without incurring additional costs by using advances in information technology and more efficient inventory tools (Axsäter, 2006).
The main objective in inventory control is to decide when and how much to order and by doing so, balance conflicting goals. Free tied-up capital for other purposes is one important goal with keeping low stock levels. However, different functions in the organizations might have different objectives. From the purchasing manager’s perspective, ordering in large batches is preferable since it enables volume discounts. The production manager prefers using large batches in the production to reduce time-consuming setups.
2
From the production perspective, it is also desirable to have large buffers to avoid stops due to shortage of raw material. The marketing manager would like to have a high stock of finished goods to be able to provide customers a high service level. Finding the best balance between these goals is challenging but the purpose with inventory models is to accomplish this balance (Axsäter, 2006).
1.2 Company description
This thesis will be conducted at the Sandvik Group which is a global engineering company with around 43 000 employees worldwide. Sandvik relies heavily on their experience about industrial processes and expertise in material technology. In 2017 Sandvik had a revenue of 90.9 billion SEK with a profit margin of 14.6 billion SEK. The group is divided into three major business areas: Sandvik Machining Solutions, Sandvik Mining and Rock Technology and Sandvik Materials Technology. The group is specialized in the areas of tools and tooling systems for industrial metal cutting, equipment and tools, service and technical solutions for the mining and construction industries and advanced stainless steels and special alloys as well as products for heating products (Sandvik AB, 2018).
This thesis will focus on the Business Area (BA) called Sandvik Mining and Rock Technology which is a recent merger of Sandvik Mining and Sandvik Construction. Product areas (PA) are smaller units within the BA and this thesis will focus on PA Crushing & Screening, C&S. More specifically, the business unit (BU) called Stationary which focuses on stationary crushers and screeners will be the focal point of this thesis. The chosen BU mainly delivers crushers and screeners to the mining and construction industry (Sandvik AB, 2018).
1.3 Problem formulation
The case company currently has two legal entities that order case company specific components from the same suppliers. One of the legal entities supplies the aftermarket with components and the other entity produces and assembles new crushers. The ordered components are the same for both the legal entities but orders to the suppliers are today sent from two different ERP-systems and by different people with no coordination between the legal entities. During the recent year, when demand for these types of components has increased significantly, the variability in the number of purchase order (PO) lines and the weekly ordered quantity towards the suppliers has also increased. The case company is also experiencing a high variation in the replenishment lead times from the suppliers which is a concern since it affects the service level to the customers and the trust in the supply process.
Recently, the case company has gained control over the entire distribution network. Therefore, they want to investigate a future state, where the ordering of these components would be done to a shared central warehouse for both the legal entities. Since this state does not currently exists, the case company wants to investigate the holding costs and ordering costs for this centralized scenario. The stated purpose with this change would be to achieve economies of scale, improved service level and improved coordination of orders to the suppliers. Coordination is in this context defined as a change from independent ordering from the two legal entities to a coherent inventory control policy in a new warehouse, where demand of components from both the legal entities is taken into consideration. This thesis will therefore investigate how to construct an inventory control policy for these types of components and how the holding and
3
ordering costs related to this policy are affected in this future scenario. As mentioned above, the case company expresses that the variability in the lead times is a concern. Therefore, lead times will not be assumed constant in the new inventory control policy and the holding and ordering costs related to the variability in lead times will be evaluated. In this evaluation, constant lead times will represent a best-case scenario.
1.4 Purpose of study and research questions
The purpose of this master thesis is to form an inventory control policy for a new warehouse which is based on the demand from both the production of new crushers and from the aftermarket.
The thesis will answer the following research questions:
1. How to form an inventory control policy for a new warehouse?
a. How to optimize the parameters in this policy to minimize the ordering costs and the inventory holding costs?
2. How does the lead time variability affect these costs?
1.5 Project focus, delimitations and company directives
As described above, this thesis will focus on the new inventory control scenario described in Section 1.3. To consider a single echelon system, is the most significant company directive that has affected the direction of this project. The authors are aware that this study does not attempt to do a complete evaluation of this new scenario since that would have been a project larger than what is feasible in a master thesis project. However, this study will evaluate some aspects of this future scenario which will be one part of the case company’s overall evaluation of this type of change. A full evaluation could also include the effect on transportation costs from the suppliers and the best geographical location of the warehouse.
The focus in this project will be to minimize the ordering costs and the holding costs given the case company’s current choice of service level constraint, i.e. 95 percent of demand can be satisfied immediately from stock on hand. Since the case company has expressed that they experience variability in their lead times from the suppliers, this will be taken into consideration in the new inventory control policy. The effect of lead time variability on the holding and ordering costs will also be evaluated. Any other costs than above mentioned will not be considered. Since this project is limited in time, some external suppliers of high importance will be selected for further analysis. This selection will be based on the aggregated delivered value to both the aftermarket and the production of new crushers.
The project will be limited to customer critical components that are case company specific, so called key components. The characteristics of these components will be further described later in the report. The case company is currently working with other projects which will address the customer aspects in the defined scenario, hence the distribution to the customers from this shared warehouse has been excluded. The considered location of this new warehouse is not decided but it is assumed thatthe average lengthof the current lead times will not be significantly affected.
5
2. Methodology
This chapter describes and motivates the chosen research strategy and research execution used in this master thesis project. The aim is to help the reader to better understand how insights have been gained and how conclusions have been reached. It also explains how the gathering and analysis of data have been conducted in this project and how the authors have worked with research quality.
2.1 Research strategy
The choice of methodology in a research project depends on the project’s objective, characteristics and purpose. There are mainly four different purposes of a research study: descriptive, exploratory, explanatory and problem solving. A descriptive study aims to map and describe how activities are working and how they are performed while an exploratory study generates a more in depth understanding of the activity and how it is executed. In the explanatory study, the researcher tries to find cause and effect relations and explanations to how a phenomenon or activities work or why they are performed in certain ways. Finally, the main purpose of a problem-solving study is to find a solution to an identified problem (Höst, Regnell & Runesson, 2006).
After having determined the purpose of the study, the researcher could use this choice in the evaluation of the appropriate research strategy. The research strategy is a method that follows a certain logic which aims at gathering and analyzing empirically found evidence (Yin, 2009). There are several different research strategies and four of these which, according to Höst et al (2006), are especially valuable in master thesis projects will be described briefly below.
2.1.1 Survey
This type of strategy is used to analyze broad problems and is a question-based investigation of sample type where the final objective is to describe or explain the current state of the studied problem or phenomenon. Key aspects that the researcher needs to consider when using this type of research strategy are which people to address and what type of questions that should be asked to these people. Survey is an appropriate method to use when the research project will describe a phenomenon (Höst et al, 2006).
2.1.2 Case study
The technical description of the case study could be divided into two parts (Yin, 2009). The first part states that the case study is an empirical investigation that analyses a phenomenon in the real setting where the boundaries between the phenomenon and the context itself are not always obvious. This means that the case study strategy would be used because the conditions, specific for the context, are of interest in the study because they are believed to be relevant for the studied phenomenon (Yin, 2009). Secondly, the case study handles situations where the variables of interest are more than the available data points. This means that existing theories need to be used to guide the collection and analysis of data. Additionally, the data which has been collected and analyzed needs to form a common base in a triangulation pattern (Yin, 2009). The case study strategy gives the researcher the possibility to keep the holistic characteristics of real-life events such as individual life cycles, small group behavior, organizational and managerial processes, neighborhood changes, school performance, international relations and the maturation of industries (Yin, 2009). A case
6
study aims at describing a phenomenon or an activity in depth and could for example be used in an organization to understand the way of working. The studied object in the case study is often chosen of a special reason and the researcher does not aim for generalizable results. However, if several case studies are performed and some patterns are discovered, the case study strategy might also be useful in finding general patterns. Yet, since the cases have not been randomly selected (as is the case in the survey strategy), the results cannot be considered statistical proofs. On the other hand, the case study provides a deeper insight into the specific problem than the survey does. This research strategy is also more flexible than the survey because the collection of data and therefore the direction of the study can be changed as the project moves on. The case study method is an appropriate research strategy when the study will describe a phenomenon or an object in depth (Höst et al, 2006).
2.1.3 Experiment
When the researcher wants to explain causes to a phenomenon, a more structured research strategy is required, and the experimental design is then an option. For example, this strategy can be used to compare different technical solutions to each other but also to investigate the effect of different parameter values on the performance of a system or solution (Höst et al, 2006). This strategy deliberately differentiates the studied phenomenon from its context with the purpose to explore the isolated consequences of a change in one or a few specific parameters (Yin, 2009).
2.1.4 Action research
This type of research strategy is sometimes considered being a part of the case study strategy and aims at improving an activity or phenomenon while it is studied. Action research starts with the observation of a situation or phenomenon to identify the type of problem that needs to be solved. To perform this step, either the survey or the case study research strategy can be used. When having completed the observation stage, the researcher will try to find a solution to the identified problem. Research projects which use this strategy often aim at following the development during a period of time to accomplish the desired results, several cycles are often required (Höst et al, 2006).
2.2 The chosen research strategy
In this research project, the chosen research strategy is the case study strategy. The main reasons for this choice are:
1. This study is of a problem-solving type and will explore a future state where the case company operates with a new shared central warehouse. The thesis will also include an in-depth analysis of a suitable inventory control policy and investigate the circumstances in which the case company currently operates and how these circumstances affect the performance of the inventory control policy.
2. Since the problem at hand in the initial phase needs to be explored and more clearly defined, some flexibility in terms of performing the study is required. This is one of the main advantages of the case study approach.
3. Even though this study will be focused on a future state when developing the inventory control policy, the authors will keep a holistic approach and take into account current organizational structures, supply chain processes and product characteristics.
7
All of these factors are mentioned by Yin (2009) and Höst et al (2006) as favorable for choosing the case study approach as the appropriate research strategy.
2.3 Research design
As concluded above, this research project will follow the case study research strategy. Since the defined problem is complex and comprehensive, this master thesis will only consider the described case company. To accomplish and fulfill the research strategy, a research design is also required. This is a logical plan to take the research project from the start to the finish where the start is the initially posed questions and the finish is the conclusions or answers that the researcher wants to reach. The main purpose of the research design is to avoid the situation where the gathered empirical evidence does not provide the answer to the initially posed research questions (Yin, 2009). In this research project, a case study methodology presented by Yin (2009) together with a guide for operations research presented by Hillier & Liebermann (2010) will be used for conducting the study. Both these approaches will be described below and the way these approaches will be combined in this study will summarize this section.
2.3.1 A case study research approach
In this section the six-step approach to conduct a case study presented by Yin (2009) will be briefly described. This approach is described as a linear but iterative process (Yin, 2009).
2.3.1.1 Plan
In the planning phase the researcher should identify the research questions that will be used in the study. Furthermore, the investigator should compare and understand the differences of the case study research strategy to other methods. It is also in this phase where the researcher needs to get an understanding of the strengths and limitations of the case study strategy together with the different types of case studies that exist (Yin, 2009).
2.3.1.2 Design
Designing the study is a difficult part of doing the case study strategy since, unlike some other research methods, no account of methods exists where the researcher can choose the design that fits the best for the specific study. However, in this stage of the process the unit of analysis should be determined but also the probable case or cases that are to be studied need to be decided. Additionally, the relevant theory, propositions and the fundamental issues creating the need for the case study should be specified. This is also the stage in which the researcher needs to determine if the study should be a single, multiple, holistic or embedded case study. Finally, procedures to keep the case study quality should be established in this stage of the approach (Yin, 2009).
2.3.1.3 Prepare
After having determined that the case study research strategy is an appropriate choice for the specific study and after having designed the study itself, the researcher should prepare for conducting the project. This step includes acquiring the specific skills that are important for a case study researcher. Also, in order for a successful completion of the case study, the team needs to be synchronized in regard to the rationale behind
8
the case study, what evidence is wanted, what variations that could occur and what would be potential supportive or opposing evidence for any given proposition (Yin, 2009).
2.3.1.4 Collect
In the data collection phase, all the conducted preparations and established procedures should be used and followed to ensure the quality of the conducted study. Several sources of evidence should be included to strengthen the quality of the final conclusions and a case study database which constitutes a formal assembly of evidence separated from the final case study report should be established. Finally, the researcher also needs to ensure that the chain of evidence is kept so the link between the asked questions, the collected data and the conclusions drawn are evident (Yin, 2009).
2.3.1.5 Analyze
When the case study evidence has been collected, the analysis phase will start. The analysis is preferably based on a general analytic strategy where four examples are: theoretical propositions, developing case descriptions, using both quantitative and qualitative data and examining rival explanations. These strategies will be the foundation for the five analytical techniques that could then be used to guide the analytical process in the case study. Pattern matching, explanation building, time-series analysis, logic models and cross-case synthesis are all possible approaches to use in the analysis phase. To accomplish a firm analysis, the researcher needs to include all available data that has been collected and present the evidence separate from any potential interpretations (Yin, 2009).
2.3.1.6 Share
The final part of the case study approach includes the sharing of the conclusions that have been reached. In this part of the approach, the investigator needs to identify the audience of the report from the case study, develop the report’s compositional structure and provide the draft for review to others. Using both text and visual material in the composition of the case study and making sure to include sufficient evidence so that the reader can reach its own conclusions are aspects to consider when compiling the case study report. To accomplish a high-quality report, the content and design should be reviewed and rewritten until reaching a high quality (Yin, 2009).
2.3.2 An approach for operations research modeling
In this part, the approach for conducting operations research presented by Hillier & Lieberman (2010) will be briefly described. Operations research is a field of research focusing on problems that concern how to conduct and coordinate the operations (in other words, the activities) performed within an organization (Hillier & Lieberman, 2010). This thesis concerns inventory control which is a common field in operations research literature. The described approach will be used in this research project to adjust the case study approach presented by Yin (2009) to the field in which this study is performed.
2.3.2.1 Define the problem of interest and gather relevant data
The first step in conducting operations research is to define the problem at hand. In many cases, this problem is imprecisely defined which means that the investigator needs to start with analyzing the system that will be studied and try to determine a specific description of the problem which will be the starting point for the
9
study. The problem definition phase also means that several aspects such as a relevant objective, potential constraints in terms of what can be done, affiliations between the studied field and other areas of the company, other possible directions of studies and potential time limits need to be decided. Here, deciding the appropriate objective is of highest importance to ensure that the involved stakeholders get the desired result of the study. The first phase of operations research often includes an extensive data gathering about the problem. The purpose is to create a thorough understanding of the studied problem but also to create a foundation for the mathematical model that will be formulated later in the study. In the data gathering process, additional people that originally were not involved in the study will need to be involved to acquire all the necessary information. With the increasing number and size of databases one of the major challenges is to identify the most valuable data out of all the available information (Hillier & Lieberman, 2010).
2.3.2.2 Formulate a mathematical model to represent the problem
After the problem is defined, it should be transformed into a form that enables an analysis of the problem. From an operations research perspective, this most often means to form a mathematical model of the problem. In general, models are an idealized representation of the reality which are used with the purpose to simplify the analysis and to show correlations. The mathematical model shows this idealization through mathematical expressions and symbols where the main parts are the objective function, the decision variables, the constraints and the parameters. The objective function represents the performance measures while the decision variables are the decisions that could be made to maximize the performance. In real-life settings there are most often limitations to these decisions which are represented by constraints in the mathematical model. Coefficients and constraints in the model are referred to as parameters and since these are approximated by the use of real data, a sensitivity analysis of the result is conducted to conclude how sensitive the results are to changes in the parameter values. The benefits of using a mathematical model is that it facilitates the determination of cause - and - effect relationships and enables consideration of all correlations at the same time. It is important that the model is correlated to the reality (Hillier & Lieberman, 2010)
2.3.2.2 Develop a computer-based procedure for deriving solutions to the problem
In the operations research field, the aim with the mathematical model is to enable a generation of solutions for the specified problem. The overall objective is to find the best or optimal solution to the problem through the use of certain algorithms. After the solution has been reached, a common step is to perform a what-if analysis to consider what would happen to the solution if some assumptions or parameters were changed. Also in this part a sensitivity analysis is necessary to determine the most critical parameters in the model (Hillier & Lieberman, 2010).
2.3.2.3 Test the model and refine it as needed
In the development process of a mathematical model, the accuracy of the model needs to be continuously evaluated. This includes taking care of potential bugs and errors in the model which will generate errors in the solution. The major errors need to be taken care of in the refining and validation process while some minor errors, that might never be detected, will always remain. However, the testing and validation process should ensure that the results generated by the model are sufficiently reliable to be used as conclusions from the operations research study. There are different methods to validate the model where testing of different
10
parameter values and to use a retrospective test where historic data is used to reconstruct the past and see how well the model would have performed if used for this data (Hillier & Lieberman, 2010).
2.3.2.3 Prepare for the ongoing application of the model as prescribed by management
When an acceptable model has been reached and the aim is to use the model in a repetitive manner, the researcher needs to ensure that the future user of the model understands how it is designed and how it should be used. The system describing the application of the model will include a solution procedure (including post optimality analysis) and an operational procedure required for implementation. In many cases, this implementation guide is computerized and operationalized in a decision support system which will help managers to use the model in their decision making (Hillier & Lieberman, 2010).
2.3.2.3 Implement
The final step of the operations research process is the implementation of the results from the study. Implementation is conducted in several steps where the first step includes an explanation of the new system and how it is related to current operational practices. Secondly, the staff that will work with the new system is introduced to how it works. After concluding the implementation, it is important to gather feedback and to change the model when the underlying assumptions are changing. A documentation of the procedure used in the development process to enable replicability is also important in the concluding part of the study (Hillier & Lieberman, 2010).
2.3.3 The used research design in this project
This section will describe the research design which has been used in this project. The initial stage of the project was to choose the appropriate research strategy which is the major part of the planning step in the case study approach, according to Yin (2009). Continuing with the design process of the case study, both the above described approaches (the case study process and the operations research process) have been used. The definition of unit of analysis and detailed descriptions of the data gathering procedure (which are key steps in the design and prepare phases) will be further described in the next sections of the report. However, in Figure 1 the overall design of the study is presented where the links between the purpose of study, the research questions and the case study are presented.
11
Figure 1. Overview of research strategy.
Figure 2 below describes the design of the case study in a more detailed manner. The first step of the study was to clarify and specify the problem definition by conducting interviews with some of the employees at the case company. Additionally, company directives and appropriate delimitations were taken into consideration to guide the direction of the study and the interpretation of the problem to ensure that the outcome of the study will solve the desired problem. The connection to the posed research questions was also evaluated and the alignment between the company problem description and the research questions was ensured. According to Figure 2 below, the second phase of the project was the data gathering step. At this stage, the major part of the data gathering was conducted but also a literature study was performed. Information gathered through the initial interviews with company employees together with relevant theory from the literature study, formed the basis for the system mapping. In addition to the qualitative data, also quantitative data from various systems used by the case company was collected. Data sources and strategies for data analysis which have been used will be further described in Section 2.5.4.
Figure 2. Summary of research design.
The gathered information in the second phase of the project, formed the basis for the third part of the study, which is called Model formulation and analysis in Figure 2 above. Firstly, the collected data was used for
12
an analysis of sales, inventory levels, suppliers and lead times. This was the part of the project where the selection of suppliers and items which have been included in the project was conducted. Also, a statistical analysis of lead times was performed which was a key step in answering the second research question regarding how the variability in lead times affect the constructed inventory control policy. Additionally, the mathematical model which formed the cornerstone in the new inventory control policy was formulated and constructed. The model was constructed based on the information gathered in the second phase of the project and was applied for the selected suppliers and items. By gathering data and building the mathematical model representing the new inventory control policy, the authors were able to answer the first research question regarding how to construct an inventory control policy for the new warehouse. In the last part of the model formulation and analysis part of the research design, a sensitivity analysis of the constructed model and the included parameters was conducted. An important part of the sensitivity analysis included an evaluation of the impact of the choice of batch quantities in the evaluated inventory control policy.
Finally, in the Solution and implementation phase according to Figure 2 above, a solution to the experienced problem described by the case company was generated. The mathematical model and the assumptions on which it was built constituted the foundation for answering the first research question. By combining the statistical analysis of lead times and the construction of the mathematical model, a basis for answering the second research question was formed. This project has not covered the whole implementation process, instead the authors have only been involved in the explanation of the results from the study and the constructed model to relevant stakeholders at the case company.
To conclude the research design section of this chapter, the interaction framework in Table 1 below shows how the used research design interacts with the proposed frameworks by Yin (2009) and Hillier & Lieberman (2010). The numbers in the framework shows the performed steps in the design of this case study and how they are connected to the described methods.
13
Table 1. Interaction between the research design and the above described frameworks.
Interaction framework Case study methodology (Yin, 2009) Operations research (Hillier &
Lieberman, 2010)
Plan Design Prepare Collect Analyze Share
Define problem 1 1,2
Gather relevant data 5 3,4,5
Formulate a mathematical model to represent the problem
6,7
Develop computer-based procedure to derive solutions from the model
7,9
Test the model and refine it as needed
8
Prepare for ongoing application of the model
9,10
Implement 10
2.3.4 Unit of analysis
One part of constructing the research design is to define the unit of analysis, i.e. the case that is to be studied (Yin, 2009). In this study, the unit of analysis is PA Crushing & Screening and more specifically, the inventory control in this Product Area. The analysis in this project has been focused on the inventory control in a new warehouse supplying both the aftermarket and the production of new crushers with customer critical components. This is a future state at the case company and how this state differs and is related to the current supply chain at Sandvik C&S will be further described in Chapter 4 and Chapter 5 of this report.
2.4 Research quality
In this part of the methodology chapter, four tests proposed by Yin (2009) to ensure research quality, the application of the tests and the proposed tactics to use these tests, will be presented. Thereafter, the considerations made, and the steps taken in this study to strengthen the research quality will be presented.
2.4.1 Construct validity
The first step in the quality testing procedure in a case study is to identify the correct operational measures for the concepts being studied (Yin, 2009). To accomplish this, three different tactics are proposed by Yin (2009). The first tactic is to use multiple sources of evidence for investigations in the same direction to achieve convergence in the line of questioning. Availability of several different sources is one of the strengths with the case study method and should therefore be used to make the conclusions from the case study more convincing and precise. This tactic is applicable in the data collection phase. Secondly, establishing a chain of evidence is also an appropriate tactic which should be applied in the data collection phase of the study. The idea is to enable the reader of the case study to follow the line of reasoning and the process from the research questions to the final conclusions. Finally, it is also suggested that the case study report is reviewed by sources that have provided information to the study (Yin, 2009).
14
2.4.2 Internal validity
For explanatory case studies where the researcher wants to find answers to why and how questions, this quality test is especially important to consider in the analysis phase. The researcher wants to avoid concluding that a phenomenon is caused by some factors while it is actually caused by some other circumstances. Additionally, exploring alternative conclusions and questioning the reliability in the reached conclusions is also related to the internal validity. This is especially important when certain conditions cannot be observed by the researcher (Yin, 2009). Some tactics that are mentioned to deal with the internal validity are to do pattern matching, do explanation building, address rival explanations and use logic models (Yin, 2009).
2.4.3 External validity
Making sure that the results from the conducted case study are transferable to other, similar cases has been a key challenge when conducting case studies. The issue is also to define the areas in which the results from the study are applicable. Through the replication of case studies where the outcome is expected to be similar, the strength of the results from the case studies can be improved and can then be said to support the suggested theory (Yin, 2009). Suggested actions to improve the external validity in single case studies is to use theory and in multiple - case studies, to use the replication logic (Yin, 2009).
2.4.4 Reliability
The final quality test aims at ensuring that if the case study was performed a second time by another researcher which would follow the same procedures, the outcome would be the same. Focusing on reliability means aiming for reducing bias and errors in the study. For the case study researcher, the reliability issue could be tackled through thorough documentation of procedures and results. In more detail, this means that appropriate tactics to ensure reliability is to use a case study protocol and develop a case study database in the data collection phase (Yin, 2009).
2.4.5 Research quality in this study
In this section, the actions taken to accomplish an increased research quality in this project will be described. To construct validity of the study, data has been gathered by using different methods and by using several different sources at the case company (sources of information will be described in Section 2.5.3). Furthermore, the gathered data has been reviewed and validated together with employees at the case company. In terms of internal validity, the results from the study have been compared with the information collected in the literature review in a pattern matching approach with the aim to understand whether the results are in line with the expected outcome of this type of study. To construct external validity of the conducted study, several different sources have been used when conducting the literature review. Also, the construction of the mathematical model and the statistical analysis of lead times has been based on well-known theory which makes the results from this study valuable for other companies which face the same challenges as the studied case company. Finally, to increase the reliability of the results of the study, notes and descriptions of used data sources and methods to reach the conclusions in the study have been collected and summarized. This will enable the case company to repeat the performed study if this would be of interest.
15
2.5 Data collection and data analysis
This section of the chapter will describe different available sources of data together with available methods to analyze the collected information. In the end of the section, a description of the data sources used in this study and the chosen analytical methods will be provided.
2.5.1 Types of data
The data that could be collected to a research study is either quantitative or qualitative. The quantitative data is information that can be counted or classified and includes characteristics such as color, weight, amount and shares. This type of data can be analyzed by the use of statistical analytical models. Qualitative data on the other hand, is information that mainly consists of words and descriptions with plenty of details and nuances. The qualitative data requires other types of analysis methods in terms of sorting and categorization. In order to analyze complex problems, it is preferred to use a combination of quantitative and qualitative data (Höst et al, 2006).
2.5.2 Sources of data
According to Yin (2009) there are mainly six sources of evidence that are usually used in a case study, these are documentation, archival records, interviews, direct observation, participant - observation and physical artifacts. Documentation is a source of evidence that is included in almost all case studies and is information that could come in many different forms such as agendas, minutes of meetings, formal studies or evaluations and personal documents (i.e. e-mail correspondence and notes (Yin, 2009). Another frequently used source of information is archival records, which could include service records, organizational records in terms of budget or personnel records together with maps and charts of a certain place (Yin, 2009, p.105). Furthermore, interviews are important sources of information for case studies. Even though the case study investigator needs to have a clear line of questioning, the interviews will probably be more conversational than would be the case when using the survey method (Yin, 2009). Since the case study aims at investigating current events, observations is a valid source of information for this research strategy. Observations could be used to experience the studied phenomena in the real-world context and could be done either through direct or through participant observations. The difference is that in a participant observation, the observer is taking some role in the situation or the studied phenomenon (Yin, 2009). Finally, physical artifacts in the form of technological devices, tools or instruments or work of art could be sources of evidence to a case study (Yin, 2009).
2.5.3 Analysis approaches
In the analysis part, the gathered data should be categorized, tabulated, tested or in other ways combined to be able to draw conclusions based on the empirical evidence (Yin, 2009). The analytical strategy can be divided into a quantitative and a qualitative approach where the choice depends on the characteristics of the gathered data (Höst et al, 2006). In the quantitative approach, statistical methods are frequently occurring. This approach can be used in two ways, to explore data with the purpose to gain a deeper understanding but also to show relationships and hypothesis that have been posed earlier. To explore data, using the mean or median together with statistical measurements of dispersion could be used. Other ways of exploring the data is through visualizing the data by using histograms or box-plots. Box-plots are also useful in the
16
investigation of whether the data sets include misleading values which needs to be removed as early as possible in the analysis (Höst et al, 2006).
Law and Kelton (1997) present a complementary approach to conduct the qualitative analysis of a system which is shown in Figure 3 below:
Figure 3. Framework to conduct a quantitative analysis adopted from Law and Kelton (1997).
According to this framework, there are mainly two approaches when conducting a quantitative analysis of a system. Either the experiment is done with the actual system or it is done through modelling the system. If the model is chosen, the analysis can be conducted by using either a physical or mathematical model. When using a mathematical model, this can be solved either by an analytical solution or by using simulation (Law and Kelton, 1997).
The character of the qualitative analysis is different than the quantitative approach, basically because the underlying data is different than the data set used in the quantitative approach. While the quantitative data is based on numbers, the qualitative data set consists of words and descriptions where the existence and in some cases the frequency of the existence of words are of interest. To conduct a qualitative analysis, four steps could be used: data gathering, coding, grouping and conclusions. The first step includes interviews, searches in archives and observations. In the second step, important quotes are connected to one or several keywords. This is followed by grouping where the coded parts of the texts are gathered where the purpose could be to study what different people have said about a certain keyword. Finally, conclusions are drawn based on the grouped data (Höst et al, 2006).
17
2.5.4 Data collection and data analysis in this study
This section describes the approach how data has been collected and analyzed in this study.
2.5.4.1 Chosen sources of information
In this project, several different sources of information have been used in the data gathering process. To answer the first research question regarding how to construct an inventory control policy for the shared warehouse, the following sources of information have been used: documentation, interviews and archival records. Documentation regarding current procedures and processes related to the current inventory control policies used by the case company has been studied. Additionally, informal interviews have been conducted with employees at the case company to form an understanding of the organization, processes and to get details regarding the future state which is considered in this project.
In terms of archival records, the main sources of information have been the ERP-systems and internal databases used by the case company. The information gathered from the internal databases and the ERP-systems include: sales numbers, purchase order data, historical fill rate levels and item master data. To perform the statistical analysis of lead times, internally used data including purchase orders during a period of four years, has been used. The statistical analysis has been used to answer the second research question regarding how the variability in lead times affect the performance of the inventory control policy. Data gathered through archival records are mostly of the quantitative character and has formed the basis for the mathematical model and the statistical analysis conducted in the project. A continuous dialogue with employees at the case company has been carried out to ensure that the chosen sources of data are reliable.
2.5.4.2 Chosen data analysis approach
Even though qualitative data has been gathered in this project, the main focus has been on analyzing and using quantitative data. Therefore, the quantitative data analysis approach has been the dominantly used in this study. Several of the statistical principles described by Höst et al (2006) have been used to analyze the gathered data. In the initial phase of the project, sales data, purchase order data and lead times have been characterized by their mean and the use of standard deviation to get an understanding of the collected information. An important step has also been to clean the collected data by examining extreme and unrealistic values. However, to answer the research questions the quantitative analysis has been carried out according to the model proposed by Law and Kelton (1997). Since it was not possible to try the solution using the real system, the analysis has been carried out by using a model of the studied system. In line with the operations research approach described in Section 2.3.2 a mathematical model has been constructed to analyze the inventory control policy in the new warehouse. This mathematical model has been solved using an analytical technique according to the inventory literature which will be described in detail in Chapter 3. The mathematical model has been programmed in Visual Basic for Applications (VBA) which is the programming language used in Microsoft Excel.
In the analysis of lead times a more rigorous statistical analysis has been carried out. The theoretical parts related to this analysis will be described in Section 3.3 and the main steps which have been conducted will be specified in Section 6.3.1. However, it can be concluded that two different software have been used to carry out the analysis. Firstly, Stat:fit which is a distribution fitting package that is connected to the
18
simulation program ExtendSim was used (Laguna & Marklund, 2013). Secondly, the numerical computational program Matlab was used to verify and validate the results from Stat:fit.
19
3. Theoretical Background
The theoretical background which will be used in this thesis will be presented in this chapter. Main concepts and important terminology will be explained and connected to later stages in the report.
3.1 Supply chain management
This section describes different elements within the area of supply chain management related to this project.
3.1.1 Supply network
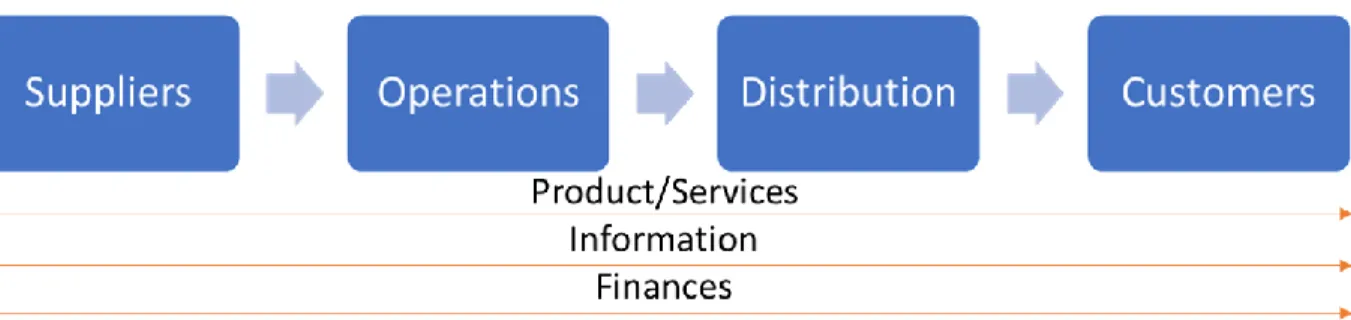
This section introduces the concept of supply chain. This concept is important to understand when describing the material flow and operations of the case company. Mentzer et al (2001) define a supply chain as: “a set of three or more entities involved in the upstream and downstream flow of products, services,
finances and/or information from a source to a customer.” This definition is visualized in Figure 4.
Figure 4. Supply chain adopted from Mentzer et al (2001).
In a supply chain, several independent organizations are involved in transforming raw materials to a finished product and deliver it to the end user in the supply chain, e.g. raw material and components producers, product assemblers, wholesalers, retail outlets and transportation companies are all members of a supply chain (Mentzer et al, 2001). The material that flows between these entities are raw materials, work-in-process, and finished products (Simchi-Levi, Kaminsky & Simchi-Levi, 2003). The flow of information are orders, forecasts, sharing of information such as inventory levels, sales promotion strategies and much more information that is necessary to perform activities and to make decisions (Mentzer et al, 2001). Finally, the cash flow in a supply chain are investments that enable operations and tied-up capital in inventories (Axsäter, 2006).
3.1.2 Distribution network
A distribution network can have many roles such as aggregate, distribute and add value. If a warehouse is placed closer to suppliers the function is more aggregating and on the opposite, distribution, occurs when a warehouse is placed closer to customer. There can also be value adding activities at a warehouse such as postponed assembly and relabeling which means that the warehouse may need to perform many roles at
20
once. The number of echelons and the number of stock locations determine the degree of centralization in a distribution network. By reducing the number of echelons and stock locations, the degree of centralization increases (Johnsson & Mattsson, 2017). In this thesis, centralization mainly concerns reducing the number of stock locations.
The degree of centralization affects the potential to achieve closeness to customer and short delivery times at the trade-off for economic of scale, reduction in non-value adding activities, lower bullwhip effect, reduction in stock and reduced risk for obsoletion. With centralization, the service level from the warehouse will be maintained with less stock, but the time to reach the customer market will increase. (Johnsson & Mattsson, 2017). This theory will be used to evaluate the results from this study and to understand the trade-offs when using a single-echelon network.
3.1.3. The lead time gap
Reduced to its basic essence the goal of managing a supply chain is to match supply and demand. Therefore, most organizations face a fundamental problem: the logistic lead time it takes to procure, make and deliver the finished product to a customer is longer than the time the customer is prepared to wait for it. The challenge is to search for the means whereby the gap between the two times can be reduced if not closed (Christopher, 2011). The time difference between the logistic lead time and the time which the customer is prepared to wait can be described as (3.1). The gap can also be described as the time logistic lead time starts and when the customer order (CO) is registered. This is also called the decoupling point, since the supply chain transits from forecasts to actual customer orders. (Lumsden, 2006).
𝐿𝑒𝑎𝑑 𝑡𝑖𝑚𝑒 𝑔𝑎𝑝 = 𝐿𝑜𝑔𝑖𝑠𝑡𝑖𝑐 𝑙𝑒𝑎𝑑 𝑡𝑖𝑚𝑒 − 𝑂𝑟𝑑𝑒𝑟 𝑓𝑢𝑙𝑙𝑓𝑖𝑙𝑙𝑚𝑒𝑛𝑡 (3.1)
Reducing the gap can be achieved by shortening the logistics lead time whilst simultaneously trying to move the customers’ order cycle upstream in the supply chain by gaining earlier warning of requirements through improved visibility of demand. (Christopher, 2011). What makes this seemingly simple task to match supply and demand so difficult in reality is the presence of uncertainty (Christopher, 2011). According to Hopp & Spearman (2008) variability always degrades the performance of a system and variability will be buffered by some combination of inventory, capacity and/or time. An integral part of this project is to match demand and supply and hence buffer with the right amount of inventory. This project will also investigate the potential cost savings in stock due to reduction in lead time variability.
3.1.4 The Bullwhip effect
Lee, Padmanabhan & Whang (1997) define the bullwhip effect as a phenomenon where orders to the suppliers tend to have larger variance than sales to the buyer (i.e. demand distortion) and the distortion amplifies upstream in the value chain.
Lee et al (1997) continue to describe that the distortion of demand information implies that the manufacturer who only observes its immediate order data will be misled by the amplified demand patterns which will have serious cost implications. For instance, the manufacturer incurs excess raw material cost due to unplanned purchases of supplies, additional manufacturing expenses created by excess capacity, inefficient utilization and overtime. Moreover, the manufacturer incurs excess warehousing expenses and additional
21
transport costs due to inefficient scheduling and premium shipping rates. Simchi-Levi et al (2003) describes that building excess inventory to hedge against the uncertainty will further increase the inventory holding costs.
According to Simchi-Levi et al (2003) there are five main factors which contributes to an increased variability in the supply chain: demand forecasting updating, lead times, batch ordering, price fluctuations and inflated orders. Demand forecasting updates by each individual actor in the supply chain, especially if these are done independently of each other, will increase the uncertainty and thereby also the safety stocks in the upstream supply chain. Also the existence of lead times is a cause of magnified variability since even small demand changes will incur significant changes in inventory control parameters if the lead times are long. For example, reorder points will be changed which will also increase the order quantities. The third mentioned factor causing increased variability is the use of batch quantities in the ordering process. Batching creates large order quantities which are followed by periods with no demand, increasing variability for the upstream supply chain actor. The next contributing factor is price fluctuations. Promotions and discounts will lead to an increased bullwhip effect since retailers will attempt to stock up when prices are lower. Finally, in some shortage situations customers will find out that they may not receive the requested quantity and will then inflate orders to make up for the anticipated shortfalls. This is also a common reason to the bullwhip effect which will increase variability in the supply chain.
Since variability is known to increase costs and reduce customer service, the methods to cope with the bullwhip effect is an extensively researched area. Simchi-Levi et al (2003), Lee et al (1997) and Nahmias (2013) suggest the following methods to decrease the bullwhip effect: reduce uncertainty, reduce variability, break batch quantities, reduce lead times and enter strategic partnerships. Reduced uncertainty could be accomplished by using centralized demand information, i.e. by providing each stage of the supply chain with complete information on actual customer demand, so called point of sales data. However, this can only reduce the bullwhip effect and not eliminate it since different forecast methods and buying practices may exist. Another action that will reduce the bullwhip effect is to reduce the variability originating from the customer demand process. This could be accomplished by using an everyday low pricing strategy. Furthermore, breaking batch quantities into smaller quantities or by receiving more frequent replenishments will also reduce the bullwhip effect. Another action with the same purpose is to reduce the lead times which for example could be accomplished by implementation of electronic data interchange. Finally, by engaging in a number of strategic partnerships, the bullwhip effect can be eliminated. The strategic partnership could include a coordinated inventory planning, transportation and ownership upstream and downstream in the supply chain.
3.2 Inventory control
This section describes the integral parts to create a new inventory policy. Axsäter (2006) explains that the purpose of an inventory control system is to determine when and how much to order and should be based on the expected demand, the stock situation and different cost factors. These areas will be described in this section of the theory chapter and will be used throughout the project. Firstly, the reader will be introduced to the concept of inventory. In this section, concepts from probability theory and statistics will be used. Therefore, a brief overview of relevant statistical topics is given in Section 3.3.1.
22
3.2.1 Inventory
The purpose of inventory is to cover demand over time, since the time it takes to procure, make and deliver a finished product is often longer than the time the customer is prepared to wait for it (Christopher, 2011). The other main reason is economic of scale and uncertainty in demand and lead time (Axsäter, 2006). When a customer demands items, the stock decreases until it is sufficiently low to order a new batch of items. The stock that is left when a new batch arrive is the so-called safety stock. The purpose of safety stock is to guard against variation in demand and lead time. Hence, stock that are not safety stock are often referred to as operational stock (Lumsden, 2006). A conceptual picture of an inventory is shown in Figure 5.
Figure 5. Inventory level as function of time in a conceptual inventory adopted from Lumsden (2006).
3.2.2 Stochastic demand distribution
In practice, demand is often considered random which in a certain period of time can be modelled as a nonnegative stochastic integer (Axsäter, 2006). For example, are components described in Section 4.2.2 demanded as integers. Therefore, it is necessary to find a suitable demand model before determining reorder points and safety stock that should buffer for randomness in demand and lead time.
Altay & Litteral (2013) describes that intermittent demand patterns are often characterized by variable demand sizes that occurs in irregular intervals. Hence, it is preferable to model demand from these two constituent elements: demand size and inter-demand interval. Therefore, the compound distributions (that