1
Evaluation of a Hypervisor Performance
in a Distributed Embedded System
Göran Davidsson
June 9, 2016
Mälardalen University
School of Innovation, Design and Engineering
Thesis for the Degree of Bachelor of Science in Engineering - Computer Network Engineering Examiner: Moris Behnam
Abstract
In modern industrial systems cloud computing plays an important role. Using this technology services are given to customers more efficiently with respect to cost and performance. The main idea of using cloud is that a platform is partitioned among several end users providing a complete isolation among the services. Therefore, the resources are used more effectively instead of assigning a complete platform for only one end user. In order to provide such a partitioning among the services several techniques are already being used. One of the prominent techniques is virtualization. Virtualization can be done with the use of a hypervisor, which is a software that allows running of multiple operating systems on one platform. This thesis aims at measuring the performance of a hypervisor in a distributed embedded system. The metrics for measuring the performance are delays, jitters and throughput that are influenced by different architectures and settings. The thesis also aims at finding out if it is possible to predict the delay, jitter and throughput depending on the number of virtual machines, number of switches and amount of network load. Finally, the thesis investigates whether different settings on the virtual machines influence the performance. For these purposes, a network consisting of two hypervisors and one or two network switches is setup. On each hypervisor several virtual machines are installed. Different tools for measurement of network performance, such as Iperf and Jperf, are installed on the virtual machines. The results show that network load is the main factor influencing the delay, jitter and throughput in the network. The number of switches influence to some degree due to the processing delay. The number of virtual machines has no or very low influence on the network performance. Finally, the results show that alternating configurations on the virtual machines has no observable differences in delay, jitter or throughput, albeit with the limited changes in the settings for this experiment.
Table of contents
1 Introduction ... 1 1.1 Motivations ... 1 1.2 Problem formulation ... 1 1.3 Thesis outline ... 1 2 Background ... 2 2.1 Cloud computing ... 2 2.2 Hypervisors... 2 2.2.1 Citrix Xen ... 2 2.2.2 KVM ... 3 2.2.3 Proxmox ... 3 2.3 Virtual machines ... 32.4 Distributed embedded system ... 3
3 Method ... 4
4 Technical description ... 6
5 Results ... 7
5.1 Delay ... 7
5.2 Max delay, min delay and jitter ... 10
5.3 Comparison of virtual machine’s configurations ... 13
5.4 Throughput ... 15 6 Analysis of results ... 16 7 Related work ... 17 8 Conclusions ... 18 8.1 Summary ... 18 8.2 Limitations ... 18 8.3 Future work ... 18 References ... 19
List of figures
Figure 1: Network topology ... 4
Figure 2: Proxmox GUI [21] ... 5
Figure 3: Topology when using 1 VM on each hypervisor ... 7
Figure 4: Topology when using 2 VMs on each hypervisor ... 7
Figure 5: Delay with 1 VM on each side and 1 switch ... 8
Figure 6: Delay 1 VM on each side and 2 switches ... 8
Figure 7: Delay 2 VMs on each side and 1 switch ... 9
Figure 8: Delay 2 VMs on each side and 2 switches ... 9
Figure 9: Comparison delay 1 switch, 2 switches and 2 switches with inserted load on switch 2... 10
Figure 10: Topology with inserted load on the second switch ... 10
Figure 11: Delay 1 VM 1 switch max, min & jitter ... 11
Figure 12: Delay 1 VM 2 switches max, min & jitter ... 11
Figure 13: Delay 2 VMs 1 switch max, min & jitter ... 12
Figure 14: Delay 2 VMs 2 switches max, min & jitter ... 12
Figure 15: Comparison of delay between different VM configurations (1 load stream) ... 13
Figure 16: Comparison of delay between different VM configurations (2 load streams)... 13
Figure 17: Comparison of delay between different VM configurations (3 load streams)... 14
Figure 18: Difference in delay using 1 or 2 VMs with 1 switch ... 14
Figure 19: Difference in delay using 1 or 2 VMs with 2 switches ... 15
List of tables
Table 1: Comparison of hypervisors ... 41
1 Introduction
In today’s computer networks virtualization is increasingly important [1]. Virtualization is a set of techniques to compose several systems into a single system without jeopardizing their performance or other aspects, such as security. The advantages of virtualization compared to regular servers include reduced power consumption, lower costs for management and increased simplicity in deploying the systems [2]. Virtualization technologies are used in different applications due to their mentioned advantages. For instance, they are used in Cloud environment and Internet of Things. This way, part of a computing resource can be allocated to a client with particular settings, e.g., a particular operating system or software. Cloud systems are partitioned for different end users and due to importance of isolation we need some techniques to provide this isolation. One of these techniques is virtualization. The virtualization is performed by a hypervisor. A cloud system is also a distributed system and in this thesis we emulate a distributed system by using network switches.
Quality of Service is also increasingly important as more and more applications need guarantees when it comes to, for example, delay, jitter and throughput [3]. Delay is a metric describing the time between sending and receiving data in a network [4] and jitter is the metric describing the deviation in delay [5]. Moreover, throughput is the metric describing the maximum traffic accepted by the network [6]. These metrics are important when a service is offered to clients in cloud environment. Therefore, in virtualization the mentioned quality of service should be guaranteed. This thesis focuses on the mentioned aspects in virtualization technologies.
1.1 Motivations
Due to limited resources in hypervisors you need to know how many virtual machines you can create on the hypervisor without risking too much delay or jitter or too low throughput. Moreover, in several applications there is more than one hypervisor distributed over a network. This means that there may be several computing resources communicating through a network, where for each computing resource a hypervisor with several virtual machines are installed. Therefore, the effect of virtual machine on network performance should be verified. This thesis aims at finding out how to apply a hypervisor with all its VMs in a way that it does not create overutilization of the host machine´s resources or congests the surrounding switched network. The switched network itself also influences the network performance, hence it will also be taken into consideration.
1.2 Problem formulation
In this subsection, we formulate the research problem considering the main goal of the thesis described in the previous section.
The first problem to be addressed in this thesis is how large impact on delay, jitter and throughput each virtual machine and Ethernet switch impose with respect to the load that is sent through the network.
The second problem is to find out if there is a way to predict what happens to the three factors, delay, jitter and throughput, for every added virtual machine or switch.
The third problem is whether the configuration of each virtual machine influences the result. For instance, what happens if the amount of RAM is changed?
1.3 Thesis outline
The outline for this thesis is as follows. In Section 2 the background for this thesis will be described. This section is divided into subsections describing more specifically the cloud computing, hypervisors, virtual machines and distributed embedded systems. In Section 3 information about the method of this thesis will be found. Section 3 has a subsection discussing the outcomes. A more detailed technical description about how the hypervisors and VMs are installed and how the tests are conducted, will be found in Section 4. In Section 5 the results ofthis thesis will be presented and in Section 6 an analysis of the results can be found. Section 7 is dedicated to related work and finally Section 8 concludes the thesis. Section 8 is divided into sub-sections giving the reader a summary, discussing limitations and suggesting future work.
2
2 Background
The background section will cover basic information regarding cloud computing, hypervisors, virtual machines and distributed embedded systems.
2.1 Cloud computing
Cloud computing [7] is a way of handling computer resources and letting customers access them without revealing any of the actual hardware. There are many different types of clouds, public clouds, private clouds, community clouds and hybrid clouds. Public clouds are a way for service providers to make different kinds of resources available to everyone. This is a very economical way for the customer since the hardware and infrastructure is provided by the supplier. The customer only pays for capacity used. Private clouds are a way for the companies to have the advantages of cloud functionality while still keeping control of the hardware, functionality and most of all the network security. Since this a very expensive way of cloud computing it is almost always found at large companies. Community clouds are a way for several companies or organizations with common concerns, like security, to cooperate and to spread the costs for cloud computing between themselves. A hybrid cloud is a combination between two or more of the previous mentioned cloud techniques. A hybrid cloud could for example be a combination between a private cloud and a public cloud. Normally, private clouds are used and when a sudden capacity peek occurs the public cloud becomes activated. Another way to use the public cloud is to use it as a backup when the private cloud is not enough.
Cloud computing can be run according to three service models; Software as a Service (SaaS), Platform as a Service (PaaS) and Infrastructure as a Service (IaaS). Software as a Service is the capability for the customer to use applications running on the supplier’s infrastructure. One relevant example for this is Word online. Platform as a Service means that the customer has the possibility to run applications that a customer created on the supplier’s infrastructure. An example of PaaS is web hosting. Infrastructure as a Service means that the customer uses infrastructural resources from the provider. Examples of this can be storage or networks. An example of IaaS is Google Drive.
Mell and Grance [7] lists On-demand self-service, broad network access, resource pooling, rapid elasticity and measured service as five main characteristics of cloud computing. One can summarize the characteristics in a few words; ease of use and flexibility.
2.2 Hypervisors
The actual virtualization is performed bya hypervisor or Virtual Machine Monitor (VMM) [8]. There are two types of hypervisors [8], bare metal (type 1) and hosted (type 2). The difference between a bare metal hypervisor and a hosted hypervisor is that the bare metal hypervisor is run together with the operating system (OS) on the hardware, while the hosted is run on top of a conventional OS, for example Windows, MacOS or Linux. The hypervisor let the VMs share the hardware installed on the hypervisor. It is possible to specify more hardware resources to each VM than actually is installed on the hypervisor. This can be done because all VMs most likely will not use all their allocated resources at once. The downside to this isthe risk of over utilization of the hardware resources and all the problems that may come with that. Here we describe a few common hypervisors with their features.
2.2.1 Citrix Xen
Citrix Xen [9] was first released in 2004 and went in 2013 under the protection of the Linux Foundation. Xen is a bare metal hypervisor [8] and can handle many types of virtualization and it can also handle container-based virtualization [10]. Since containers share a common kernel they themselves can only handle Linux-based operating systems. If a non-Linux operating system is desired one have to choose a virtual machine solution. As almost every hypervisor of today it can virtualize all common OS. Xen itself is Linux based and can for that reason only be run in cooperation with similar OSs. It is also open source and free of charge. It is however possible to become a paying customer which includes additional functionality and support. Handling of Xen is done through a web interface in which all operations of Xen are performed. Several third-party developers have come up with tools to ease the management tasks, such as configuring and in other ways handle the Xen guests that need to be performed on Xen.
3 2.2.2 KVM
KVM [11] is a hosted hypervisor [8]. Just like Xen, KVM can handle many types of virtualization, but not containers, and it is open source and free of charge. The main difference from Xen is the need of a conventional OS on which KVM can be run. Since KVM is part of the host machine’s OS it uses less resources than an external hypervisor would do. Another difference seems to be that there is no possibility to pay for support. Since KVM is a hosted hypervisor you handle the hypervisor and all its VMs in the application window. There are also a large number of management tools available for KVM. Different tools support access to the hypervisor via several different types of interfaces. This can be for instance via web, Command Line Interface (CLI), mobile, tablet and desktop. KVM has been, via the Open Virtualization Alliance [12], promoted by companies such as IBM, HP and Intel [13], as an open source alternative in virtualization.
2.2.3 Proxmox
When it comes to functionality Proxmox [14] is most similar to Xen. If you instead look at the structure it is more like KVM since it is based on KVM virtualization. Beyond the ability to virtualize it can, also handle containers. This possibility to use both virtualization and containers gives Proxmox an important flexibility compared to hypervisors supporting only one technique. One other strength that Proxmox holds is the possibility for live migration. The possibility to move a running virtual machine to another with none or at least very short downtime is the key principle of live migration. This feature can be particularly important in critical environments such as in hospitals and similar places. Like Xen, Proxmox is a bare metal hypervisor. As both Xen and KVM it can virtualize most common OS. Proxmox is handled via a web interface. In this interface all functions regarding the hypervisor itself and all the VMs and containers are handled. Proxmox is supported by Proxmox Server Solutions GmbH company and the Open Virtualization Alliance [12].
2.3 Virtual machines
Virtualization is a technique [15] that enables multiple operating systems (OS), called Virtual Machines (VM) [16] to be run on a single host machine. The VM is an operating system run as if it was a software. The VM shares the hypervisor’s hardware with other VMs. By doing so the hypervisor’s hardware can be utilized in a more efficient and better way. As the VMs are isolated from their software perspective, they cannot access each other’s data. Another important aspect is that for each VM a portion of RAM size is allocated. The total amount of RAM size for all VMs on a system should not exceed the system RAM size. Normally, assigning the RAM size is a challenge as it plays a very important role in the latency of running the applications on VMs.
2.4 Distributed embedded system
Distributed embedded systems [17], [18] is a function which is spanned over several embedded systems. For instance, a surveillance function works over a network with several cameras and central monitoring system. In this thesis we use this definition somewhat wider. We see the use of network switches as a form of distributed system. In order to have a simple distributed system, we have used laptops to install the hypervisors, and we use switched Ethernet network to enable the communication among them. Although we have not used an embedded system for this thesis, each laptop can resemble the embedded system as we are mostly focusing on the performance of hypervisors rather than the embedded systems.
4
3 Method
To be able to do the measurements desired for this thesis a network topology needs to be created. As shown in Figure 1 the topology will consist of two hypervisors and one or two switches connected in a line topology. The switches are Cisco WS/2960-24TT-L with OS version 12.2. Hypervisor 1 is a laptop DELL Latitude E6230 and hypervisor 2 is a laptop HP ProBook 450 GO.
Figure 1: Network topology
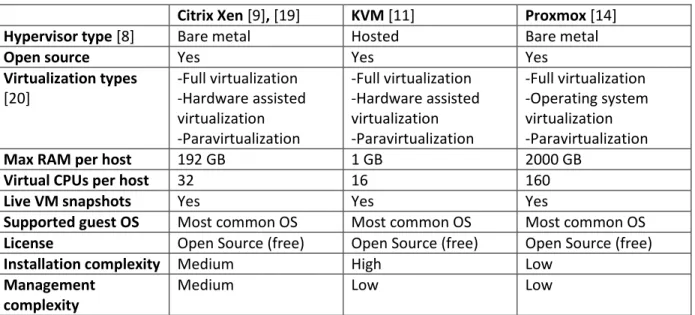
To be able to choose a suitable hypervisor for this thesis some candidates have been chosen. Prerequisites for the hypervisor is that it must be open source and free of charge. Citrix Xen [9], Kernel Virtual Machine (KVM) [11] and Proxmox [14] were chosen as candidates as they all meet the basic requirements. A comparison between the three was made and the summarized results are shown in Table 1. Although there are many more parameters to compare, the significant ones for this evaluation are taken into account.
Table 1: Comparison of hypervisors
Citrix Xen [9], [19] KVM [11] Proxmox [14]
Hypervisor type [8] Bare metal Hosted Bare metal
Open source Yes Yes Yes
Virtualization types [20] -Full virtualization -Hardware assisted virtualization -Paravirtualization -Full virtualization -Hardware assisted virtualization -Paravirtualization -Full virtualization -Operating system virtualization -Paravirtualization
Max RAM per host 192 GB 1 GB 2000 GB
Virtual CPUs per host 32 16 160
Live VM snapshots Yes Yes Yes
Supported guest OS Most common OS Most common OS Most common OS
License Open Source (free) Open Source (free) Open Source (free)
Installation complexity Medium High Low
Management complexity
Medium Low Low
After evaluation of the hypervisors, we have chosen Proxmox. The reasons include its high amount of RAM per host support, virtual CPU capacity, easy to install and management, and having a user friendly interface. Figure 2shows the GUI of Proxmox.
5 Figure 2: Proxmox GUI [21]
To be able to measure delay, jitter and throughput in the network appropriate tools for that are needed to be installed. For delay and jitter Ping was chosen. Ping is a program included in the operating system and is suitable for this purpose. Iperf [22] and Jperf [23] were chosen to measure throughput. These tools have been successfully used in many previous works, such as [24], [25] and [26] to name a few. Iperf is the tool that measures throughput, while Jperf is a graphical tool designed to handle Iperf and to present the results.
When all the installations are done the actual measuring starts. The first step is to establish a baseline. This is done by measuring the delay, jitter and throughput with one VM on each hypervisor and one switch between them. This is the smallest possible network to build and is therefore suitable as a baseline. It should be noted that two hypervisors can be also connected peer-to-peer without any switch in the network. However, the focus of the thesis is measuring the performance of the system in a network where switches impose delays and jitter. Therefore, the baseline for this thesis includes at least one Ethernet switch. The next step is to start varying the number of VMs on the hypervisors, the number of switches in the network and the load on the network. The thesis also aims at finding out whether the configuration of the actual VMs influence the results. That can be done for instance by changing the amount of memory available to each VM. The third step is to evaluate all the results received. The evaluation also includes finding out if there is predictability in the results.
6
4 Technical description
For measurement of delay the operating system integrated tool Ping is used. Out of the Ping measurements both min-, average- and max-value could be read. The measurement stream was throughout all the measurements a stream of one thousand packets of the size 1500 bytes sent every 100 milliseconds. The packet size 1500 bytes is chosen because this is the default packet size with no packet fragmentation in Cisco switched networks [27]. For every different setting two measurements is conducted. The reason is to minimize the effects of extreme values. To be able to minimize the effects of extreme values ever more an average is taken out of the two measurements. The average values between the two measurements are the ones presented in the graphs in Section 5.
The load streams are different loads divided into one, two or three separate streams sent from both hypervisor sides to the other. The actual senders and receivers are of course VMs and not the hypervisors themselves. A total load of for instance 30000 bytes would be divided into 1*30000 bytes, 2*15000 bytes or 3*10000 bytes. The load is sent once every 10 milliseconds because Ping uses 10 milliseconds as the sending interval when flooding. Ping can actually send even faster if the replies come back faster than 10 milliseconds, but when conducting the measurements, a fixed interval is needed to be able to replicate the measurements. Note that the specified load is the load in each direction. The actual load in the network is two times the values in the charts in Section 5.
On the switches, interfaces with a maximum throughput of 100 Mbit per second have been used, so all results are based on those limitations. The switches are equipped with two 1 Gigabit interfaces but they were not used in this thesis.
The hypervisors are installed using all the default values in each step of the installation process. On each hypervisor five VMs are installed. Each VM is configured with one virtual CPU, 30 GB of disc space and 1 GB of RAM. All other settings are configured with the suggested default settings.
Due to limitations in what could be changed, in terms of hardware, the tests of performance with different configurations on the VMs are only conducted with different amount of RAM memory available.
7
5 Results
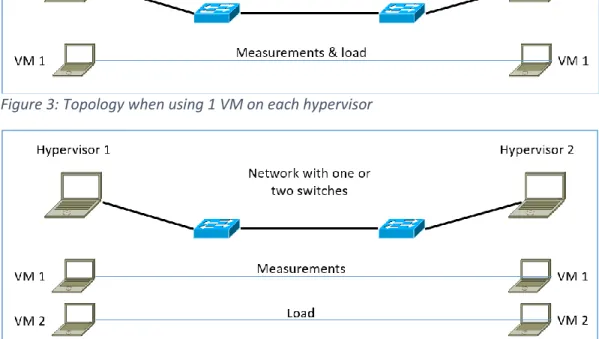
When using one VM on each hypervisor for the measurements the topology looks as shown in Figure 3. It shows that both the measurements and the load streams are done on the only VM started. If instead two VMs on each hypervisor are used, as shown in Figure 4, the measurements are conducted on one pair of VMs and the load are conducted on a second pair of VMs. Note that in the figures two switches are connected in a line topology. However, in the measurements we use a single-switch network and two-switches network as different settings. Here we present the results of the measurements.
Figure 3: Topology when using 1 VM on each hypervisor
Figure 4: Topology when using 2 VMs on each hypervisor
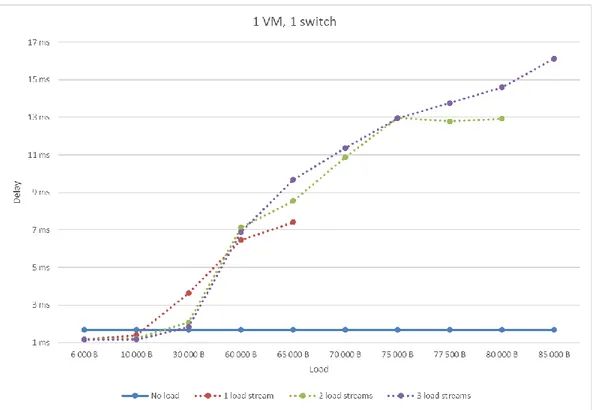
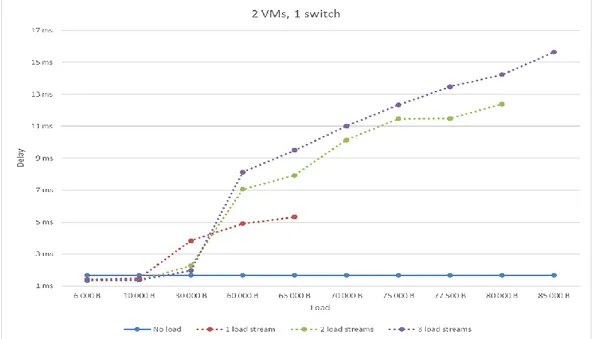
Note that all measurements, displayed as delay in the following graphs, actually measure Round-Trip-Time due to the functionally of Ping. The results include both processing delay and network delay. If the delay in one direction is needed, all the results can simply be divided by two as both directions have the same amount of load. Also note that the load specified in the graphs is the total load in each direction. Ping has an upper limit of around 65000 bytes when it comes to packet size. That is why the curves, in the following charts, showing one stream of load ends at 65000 bytes. For two or three simultaneous streams the maximum total load is around 80000 to 85000 bytes. With even higher load the network gets congested and the delay increases enormously and packet loss is introduced. Note that the figures present the average delays. However later in this section the maximum and minimum measured delays are also presented in separated figures
5.1 Delay
Figure 5 shows the delay when using one VM on each hypervisor and using one switch between the hypervisors. One can see that as the load gets larger the delay increases. Moreover, for small load, it is advantageous to divide the load into multiple streams. However, in case of larger load it is not true. The blue line in the figure shows the no load situation where the delay is constant. The maximum delay that is measured when there is one load stream in the system is slightly more than 7 ms. In addition, when the load has 3 streams, the delay reaches to approximately 16 ms. An important observation is that by increasing the streams in the load, the delay slightly increases. However, the whole trend is the same. At the beginning when the load is less than 10KB, the delay is less than no-load situation. The reason for that is unknown, but extensive measurements with no load confirms the results so occasional problems can be ruled out as the cause.
8 Figure 5: Delay with 1 VM on each side and 1 switch
Figure 6 shows the delay when using one VM on each hypervisor and using two switches between the hypervisors. One can see that as the load gets larger the delay increases, similarly to the previous measurements with only one switch in the network. The difference from the results in Figure 5 is that the introduction of a second switch increases the delay with around 200 µs which is the processing delay in the switch. One other difference is also that with two switches it is possible to have higher total load for two simultaneous streams before the network gets congested. The delay is not sharply increase by adding the second switch. The reason is that the same load is crossing both switches. Therefore, the load is already delayed in the first switch and do not get more in the second because there is no extra load just in the second switch. If there is another source of delay only for the second switch, we could see higher difference between a single-switch network and two-switches network.
9
Figure 7 shows the delay when using two VMs on each hypervisor and using one switch between the hypervisors. One can see that as the load gets larger the delay increases. One can see that, for small load, it is advantageous to divide the load into multiple streams. However, when there is a larger load it is not true. If a comparison is made with a system using only one VM on each hypervisor (as in Figure 3) one can see that for small load it is a disadvantage to use multiple VMs but the opposite for heavy load. Another observation is that the trend of delay is slightly higher than when there is only one VM on each hypervisor. The maximum measured delay is when there are 3 streams of load in the system and it is above 15 ms.
Figure 7: Delay 2 VMs on each side and 1 switch
Figure 8 shows the delay when using two VMs on each hypervisor and using two switches between the hypervisors. One can see that as the load gets larger the delay increases. One can see, if a comparison is made with a network using only one VM on each hypervisor (as in Figure 6), that it is disadvantageous to use multiple VMs for small network load but advantageous for heavy load. Note that similar to the case where only one VM is installed on each hypervisor, the effect of the second switch is very low.
10
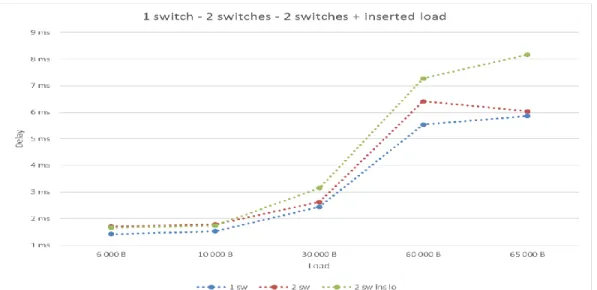
Figure 9 shows the difference in delay when using 1 switch, two switches and two switches with extra load inserted on the second switch. One can observe that the delay increases as the load gets heavier. It is also observable that the introduction of a second switch does not increase the delay with more than the processing delay of around 200 µs. If, on the other hand, extra load is inserted on the second switch as illustrated in Figure 10, the delay increases significantly. The increase in delay is because the inserted load ends up in the same queue as the load from the first switch, hence the delay increases.
Figure 9: Comparison delay 1 switch, 2 switches and 2 switches with inserted load on switch 2
Figure 10: Topology with inserted load on the second switch
5.2 Max delay, min delay and jitter
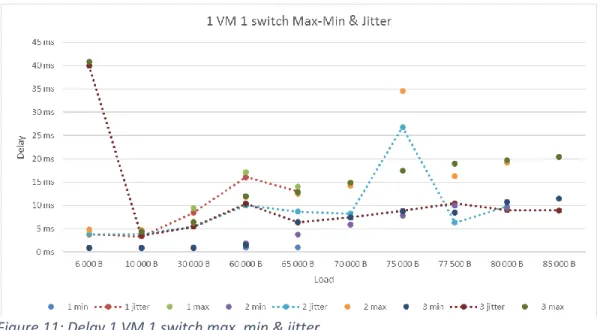
Figure 11 shows the max- and min-delay and the delay jitter when using one VM on each hypervisor and one switch in the network. The number in the series descriptions indicates the number of simultaneous load streams. The measurements with one simultaneous load stream ends at 65000 bytes due to the packet size limitation of 65000 bytes for Ping. The curves with just dots are showing the maximum and minimum values of the measurements. The curves with dotted lines shows the jitter. The minimum and maximum values increase as the load get heavier. The jitter increases from around 4 ms to approximately 10 ms as the load gets heavier. Some extreme values can be observed but the results increase relatively linearly. The extreme values can be explained as temporary packet delays. One can also observe that the jitter is higher if the load is divided into fewer simultaneous streams.
11 Figure 11: Delay 1 VM 1 switch max, min & jitter
Figure 12 shows the max- and min-delay and the delay jitter when using one VM on each hypervisor and two switches in the network. The number in the series descriptions indicates the number of simultaneous load streams. The curves with just dots are showing the minimum and maximum values of the measurements. The curves with dotted lines shows the jitter. The minimum and maximum values increase as the load get heavier. The jitter increases from around 4 ms to approximately 10 to 12 ms as the load gets heavier. Some extreme values can be observed but the results generally increase linearly. One can also observe that the jitter is higher if the load is divided into fewer simultaneous streams. If one compares the use of one or two switches it is observable that the values are almost the same but no extreme values can be observed.
Figure 12: Delay 1 VM 2 switches max, min & jitter
In both Figure 11 and 12 one can see that the jitter, for two and three simultaneous streams, has a small peak around 60000 bytes of total load.
12
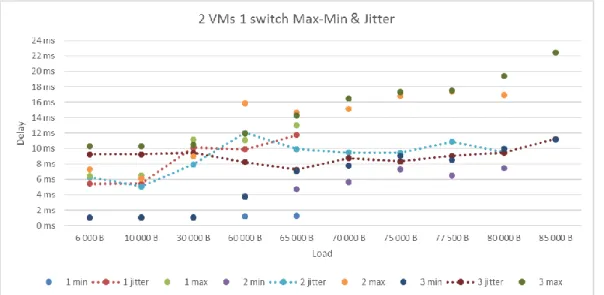
Figure 13 shows the max- and min-delay and the delay jitter when using two VMs on each hypervisor and one switch in the network. The number in the series descriptions indicates the number of simultaneous load streams. The curves with just dots are showing the maximum and minimum values of the measurements. The curves with dotted lines shows the jitter. The minimum and maximum values increase as the load get heavier. The jitter increases from around 4 ms to approximately 10 ms as the load gets heavier. One can observe that the jitter is higher if the load is divided into fewer simultaneous streams.
Figure 13: Delay 2 VMs 1 switch max, min & jitter
Figure 14 shows the max- and min-delay and the delay jitter when using two VMs on each hypervisor and two switches in the network. Measurements with one simultaneous load stream ends at 65000 bytes due to the packet size limitation of 65000 bytes for Ping. The curves with just dots are showing the maximum and minimum values of the measurements. The curves with dotted lines shows the jitter. The minimum and maximum values increase as the load get heavier. The jitter increases from around 4 ms to approximately 10 ms as the load gets heavier. One can observe that the jitter is higher if the load is divided into fewer simultaneous streams
13
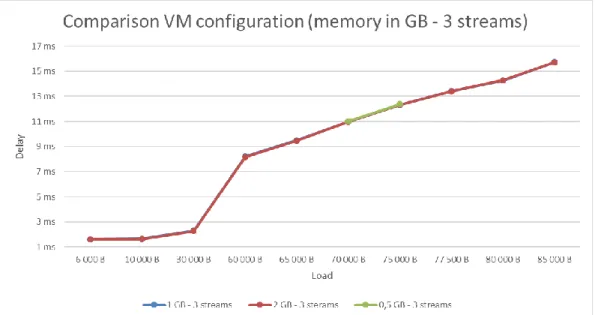
5.3 Comparison of virtual machine’s configurations
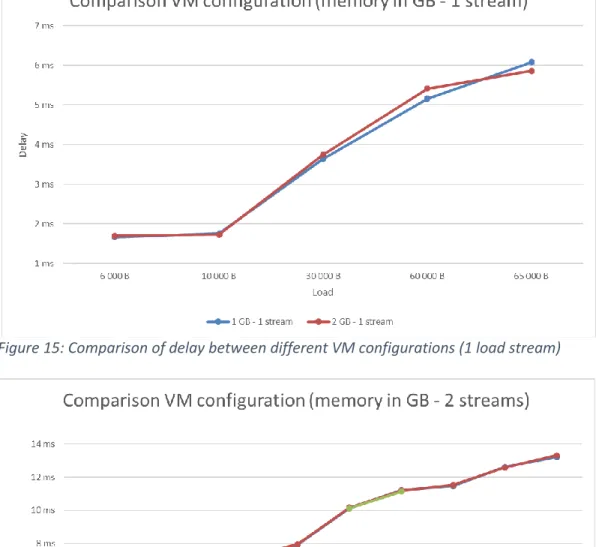
Figure 15, 16 and 17 shows the difference in delay using different amount of RAM on the VMs. The series descriptions consist of two numbers. The first represents the configured RAM memory, in gigabytes, for the VM while the second number represents the number of simultaneous load streams. The tests are conducted with two VMs on each hypervisor and with two network switches as depicted in Figure 4. One can observe that the results are almost identical, for the same amount of load and with the same number of simultaneous load streams, no matter how much memory each VM has available. This is why it looks like there is only one curve in the charts when it is actually two or three curves. In Figure 15 it is possible to distinguish the different curves but almost impossible in Figure 16 and 17.
Figure 15: Comparison of delay between different VM configurations (1 load stream)
14
Figure 17: Comparison of delay between different VM configurations (3 load streams)
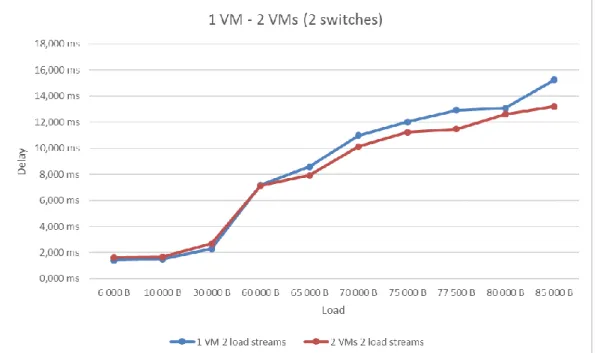
Figure 18 shows the difference in delay when one or two VMs in combination with 1 switch. These tests are conducted with two simultaneous streams on the second pair of VMs. One can conclude that, for low load, it is an advantage to use fewer VMs, but an advantage, for heavier load, to use more VMs.
15
Figure 19 shows the difference in delay when one or two VMs in combination with 2 switches. These tests are conducted with two simultaneous streams on the second pair of VMs. One can conclude that, for low load, it is an advantage to use fewer VMs, but an advantage, for heavier load, to use more VMs.
Figure 19: Difference in delay using 1 or 2 VMs with 2 switches
5.4 Throughput
Table 2 shows the results of the measurements on throughput. One can observe that a decrease in throughput corresponds to an increase in packet loss. The sum of throughput and packet loss is almost the same no matter the load in the network.
Table 2: Results of throughput measurements
Load Throughput Packet loss
0 B 95,2 Mbit/s 0 %
30000 B 86,8 Mbit/s 7 %
16
6 Analysis of results
The first conclusion that can be drawn from the results is that when there is small load in the system lower number of virtual machines is suitable. As the load increases it gets, on the other hand, more and more of an advantage to use more VMs. As shown in Figure 13 and Figure 14 this trend is the same whether one or more switches are used in the network as long as there is no extra load imposed from other computers or hypervisors to the other switches.
Another conclusion from the results is that the amount of load directly affects the delay of streams in the network. However, for higher load it is advantages if the load is divided into fewer streams. This is shown in Figure 3 to Figure 6 and one can also see that it is not affected by neither the number of VMs or switches. One can also observe that, when using only one switch, the total load can be higher before the network gets congested with the load divided into more streams. As shown in Figure 3 and Figure 5 the curves stop at lower load with fewer streams than with more.
A third conclusion to be made, as shown in Figure 7, is that adding a second switch in the network does not add any extra network delay but only around 200 µs of processing delay due to the second switch. If on the other hand, extra load is inserted on the second switch, some significant increase in delay, at least for higher load, can be observed. This is also shown in Figure 7.
When comparing different configurations on the VMs one can conclude that the available RAM memory on the VMs does not influence the delay. This is illustrated id Figure 12. What can be observed (not in the graphs) is that with less available memory it takes longer to start the actual measurements. With very high load it was almost impossible to start the measurements since the VMs froze due to lack of available memory. This could give a poor user experience and that is a very important factor to consider. Therefore, you have to draw the conclusion that more available memory is recommended. Finally, the tests of throughput shown in Table 2, revealed that the baseline is a maximum throughput of around 95.2 Mbit/s on a 100 Mbit/s interface. This means that almost 5% of the available bandwidth is lost from start. As also can be seen in Table 2 is that as the throughput decreases due to heavy load the packet loss increases. The most interesting thing is that the throughput combined with packet loss sums up, almost exactly, to the baseline value. The measurements show that a decrease in throughout can be explained with packet loss.
The first problem for this thesis was to find out how the VMs and the switches influence the delay, jitter and throughput in the network. The results show that delay increases with around 200 µs for every switch introduced in the network. This is the processing delay in each switch. Other than that the delay only increases when the total network load increases or if extra load is inserted in the network. Regarding jitter there is no observable differences due to the introduction of more switches. Increased jitter is, on the other hand, a consequence as the network load increases. Neither delay nor jitter changes notably when more VMs are introduced. When looking at throughput one can conclude that the network will send packets as fast as possible (around 95.2 Mbit/s) up to the point where the network gets congested. This point differs slightly depending on the network setup. When this point is reached a decrease in throughput is explained by packet loss.
The second problem in the thesis was to see if there is a way to predict the delay, jitter and throughput when introducing more switches or VMs. The only clear observable predictability that can be found among all the results is the 200 µs delay increase for every introduced switch. It should be noted that in the setting two switches are connected in a line topology and there are only 2 hypervisors. Therefore, the second switch does not have extra load than from the first switch. The results showed that the delays are increasing relatively linear to the load in most of the cases. However, an exact mathematical expression cannot be made due to several parameters that play in the system.
The answer to the third question is that there seem to be no difference in delay, jitter or throughput when different settings on the VMs are compared. The only difference observable when it comes to the configurations of the VMs is that with lower memory it takes longer to execute programs.
17
7 Related work
McDougall and Anderson [28] describe the importance of throughput and delay performance, for the virtualized environment, to be as close to a native environment as possible. They argue that the virtualization itself could pose a problem depending on how the physical resources are handled by the hypervisor. They also argue that the performance of hypervisors has improved significantly over the last few years and nowadays is very close to a native environment. That conclusion is verified by the measurements in the thesis. Nothing in the results indicate that the virtualized environment itself entail any negative effects compared to a native environment.
Chauhan and Makaroff [29] focus on the client perspective when running a VOD server in a VM environment. The authors measure the performance regarding delay and jitter from the client perspective. Their measurements show that the network suffers from extensive delay and jitter when the video stream is run parallel to a heavy workload. They believe that, despite these results, there are techniques to keep these problems from becoming big issues. In this thesis, high jitter and delays in specific settings are measured, yet not as what the work presented in their settings.
Felter et al. [30] make comparisons between VMs and containers. They measure the throughput and compare native, virtualized and container based environments. The authors come to the conclusion that container based environments equal or exceed the performance of a virtualized environment. To some extent this work is connected to the measurements in the thesis. As Proxmox also can create containers this could be an interesting future work.
Morabito et al. [31] measure performance and compare traditional hypervisor based VMs with container based solutions. They conclude that the performance of VMs have improved over the years and only pose issues in some cases. The authors also conclude that the container based solutions perform very well with respect to network performance. The downside with containers is their lower level of security. The measurements in this thesis are consistent with the findings of Morabito et al. regarding the performance of VMs.
Kovari and Dukan [32] talk about the increasing popularity of cloud computing and explain the difference between the three basic models of cloud computing, which are SaaS, PaaS and IaaS. The authors also talk about the different kinds of virtualization. They briefly describe the basic differences between those techniques and give examples of programs using these different techniques. They also describe container virtualization. Kovari and Dukan then make a thorough comparison between Open Node and Proxmox VE. They conclude that Proxmox is the most popular alternative out of the two due to its ease of use and because it has a very powerful portfolio of functions and features.
18
8 Conclusions
Cloud computing becomes a wide spread technology in industrial systems. In this thesis, we focused on a specific technology, which is called hypervisor, in order to perform virtualization. For this purpose, we made a distributed system including two switches and two hypervisors, and we measured some criteria with respect to changing parameters in the system.
In this thesis, three problems to investigate are defined. The first one was to investigate the effect of number of virtual machines and Ethernet switches on delay, jitter and throughput. The second defined challenge was to see if there is a way to predict the delays and jitters. Finally, the effect of VMs configuration on the result was defined.
8.1 Summary
In this work we had different architectures, such as one or two switches as well as different number of virtual machines. Then we measured the delay, jitter and throughput in several settings. We found that delay mainly is influenced by the network load. When network load increases, delay also increases. Delay is also affected by the introduction of more switches but only with around 200 µs which is the processing delay. However, when an extra delay was added to the second switch a significant delay compared to previous setting was observed. Jitter also increases as the network load increases. Like delay, jitter seems to increase in a relatively linear way but the curves are not as steep as the showing delay. Regarding throughput, we found that the throughput remains around maximum all the way up to the point where the network load makes the network congested. The throughput after that point decreases and we found that the decrease in throughput is represented by packet loss.
8.2 Limitations
The physical hardware was the biggest limitation to this work. The computers and switches were provided by the university and could not be altered to influence the performance of them by, for example, changing the amount of RAM or trying different types of hard drives. Another limitation was that all results will be specific with respect to the equipment provided. General conclusions were therefore difficult to obtain.
8.3 Future work
For future work it would be interesting to evaluate different types of network equipment, for instance routers, and see how they influence the performance. In addition, the distributed system which is installed in this thesis contained only two hypervisors and two switches in line topology. It would be interesting to change the topology to star with more than one nodes connected to the switches to see the influence on the network and hypervisors performance. It would also be interesting to explore how the performance is influenced if Quality of Service is implemented in the network. For example, how can the delay and jitter change when more than one queue per switch port are configured. One other thing which could be worth investigating is Proxmox containers compared to virtual machines.
19
References
[1] G. Vallee, T. Naughton, C. Engelmann, H. Ong and S. L. Scott, "System-Level Virtualization for High Performance Computing," in 16th Euromicro Conference on Parallel, Distributed and Network-Based Processing, 2008. PDP 2008, Toulouse, 2008.
[2] N. R. Challa, "Hardware Based I/O Virtualization Technologies for Hypervisors, Configurations and Advantages - A Study," in IEEE International Conference on Cloud Computing in Emerging Markets (CCEM), Bangalore, 2012.
[3] T. Slattery, "QoS - It Really Is Important," No jitter, 04 September 2014. [Online]. Available: http://www.nojitter.com/post/240168964/qos--it-really-is-important. [Accessed 24 February 2016].
[4] A. Abdelkefi and Y. Jiang, "A Structural Analysis of Network Delay," in 2011 Ninth Annual Communication Networks and Services Research Conference (CNSR), Ottawa, 2011.
[5] H. Pucha, Y. Zhang, M. Z. Mao and C. Y. Hu, "Understanding network delay changes caused by routing events," in 2007 ACM SIGMETRICS international conference on Measurement and modeling of computer systems , New York, 2007.
[6] P. López, R. Alcover, J. Duato and L. Zúnica, "Optimizing network throughput: optimal versus robust design," in Proceedings of the Seventh Euromicro Workshop on Parallel and Distributed Processing, 1999. PDP '99, Funchal, 1999.
[7] P. Mell and T. Grance, "The NIST Definition of Cloud Computing," National Institute of Standards and Technology, Gaithersburg, MD, 2011.
[8] M. Rouse, "Hypervisor," TechTarget, October 2006. [Online]. Available: http://searchservervirtualization.techtarget.com/definition/hypervisor. [Accessed 7 April 2016]. [9] "Xen Homepage," [Online]. Available: http://www.xenproject.org/. [Accessed 7 April 2016].
[10] M. Rouse, "container-based virtualization (operating system-level virtualization)," TechTarget, [Online]. Available: http://searchservervirtualization.techtarget.com/definition/container-based-virtualization-operating-system-level-virtualization. [Accessed 19 May 2016].
[11] "KVM Homepage," [Online]. Available: http://www.linux-kvm.org/page/Main_Page. [Accessed 7 April 2016].
[12] "Open Virtualization Alliance Homepage," [Online]. Available: https://openvirtualizationalliance.org/. [Accessed 23 May 2016].
[13] R. Millman, "Is it time to give KVM hypervisor a go?," techradar.pro, 9 May 2013. [Online]. Available: http://www.techradar.com/us/news/software/applications/is-it-time-to-give-kvm-hypervisor-a-go--1150037. [Accessed 23 May 2016].
[14] "Proxmox Homepage," [Online]. Available: https://www.proxmox.com/en/. [Accessed 7 April 2016].
[15] M. Rouse, "Virtualization," TechTarget, December 2010. [Online]. Available: http://searchservervirtualization.techtarget.com/definition/virtualization. [Accessed 5 April 2016]. [16] M. Rouse, "Virtual Machine," TechTarget, October 2014. [Online]. Available:
http://searchservervirtualization.techtarget.com/definition/virtual-machine. [Accessed 8 April 2016].
[17] "Distributed Computing Systen," techopedia, [Online]. Available: https://www.techopedia.com/definition/7/distributed-computing-system. [Accessed 23 May 2016].
[18] M. Rouse, "Embedded system," TechTarget, May 2009. [Online]. Available: http://internetofthingsagenda.techtarget.com/definition/embedded-system. [Accessed 23 May 2016].
20 [Accessed 13 May 2016].
[20] K. Hwang, G. C. Fox and J. J. Dongarra, in Distributed and Cloud Computing: From Parallel Processing to the Internet of Things, Elsevier, 2011, pp. 140-144.
[21] "Proxmox," [Online]. Available: http://www.proxmox.com/en/proxmox-ve. [Accessed 10 May 2016].
[22] "Iperf Homepage," [Online]. Available: https://iperf.fr/. [Accessed 8 April 2016].
[23] "Jperf Homepage," [Online]. Available: https://github.com/AgilData/jperf. [Accessed 8 April 2016]. [24] V. J. D. Barayuga and W. E. S. Yu, "Packet Level TCP Performance of NAT44, NAT64 and IPv6 Using
Iperf in the Context of IPv6 Migration," in 5th International Conference on IT Convergence and Security (ICITCS), Kuala Lumpur, 2015.
[25] O. Olvera-Irigoyen, A. Kortebi, L. Toutain and D. Ros, "Available bandwidth probing in hybrid home networks," in 18th IEEE Workshop on Local & Metropolitan Area Networks (LANMAN), Chapel Hill, NC, 2011.
[26] L. Mazalan, S. S. S. Hamdan, N. Masudi, H. Hashim, R. A. Rahman, N. M. Tahir, N. M. Zaini, R. Rosli and H. A. Omar, "Throughput analysis of LAN and WAN network based on socket buffer length using JPerf," in IEEE International Conference on Control System, Computing and Engineering (ICCSCE), Mindeb, 2013.
[27] in Catalyst 2960-X Switch Interface and Hardware Component Configuration Guide, Cisco IOS Release 15.0(2)EX, San Jose, Cisco, 2013, p. 76.
[28] R. McDougall and J. Anderson, Virtualization performance: perspectives and challenges ahead, 2010, pp. 40-56.
[29] J. Chauhan and D. Makaroff, "Performance evaluation of video-on-demand in virtualized environments: the client perspective," in VTDC '12 Proceedings of the 6th international workshop on Virtualization Technologies in Distributed Computing, Delft, 2012.
[30] W. Felter, A. Ferreira, R. Rajamony and J. Rubio, "An Updated Performance Comparison of Virtual Machines and Linux Containers," in 2015 IEEE International Symposium on Performance Analysis of Systems and Software (ISPASS), Philadelphia, 2015.
[31] R. Morabito, J. Kjällman and M. Komu, "Hypervisors vs. Lightweight Virtualization: A Performance Comparison," in 2015 IEEE International Conference on Cloud Engineering (IC2E), Tempe, Az, 2015. [32] A. Kovari and P. Dukan, "KVM & OpenVZ virtualization based IaaS Open Source Cloud Virtualization Platforms: OpenNode, Proxmox VE," in 2012 IEEE 10th Jubilee International Symposium on Intelligent Systems and Informatics , Subotica, 2012.
[33] M. Rouse, "Paravirtualization," TechTarget, [Online]. Available: http://searchservervirtualization.techtarget.com/definition/paravirtualization. [Accessed 19 May 2016].