Detecting sleepiness by Optalert
Final report
ViP publication 2010-2
Authors
Christer Ahlström, VTI Jan Andersson, VTI
Anna Anund, VTI Emma Börjesson, Scania Hanna Johansson, Scania Johanna Johnsson, Scania
Preface
Efficiency and Acceptance Assessment of two Different HMI Solutions for Drowsiness Detection System is a collaborative project between Scania AB and VTI within the
competence centre Virtual Prototyping and Assessment by Simulation (ViP). The project has two main goals:
Assessment of two different HMI solutions for drowsiness detection systems (classified).
Evaluation of the Optalert system for drowsiness detection.
This report describes the second part of the project. The study was conducted in the VTI driving simulator II in 2009 and was financed by the competence centre Virtual
Prototyping and Assessment by Simulation (ViP).
Participants from Scania were Emma Börjesson, Hanna Johansson and Johanna Johnsson.
Participants from VTI were Christer Ahlström, Jan Andersson and Anna Anund.
Linköping, April 2010
Quality review
Peer review was performed on 2010-03-18 by Arne Nåbo (Saab Automobile AB) and on 2010-03-15 by Staffan Davidsson (Volvo Car Corporation). Christer Ahlström and Jan Andersson have made alterations to the final manuscript of the report. The ViP Director Lena Nilsson examined and approved the report for publication on 2010-04-23.
Table of contents
Executive summary ... 5
1 Introduction ... 7
1.1 Aim... 7
2 The Optalert system... 8
3 Methodology ... 10
3.1 Participants ... 10
3.2 Background questionnaire and manipulation checks ... 10
3.3 Driving task ... 10
3.4 Design and procedure... 10
3.5 Driving simulator and scenario ... 12
3.6 Sleepiness indicators ... 13
3.7 Statistical analysis ... 15
4 Results ... 16
5 Discussion ... 21
5.1 The Optalert fatigue management system ... 21
5.2 Methodology ... 21
5.3 Results ... 23
6 Conclusion ... 24
References ... 25 Appendix 1: Swedish summary
Detecting sleepiness by Optalert – Final report
By Christer Ahlström, Jan Andersson, Anna Anund, Emma Börjesson*, Hanna Johansson* and Johanna Johnsson*
Swedish National Road and Transport Research Institute (VTI) SE-581 95 Linköping Sweden
Executive summary
Many crashes with heavy vehicle can be attributed to driver sleepiness or driving impairment due to sleepiness, and it is important to find methods to predict those situations and counteract this problem. The Optalert fatigue management system claims to be able to detect sleepiness. The aims of this study are to (a) evaluate if Optalert can detect sleepiness equally well as other sleepiness indicators and (b) if the data patterns obtained by Optalert correlates with these other sleepiness indicators. Twelve sleep deprived truck drivers drove for about 90 minutes in an advanced moving base truck simulator. The experimental setup, including the sleep deprivation, was designed so that the drivers should become increasingly sleepier during the trial and the intention was that they should fall asleep during the experiment.
Four different indicators of sleepiness or driving impairment due to sleepiness were used to monitor the state of the drivers; the Karolinska Sleepiness Scale (KSS), the variability in lateral position (SDLP), the blink duration and the Optalert system. The results show that all four sleepiness indicators increased with time on task. An analysis of variance revealed that the changes were significant for KSS, blink duration and the Optalert system, and a correlation analysis showed that Optalert correlated significantly with blink duration and SDLP. However, even though these correlations were
significant, they were all rather low with a maximum correlation coefficient of 0.24. In conclusion, the Optalert system is promising and the sleepiness rating provided by the system works at least equally well as the other three sleepiness indicators. There are some practical limitations to the system; there is no reliable threshold which can be used to determine when a driver is getting too sleepy to drive (this is also the case for other available sleepiness indicators), the driver needs to be attached to the vehicle via the spectacle frames and a wire, and the quality of the eye movement recordings often deteriorated when the driver started driving the truck. Moreover, during the experiment the technical reliability was sometimes low.
1
Introduction
Sleepiness is a major problem for road safety. The National Transportation and Safety Board (US) has stated that sleepiness while driving is one of the most important contributing factors for road crashes (NTSB, 1999), and it has been indicated that 20–30 per cent of all heavy vehicle accidents can be directly or indirectly attributed to fatigue-related impairment of the driver (House of Representatives Standing Committee on Communication Transport and The Arts, 1999). It has also been demonstrated in post-crash interviews that (i) the sleepiness level before the crash, (ii) less then five hours of prior sleep and (iii) night driving, are major predictors of road crashes (Connor, et al., 2002).
The detailed character of sleepiness in driving has mainly been studied in driving simulators and with the amount of prior sleep as the main manipulation. The results of prior sleep loss include an increased standard deviation of the lateral position (O'Hanlon & Kelly, 1974; S Otmani, T Pebayle, J Roge, & A Muzet, 2005), increased subjective sleepiness (Anund, Kecklund, Peters, Forsman, & Åkerstedt, 2008; Ingre, Åkerstedt, Peters, Anund, & Kecklund, 2006; Åkerstedt, Peters, Anund, & Kecklund, 2005), increased electroencephalographic (EEG) alpha band (8–12Hz) and theta band (4–8Hz) activity (Gillberg, Kecklund, & Åkerstedt, 1996) and increased duration of eye blinks (Dinges, Maislin, Brewster, Krueger, & Carroll, 2005). The effect of simulated driving as compared to real-world driving on driver state is not fully known, but it has been indicated that sleep deprivation and time on task effects are more pronounced in simulated driving (Philip, et al., 2005).
Long before a fatigued driver falls asleep, he or she suffers from degraded decision-making capabilities, decreased coordination, reduced reaction time, perseveration and decreased memory and mental functioning (Burns, 2007). For commercial operators such as truck drivers, it is possible to reduce the amount of sleepy drivers with
regulations, education and fatigue management strategies (Åkerstedt, 2000). In addition to these preventive measures, there is also a need to automatically detect if the driver turns sleepy behind the wheel despite these regulations. Such driver support systems are typically based on impaired lateral control (Brookhuis & de Waard, 1993; Dinges & Mallis, 1998) or on the physiological state of the individual sleepiness (JA Horne & Reyner, 1999; Wierwille & Ellsworth, 1994; Åkerstedt & Folkard, 1997). In this report, a novel system for online monitoring of driver sleepiness will be investigated, namely the Optalert fatigue management system (http://www.optalert.com/).
1.1
Aim
The objective of this study is to evaluate if the Optalert system is able to detect driver sleepiness or not. The evaluation is conducted by comparing the Optalert system with three commonly used sleepiness indicators: the Karolinska Sleepiness scale (KSS), the blink duration and the standard deviation of lateral position (SDLP), see section 3.6 for further information about these indicators. More specifically, the aims are to investigate:
a) if Optalert can detect driver sleepiness equally well as the other mentioned indicators.
b) if the data patterns obtained by Optalert correlates with the other measurements of sleepiness.
2
The Optalert system
Optalert (Sleep Diagnostics Pty Ltd, Melbourne, Australia) is a device that continuously measures alertness/sleepiness. The system monitors eyelid movements by infrared reflectance oculography and estimates the level of sleepiness based on a combination of different eye blink characteristics (Johns, Tucker, Chapman, Crowley, & Michael, 2007). Intuitively, as drivers become sleepier, their eyes remain closed for a longer period of time and the eye closure turns slower (Johns, 2003).
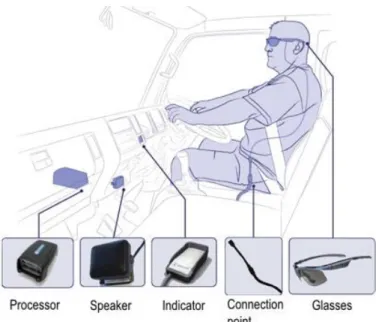
The Optalert system consists of several parts, see Figure 1. The processor is used to analyse the data from the infrared sensor and to manage warnings when the driver show signs of sleepiness. The connection point is where the driver plugs in the glasses and it also features a quick release system in case of an emergency. The indicator reports the status of the system and the speaker provides audible warnings to the driver.
Figure 1 The Optalert system. The image is reprinted with kind permission from Optalert Pty Ltd (http://www.optalert.com).
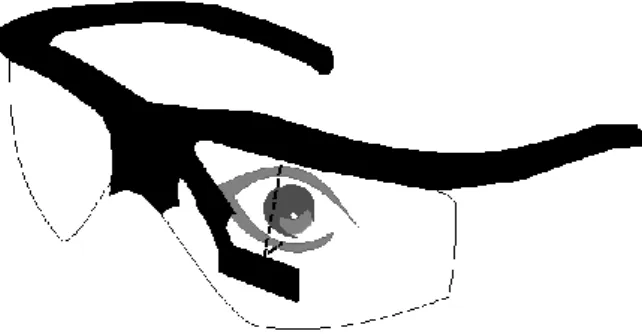
Reflectance oculography is based on the fact that the ratio between the amount of light reflected from a surface and the amount originally striking the surface is dependent on the surface itself. This means that the amount of reflected light will be different if the eye is open as compared to if it is closed. More specifically, the amplitude of each reflected pulse depends on the colour, shape and texture of the surface. In the Optalert system, the light is emitted in a 30° cone centred on the lower edge of the upper eye lid, so the light will hit a rather large surface area, see Figure 2. This means that the
reflected light will depend on the prevailing composition of this area. For example, during a blink there will be a substantially larger proportion of eye lid as compared to cornea, iris, sclera and conjunctiva. Since these proportions are changed continuously during eye movements and eye blinks, the amount of reflected light will be related to the eye blinks.
Figure 2 The spectacle frames with IR transducers in the arm attached to the frame. Also indicated is the direction of the IR light pulses directed up at the eye.
The measurement system is housed in the frame of a pair of glasses, where a light emitting diode (LED) and a phototransistor is positioned below and in front of the eye. To obtain a continuous measure of the eye, the LED sends out short pulses of infrared light (duration = 70 µs, wavelength = 935 nm) at a rate of 500 Hz (Johns, et al., 2007). In between each pulse, the phototransistor measures the amount of reflected light. To reduce the effect of different lighting conditions in the surrounding environment, the level of environmental IR light detected immediately before each pulse is subtracted from the combined level during the pulse.
A microprocessor, also housed in the arm of the glasses, controls the timing and other characteristics of the pulses, and digitizes the analogue output from the sensors. The power supply and the output from the glasses are connected to an external processing unit via a cable. The processing unit calculates a value on the so called Johns
Drowsiness Scale (JDS) which is provided every minute as a rating of sleepiness. The Optalert output was aggregated in five minute segments by averaging to match the time resolution of the KSS values, see section 3.6.1.
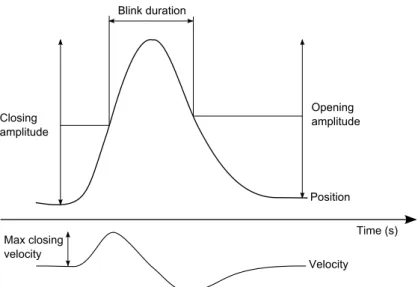
JDS is a composite indicator of sleepiness which is based on many different variables that characterizes eye blink behaviour. A few examples include the amplitude velocity ratio for closing and reopening the eyelids and the durations of closing and reopening the eye lids. The weighting for each variable in the JDS has been determined
empirically with multiple regression analysis, but further details of the underlying algorithm are proprietary information (Johns, Chapman, Crowley, & Tucker, 2008; Johns, et al., 2007). However, an important parameter in the algorithm is the ratio between the closing amplitude and the maximum closing velocity, see Figure 7. The threshold level of JDS which separates a sleepy driver from an alert driver is somewhat vague. It has been reported that a driver is too sleepy when JDS > 5 (Johns, Tucker, & Chapman, 2005), but it has also been stated that performance failure starts at JDS > 3 (Johns, et al., 2008).
3
Methodology
3.1
Participants
Twelve professional truck drivers were recruited by Scania personnel (Scania test drivers) or VTI personnel (taken from pool of voluntary truck drivers). Ten participants were males and two were females. The drivers’ mean age was 36 years and they had been truck drivers for approximately 13 years (range 3–24 years). The study was
performed at the Swedish National Road and Transportation Research Institute (VTI) in Linköping, Sweden. The participants were paid approximately 300 Euros (plus
travelling expenses) for their participation.
The participants were instructed not to drink alcohol for 72 hours before the test day, not to drink coffee/tee or eat four hours before arrival to the laboratory, and to sleep as normal as possible with 7–8 hours of night sleep during the three days before the test. Three questionnaires were filled in during the study. The first regarding driving experience and professional skill as well as eating, working and sleeping status, the second regarding acceptance of different warning systems and the third regarding their experience of the truck simulator and the complete experiment.
3.2
Background questionnaire and manipulation checks
All participants received information concerning preparation (PI: Preparation
Instructions) before visiting VTI. The instructions contained information about eating, drinking and sleeping regulations that needed to be fulfilled before visiting VTI. The PI also included an instruction about KSS and the levels used in the scale. When the participants arrived at VTI for the first session all participants filled in a background questionnaire (BQ). The BQ contained questions about the gender, age, experience, as well as questions concerning sleeping and drug (alcohol and tobacco). A
pre-questionnaire (PQ) was filled in by all participants before each of the two sessions. The PQ was a check on how well the participants had followed their eating, drinking and sleeping instructions before visiting VTI. Finally, after each of the two sessions all participants responded to questions concerning their experiences of different HMI solutions.
3.3
Driving task
The instruction to the participants was to “Drive as usual”. They were informed that the session would take approximately 1 h and 30 minutes. The participants started with a training session to get familiar with the simulator, the context and the truck model used in the simulator. The task was purposely chosen avoiding all kind of stimulating or goal directed behaviour.
3.4
Design and procedure
The participants came to VTI twice. The main reason for the second visit was that the complete study also included an investigation of two different human machine
interaction (HMI) solutions, in this case two different warnings. During the first visit
one of the two HMI solutions was evaluated and during the second visit the other HMI solution was evaluated. The order was balanced. Benchmarking results from the two different HMI solutions are however classified and will not be dealt with further. In this
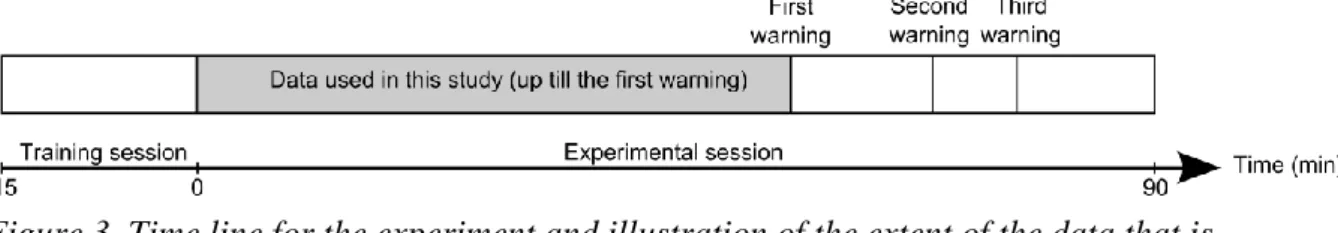
report, we only use data up to the first warning, see Figure 3. This was partly to avoid confounding effects from the warning modality and partly because the driver is likely to behave differently after the warning/event.
The participants arrived to VTI and were taken to the laboratory for instructions and preparation for the experiment. They all signed an informed consent form. Control of fulfilment of the preparation instructions was done before entering the simulator. The participants were given the task to drive to a specific place just as if they were carrying out an everyday work-related assignment. They were also told that they could stop driving at any time without having to give an explanation for their decision. None of the participants did however choose to abort.
The tests were conducted between 11pm and 7am, when the drivers had been awake for at least 18 hours and when their alertness level was at a minimum due to circadian influences. The experiment started with a practising session which lasted for about 15 minutes. After the training session, the actual test commenced. While driving in the simulator, the drivers reported their KSS rating every fifth minute, corresponding to their subjective rating of how sleepy they had been during the last five minutes. A warning was triggered manually by the test leader if:
1. the Optalert system gave an indication above four on JDS and the driver reported a KSS rating of seven or above.
2. the driver reported a KSS rating of eight or above.
These thresholds were determined based on current literature (Johns, et al., 2008; Johns, et al., 2005; Stephan, et al., 2006; Åkerstedt & Gillberg, 1990) as well as experience from a preceding pilot study. During the pilot study, it was noticed that reported JDS thresholds (Johns, et al., 2008; Johns, et al., 2005) gave many warnings when the driver felt alert why KSS was incorporated as a complementary triggering criteria. More information about KSS can be found in section 3.6. The drivers continued to drive after the warning, but as already mentioned, data originating from after the first warning were not used in this study. If a driver had not reached the sleepiness levels required to
trigger a warning, a warning was triggered anyhow after the 90 minutes had passed. Data from these drivers are not included in this study. After the experiment the participant answered the third questionnaire and was driven home by taxi.
Figure 3 Time line for the experiment and illustration of the extent of the data that is used in this study.
The experiment was run as a 2 by 3 factorial design. The first factor was SESSION, corresponding to the two driving sessions that the participant drove the scenario (once for each HMI solution). The second factor was PERIOD where three periods were compared: the initial baseline (REF, based on data from minutes 0.00–4.59), a period
9.59–5.00) and a period just before the onset of a warning (BEFORE-5, based on data from minutes 4.59–0.00).
Figure 4 Time line of the experiment. The three time periods REF, BEFORE-10 and BEFORE-5 are used in the statistical analysis.
3.5
Driving simulator and scenario
An advanced moving base truck driving simulator with manual gear box was used (Simulator II, http://www.vti.se/templates/Page____3257.aspx), see Figure 5. The simulator has been validated together with the truck manufacturer that has supplied the input data. Simulation results have been compared to field test results of most standard vehicle dynamics manoeuvres (steady state driving in a circle, step input on the steering wheel and frequency response) with good correspondence. This work has been
documented in a number of reports (Aurell, Nordmark, & Fröjd, 2000; Jerand, 1997). The time delay introduced in the simulator is very short (40 ms), which is important when focusing on the control and manoeuvring aspects of driving. The noise, infra-sound and vibration levels inside the cabin corresponded to those of a modern heavy truck. The truck cabin used in this experiment was a Scania truck.
Figure 5 VTI truck driving simulator.
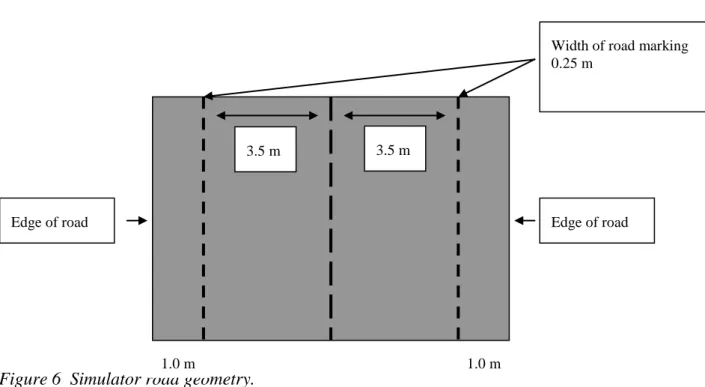
The scenario used in this study consisted of a nine meter wide rural road with moderate curvature, dry asphalt and a speed limit of 90 km/h (corresponding to road 34 from Hultsfred to Målilla in Sweden). The road geometry was defined according to Figure 6. There was no other traffic present, and the simulated condition was twilight fog. The driver was not allowed to use cruise control and there were no secondary tasks.
Figure 6 Simulator road geometry.
3.6
Sleepiness indicators
Three different indicators of sleepiness were compared with the Optalert measurement; the KSS, the blink duration and SDLP. All of these four sleepiness indicators are described in this section.
3.6.1 The Karolinska Sleepiness Scale
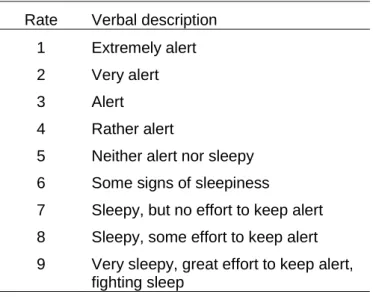
The Karolinska Sleepiness scale (KSS) is a subjective rating where the drivers
themselves assess their own sleepiness (Åkerstedt & Gillberg, 1990). The scale ranges from 1 to 9, where each rating correspond to a verbal description of sleepiness, see Table 1. In this study, subjective sleepiness was rated every fifth minute prompted by an instruction displayed on the projected simulator image. The participant was instructed to report how they had been feeling in average over the past five minutes. A limitation with KSS is that the process of asking for ratings may alert the driver (Kaida, T, Kecklund, Nilsson, & Axelsson, 2007).
1.0 m m 1.0 m
m
Width of road marking 0.25 m
3.5 m
Edge of road 3.5 m
Table 1 KSS with verbal descriptions of each rating.
Rate Verbal description 1 Extremely alert 2 Very alert 3 Alert 4 Rather alert
5 Neither alert nor sleepy 6 Some signs of sleepiness
7 Sleepy, but no effort to keep alert 8 Sleepy, some effort to keep alert 9 Very sleepy, great effort to keep alert,
fighting sleep
3.6.2 Blink duration
A Vitaport II (Temec Instrumetns BV, Kerkrade, Netherlands) system was used to record the EOG using electrodes of the disposable Ag/AgCl type, where DC-recorded horizontal and right vertical leads were sampled at 512 Hz. The blink duration indicator is extracted from the raw vertical EOG signal by finding half the closing and opening amplitudes of each blink and calculating the time difference between the two, Figure 7. The reason for using half the amplitude is to get a more robust measure which is less susceptible to noise. Another advantage is that by using half the amplitude, the influence of consecutive and overlapping blinks are not as severe. The blink duration was determined for each blink and later aggregated in five minute segments by averaging to match the time resolution of the KSS values. It should be noted that the Optalert recording basically contains the same information as the EOG, especially when the EOG is recorded in AC-mode (Johns, et al., 2005).
Figure 7 The principle of some measurements calculated from the blink complex. The position signal (top) can represent either an electrooculogram (EOG) or a reflectance oculogram (Optalert) so the units are arbitrary in the figure. The velocity signal (bottom) is the derivative of the position signal. See the text for details.
3.6.3 Variability in lateral position
The standard deviation of lateral position (SDLP) was obtained from the simulator, where lateral position is defined as the perpendicular distance from the centre of the road to the centre of the car (lateral position is recorded with an accuracy of 0.01 m at a sample frequency of 100 Hz). The variability of lateral position is intended to reflect the driver’s ability to maintain a straight path (Liu, Hosking, & Lenne, 2009). The SDLP values were calculated in five minute segments corresponding to the time resolution of the KSS ratings.
SDLP is only a valid sleepiness indicator during free driving, i.e. when there is no overtaking, no car following, no intersections and when the curvature of the road is moderate. Such factors affect the “correct” driving pattern, but this is not accounted or compensated for by the SDLP algorithm.
3.7
Statistical analysis
All pre-processing, as already described in section 3.6, was performed in MATLAB 7.2 (The Mathworks Inc, Natick, MA, USA). The blink duration was determined using a MATLAB toolbox developed by the Centre for Applied and Environmental Physiology in Strasbourg (Jammes, Sharabty, & Esteve, 2008). Note that all indicators were
aggregated in five minute periods in order to be able to compare all against all in a sufficient matter.
The statistical analyses comprised 2 and 3 factor ANOVAs with repeated measures. The results were corrected for sphericity using the Huyhn-Feldt method. A partial
correlation analysis was also performed, keeping SESSION and time on task under control (partial correlation is a method used to describe the relationship between two variables whilst taking away the effects of another variable, or several other variables, on this relationship). All tests used a significance level of α=0.05. Subsequent statistical analyses were carried out with SPSS 17.0.
4
Results
The result section will firstly present the analyses on background issues. The twelve participant’s descriptive data show that their mean age (mean = 35.5, SD=11.75),
experience of driving (mean = 13.25, SD=6.69) and sleeping experience and quality was perceived as rather good (4 on a 5 graded scale, 9 participants) to mostly sufficient (3 on a 5 graded scale, 3 participants). None of the participants smoked (1 smoked
occasionally) but 5 of them used snuff. All of them drank alcohol 2-4 times a month, and only one used medicine at the time of the experiment. Four of the participants had been involved in an incident but none of them had been involved in an accident. Finally, all of them reported that they had followed the preparations concerning sleep, work, food, coffee/tea and medicine in the instructions send to them beforehand. The conclusion is that the selected study group represented the truck driver category as requested. They had also followed the instructions given beforehand. The group can therefore be used as participants in the forthcoming analysis on sleepiness.
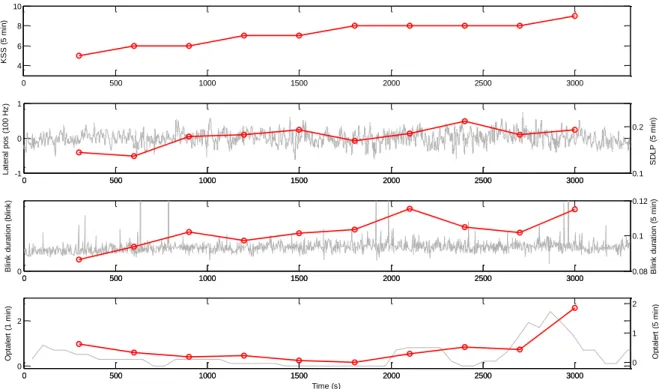
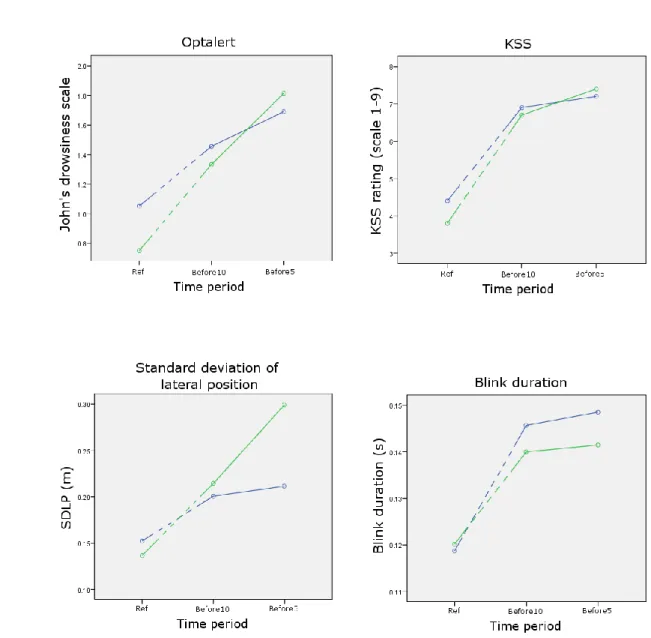
The reporting of KSS every fifth minute was used as common time stamps for all signal sources. An example of how KSS evolves over time for one participant can be found in Figure 8. Also included in Figure 8 are examples of raw data from lateral position (10 Hz), blink duration (one sample per blink occurrence) and Optalert (one sample per minute). The red lines illustrate time traces of aggregated values over the last five minutes for SDLP, blink duration and Optalert. From these time traces, three occasions were chosen for the statistical analysis. These correspond to the first five minutes of driving (REF), the time period from ten to five minutes before the warning (BEFORE-10) and the time period from the five minutes leading up to the warning (BEFORE-5). Two values for each period were computed since each participant ran the experiment twice, i.e. the factor SESSION. The estimated marginal means for the three time periods are illustrated in Figure 9. It can be seen that all four indicators are increasing with time on task, where the participants are intended to get more sleepy over time. Four of the eighteen warnings were triggered based on JDS while the remaining fourteen warnings were triggered by KSS.
Results from four separate ANOVAs with PERIOD and SESSION (3x2) as within-participant variables and Optalert, KSS, SDLP and blink duration as dependent measures are summarized in Table 2. Significant effects of PERIOD were found for Optalert, KSS and blink duration. No significant effects were found for SESSION in any of the dependent measures or for the interaction between SESSION and PERIOD. This means that the Optalert system as well as KSS and blink duration are able to distinguish the three time periods from each other.
Since three of the participants (2, 3 and 7) did not get a warning an identical analysis was computed when these participants were excluded. This exclusion did not affect the results and the obtained data patterns were exactly the same.
0 500 1000 1500 2000 2500 3000 4 6 8 10 K S S ( 5 m in ) 0 500 1000 1500 2000 2500 3000 0 2 O p ta le rt ( 1 m in ) 0 500 1000 1500 2000 2500 3000 -1 0 1 L a te ra l p o s ( 1 0 0 H z ) 0 500 1000 1500 2000 2500 3000 0.1 0.2 S D L P ( 5 m in ) 0 500 1000 1500 2000 2500 3000 0 B lin k d u ra ti o n ( b lin k ) 0 500 1000 1500 2000 2500 3000 0.08 0.1 0.12 B lin k d u ra ti o n ( 5 m in ) 0 500 1000 1500 2000 2500 3000 0 1 2 O p ta le rt ( 5 m in ) Time (s)
Figure 8 Example of the different raw signals (grey, left y-axis) from participant 1. Also included are the aggregated results of the performance indicators and their respective time traces (red, right y-axis).
Figure 9 Estimated marginal means of the indicators Optalert, KSS, SDLP and blink duration for the three time periods under consideration. The two lines in each subplot represent the two conditions in SESSION (Green = HMI solution 1, Blue = HMI solution 2). The lines are dotted between Ref and Before10 to clarify the fact that these are not consecutive time instants.
Table 2 Results from repeated measures ANOVAs (F-value and p-value).
Optalert KSS SDLP Blink duration
PERIOD (df 2,18) 5.25 (0.03) 52.12 (<0.01) 3.57 (0.09) 14.83 (<0.01)
SESSION (df 1,9) 0.10 (0.76) 0.40 (0.54) 0.44 (0.52) 2.21 (0.17)
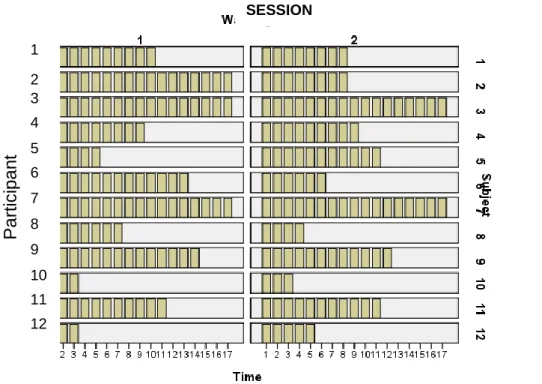
There were significant effects of the factor PERIOD (REF, 10 and BEFORE-5) for Optalert and two of the other sleepiness indicators (KSS and blink duration) in this study. However, this does not say anything about how the different indicators are related to each other. For this reason, a partial correlation analysis was conducted to see if they behaved similarly over time. For the correlation analysis, all available time periods from the beginning of the test and up to the last but one of the time periods before the warning were used. Since the warning was given at different time instants for different drivers, the number of five-minute time periods used in the analysis was not the same, see Figure 10. Table 3 reveals that Optalert correlates significantly with blink duration (BD50). Scatter plots illustrating the relation between Optalert and the three other sleepiness indicators are shown in Figure 11. The indicators have been adjusted for Session and Time period, so the scatter plots are directly comparable to the partial correlation analysis. However a number of partial correlation analyses have been computed. The illustrated table use only the participants that have received a sleepiness warning (excluding participant 2, 3, and 7). The data pattern obtained from all partial correlation analyses reveals the same results. The correlation between blink duration and Optalert is the only one that reaches an interesting level, which is not surprising since the Optalert and the blink duration measure both uses eye behaviour as a base for respectively measures.
Figure 10 Number of five-minute time frames included in the correlation analysis. The number of time frames is governed by the time instant of the first warning.
PERIOD 1 12 11 10 9 8 7 6 5 4 3 2 P a rtici p a n t SESSION
-2 0 2 4 -0.1 -0.05 0 0.05 0.1 0.15 0.2 0.25 0.3 0.35 A d ju st e d S D L P Adjusted Optalert Optalert vs SDLP -2 0 2 4 -0.2 -0.1 0 0.1 0.2 0.3 0.4 0.5 A d ju st e d b li n k d u ra ti o n Adjusted Optalert Optalert vs blink duration
-2 0 2 4 -3 -2 -1 0 1 2 3 A d ju st e d K S S Adjusted Optalert Optalert vs KSS
Figure 11 Scatter plots of Optalert versus SDLP, Optalert versus blink duration and Optalert versus KSS, respectively. The red lines indicate the best linear fit in a least-squares sense. All variables have been adjusted for SESSION and time frame.
Table 3 Results from the partial correlation analysis – controlling for Time frame and Session.
Correlations
Control Variables SDLP BD50 Optalert KSS
Time & Session SDLP Correlation 1.00 0.23 0.14 -0.12
Significance (2-tailed) 0.01 0.12 0.19 df 0 122 122 122 BD50 Correlation 0.23 1.00 0.40 0.05 Significance (2-tailed) 0.01 <0.01 0.57 df 122 0 122 122 Optalert Correlation 0.14 0.40 1.00> 0.04 Significance (2-tailed) 0.12 <0.01 0.69 df 122 122 0 122 KSS Correlation -0.12 0.05 0.04 1.00 Significance (2-tailed) 0.19 0.57 0.69 df 122 122 122 0
5
Discussion
Sleepiness while driving is a big concern for traffic safety, and a non-obtrusive system able to track the state of the driver in real-time is considered to be valuable. The results in this study show that the Optalert fatigue management system can be useful to detect driver sleepiness. The results also show that the output from the Optalert system correlates significantly (α=0.05) with all the other three sleepiness indicators (KSS, Blink duration and variability of lateral position). However, there are also some concerns related to the Optalert system.
5.1
The Optalert fatigue management system
An advantage with the Optalert system as compared to other physiological
measurements is that no electrodes are necessary (however, the driver still needs to be attached to the vehicle via the spectacle frames and a wire). Another advantage is that real-time algorithms are available with an output in terms of online sleepiness level. This means that the system can be used in a naturalistic setting. Compared to the other three sleepiness indicators used in this study, these advantages are important. KSS requires input from the driver and the blink duration requires electrodes, so neither of these methods is useful in everyday driving. SDLP is both non-obtrusive and easy to implement, but it is questionable if vehicle measurements only, in itself, is reliable to predict driver sleepiness (Liu, et al., 2009), also see Table 2. It should be noted that the blink duration can also be measured with remote eye tracking systems such as SmartEye AntiSleep (SmartEye AB, Gothenburg, Sweden: http://smarteye.se/) and Seeing
Machines DSS (Seeing Machines, Canberra, Australia: http://www.seeingmachines.com/).
Disadvantages with the system include that there is no defined threshold which classifies when a driver is too sleepy to drive (this is also the case for SDLP and blink duration). Johns et al. suggests that performance failures start at JDS > 3 (2008) and Stephan et al. (2006) state that JDS > 4.5 represent a cautionary level of drowsiness, but in this study the mean JDS score just before the warning was triggered was JDS < 2, see Figure 9. This means that several drivers who subjectively rated their own sleepiness to KSS ≥ 7 (the level that the warning was trigged) simultaneously have JDS < 2. In fact, only four of the twelve participants received warnings that were triggered based on JDS, and one of the participants actually fell asleep and drove into the ditch with JDS = 3. Another worrying example is that the eye movement measurements were nearly perfect when setting up the Optalert system in the lab, but the quality of the blink signal
decreased considerably while driving in the simulator. For some participants, the low quality measurements lead to questionable JDS ratings which were inconsistent with the KSS ratings. Observed factors that affect the reliability of the Optalert system include long eye lashes and deviant eye blink behaviour.
5.2
Methodology
A big concern when evaluating the performance of sleepiness rating systems is that there are no reference methods available to measure involuntary sleep. In the sleep clinic, the established gold standard is polysomnography (Rechtschaffen & Kales, 1968). This method was however developed to investigate people with sleeping
reversed, meaning that the driver is fighting to stay awake. These two situations are quite different, and there is a risk that the physiological events that are present before the onset of normal sleep cannot be used to monitor the onset of involuntary sleep (Galley, Schleicher, & Galley, 2004; J. Horne & Reyner, 1996). The bottom line is that methods such as polysomnography should be used with caution when trying to rate involuntary sleep. In this study, we instead chose three different sleepiness indicators that have previously been used to rate involuntary sleep (Liu, et al., 2009). These three indicators reflect different aspects of sleepiness – cognitive (KSS), behavioural (SDLP) and physiological (blink duration) – and the idea is that they together will reflect the sleepiness state of the driver for the purposes of this study.
In this study, we chose to aggregate data into five-minute chunks. This may seem to be a long time, but since we are not trying to construct a warning system, chunks of long durations is not evidently a bad thing. Many different time intervals have been used in the literature, ranging from 15 seconds up to 10 minutes or more (eg. Bergasa, Nuevo, Sotelo, Barea, & Lopez, 2006; Ingre, et al., 2006; S. Otmani, T. Pebayle, J. Roge, & A. Muzet, 2005). The most commonly used time span is however five minutes. It has been indicated that the performance of sleepiness indicators increase with the length of the time window up to a certain length, and Wierville et al. (1996) showed that the
performance increased significantly between window sizes one, two and three minutes while a six minute window basically contained the same information as a three minute window. Considering that the fight to stay awake is a rather slow process, especially since we don’t have any sudden events in this study (remember that only data leading up to the first warning is used), five minutes is a reasonable time window – especially since it is also a practical choice due to the sample rate of KSS.
It may be argued that the data aggregation should be based on maximum values instead of mean values. However, KSS is defined as the mean sleepiness level during the past time period, and it would be unwise to manipulate a validated sleepiness indicator in a study like this. Since KSS is based on mean values, it would also be strange to introduce a different statistic for the other indicators. Also, the inherent noise reduction property of the mean value is favourable compared to extreme value alternatives. This is especially important for the blink duration where great variability is present from one blink to another.
Setting a criterion for distinguishing a sleepy driver from a non-sleepy driver is a current research topic without an adequate solution (Liu, et al., 2009). In this study, the intention was to trigger a sleepiness warning when JDS ≥ 5 based on Stephan et al. (2006). After the two pilot runs, it was evident that this level was too high why we lowered it to JDS ≥ 4. At the same time, JDS sometimes deviated from KSS, so we introduced the combination criterion that was finally used in the study (JDS ≥ 4 AND KSS ≥ 7) along with the criterion (KSS ≥8). It is difficult to define a setting that has high sensitivity and specificity for all individuals (Liu, et al., 2009), especially since the individual differences are so pronounced (Ingre, et al., 2006; S. Otmani, et al., 2005; Philip, et al., 2005). It is a bothersome drawback for the Optalert system that there is no reliable threshold, however, this problem applies to all the other sleepiness indicators as well.
5.3
Results
Table 2 reveals that there is a significant difference between the three time periods Ref, Before-10 and Before-5 for the Optalert system as well as for KSS and blink duration. It should however be noted that the data that is used here range from the start of the driving session and up to the first warning. Since the warning is triggered when KSS or JDS increases above a certain threshold, it is not surprising that we get significantly higher ratings between the three time periods. In spite of this, we can still say that JDS shows higher scores over time in an experimental setup, which was designed in order to guarantee driver sleepiness. We can also say that these changes in JDS were
accompanied by increases in all the other three sleepiness indicators. This being said, for the participant illustrated in Figure 8, JDS is decreasing the first 1800 seconds while KSS is monotonically increasing. Apparently the Anova results regarding the tree time periods Ref, Before-10 and Before-5 should not be generalized to other time periods. JDS correlate significantly with blink duration and SDLP (Table 3). However, these correlations are very weak, and considering the scatter plots in Figure 11, it is questionable whether a correlation analysis should be performed on these data at all. Perhaps the poor correlations can be explained by the elusive nature of sleepiness.. Operationally, sleepiness has been defined as “a physiological drive to fall asleep” (Dement & Carskadon, 1982), and as such, sleepiness describes the entire process from alert to sleep. For involuntary sleep the process can be described as a fight. For some minutes the driver will manage to be alert and then the alertness level drops for a short time and then goes back to an alert level. Depending on the particular time period that the data, underlying the indicator, are selected from, the sensitivity for this fight will be more or less critical. Since the different sleepiness indicators are sensitive to different aspects of sleep, they might therefore be slightly “out of sync” and thus the
correspondence between the indicators will be poor.
There was a glitch in the experimental setup which made time synchronization between different signal sources cumbersome. Simulator data, physiological data and KSS ratings were properly synchronized, while data from the Optalert system were not. This resulted in a synchronization-uncertainty of ±30 seconds which varied between
participants. Practically, this means that we have an uncertainty of ±30 seconds when matching a certain time instant in the simulator data set with the corresponding time instant in the Optalert data set. This is unfortunate, however, the impact on the results is not critical since we use aggregated sleepiness indicators based on segments that are five minutes long.
Another aspect that needs to be dealt with is that only four of the participants received warnings triggered by the JDS threshold. It is unclear if and how these circumstances affected the possibility for interpretations since the time periods used in this study were taken before a warning was given. However, degree of sleepiness might on the other hand vary depending on the threshold used.
6
Conclusion
There are some practical issues with the Optalert system which reduces its usefulness; there is no reliable threshold which can be used to determine when a driver is getting too sleepy to drive, the driver needs to be attached to the vehicle via the spectacle frames and a wire, and the quality of the eye movement recordings deteriorate outside a lab environment. Also, even though the JDS ratings correlated significantly with other sleepiness indicators, the correlation coefficients were low. On the other hand, the system did show significant differences in driver sleepiness state during the three time periods (REF, BEFORE-10 and BEFORE-5) under consideration in the study.
All in all, the Optalert system seems to be a promising system, but based on the
presented results we also find some details that need to be considered and even adjusted in order to have a system (detecting sleepiness) that can be used as an instrument in different research settings.
References
Anund, A., Kecklund, G., Peters, B., Forsman, Å., & Åkerstedt, T. (2008). Driver impairment during night and the relation with physiological sleepiness. Scandinavian
Journal of Work Environment and Health, 34, 142–150.
Aurell, J., Nordmark, S., & Fröjd, N. (2000). Correlation between objective handling
characteristics and subjective perception of handling qualities of heavy vehicles. Paper
presented at the 5th Int Symposium on Advanced Vehicle Control, Ann Arbor, Michigan, USA.
Bergasa, L. M., Nuevo, J., Sotelo, M. A., Barea, R., & Lopez, M. E. (2006). Real-time system for monitoring driver vigilance. Ieee Transactions on Intelligent Transportation
Systems, 7(1), 63–77.
Brookhuis, K., & de Waard, D. (1993). The use of psychophysiology to assess driver status. Ergonomics, 36, 1099–1110.
Burns, J. A. (2007). Truck driver fatigue - A primer. In L. R. Genson & A. M. Kerezman (Eds.), Truck Accident Litigation: American Bar Association.
Connor, J., Norton, R., Ameratunga, S., Robinson, E., Civil, I., Dunn, R., et al. (2002). Driver sleepiness and risk of serious injury to car occupants: population based case control study. Br. Med. J., 324 1125.
Dement, W. C., & Carskadon, M. A. (1982). Current perspectives on daytime sleepiness: the issues. Sleep, 5, 56–66.
Dinges, D., Maislin, G., Brewster, R., Krueger, G., & Carroll, R. (2005). Pilot test of
fatigue management technologies (No. Issue 1922): US Transportation Research
Record.
Dinges, D., & Mallis, M. (1998). Managing fatigue by drowsiness detection: Can technological promises be realized. In L. Hartley (Ed.), Managing Fatigue in
Transportation (pp. 209–229). Oxford: Pergamon Press.
Galley, N., Schleicher, R., & Galley, L. (2004). Blink parameters as indicators of driver sleepiness - possibilities and limitations. In A. G. Gale (Ed.), Vision in vehicles.
Amsterdam: Elsevier Press.
Gillberg, M., Kecklund, G., & Åkerstedt, T. (1996). Sleepiness and performance of professional drivers in a truck simulator - comparisons between day and night driving.
J Sleep Res, 5, 12–15.
Horne, J., & Reyner, L. (1999). Vehicle accidents related to sleep: a review. Occup
Environ Med, 56(5), 289–294.
Horne, J., & Reyner, L. A. (1996). Counteracting driver sleepiness: effects of napping, caffeine, and placebo. Psychophysiology, 33(3), 306–309.
House of Representatives Standing Committee on Communication Transport and The Arts (1999). Beyond the Midnight Oil: An inquiry into managing fatigue in transport. Commonwealth of Australia, Canberra.
Ingre, M., Åkerstedt, T., Peters, B., Anund, A., & Kecklund, G. (2006). Subjective sleepiness, simulated driving performance and blink duration: examining individual differences. Journal of Sleep Research, 15, 1–7.
Jammes, B., Sharabty, H., & Esteve, D. (2008). Automated EOG analysis: A first step toward automatic drowsiness scoring during wake-sleep transitions. Somnologie, 12(3), 227–232.
Jerand, A. (1997). Improvement, validation and multivariate analysis of a real time
vehicle model: (No 9753) Dept of Civil Engineering, Stockholm.
Johns, M. W. (2003). The amplitude velocity ratio of blinks: A new method for
monitoring drowsiness. Paper presented at the 17th Annual Conference, Associated
Professional Sleep Societies (APSS).
Johns, M. W., Chapman, R., Crowley, K., & Tucker, A. (2008). A new method for assessing the risks of drowsiness while driving. Somnologie, 12, 66–74.
Johns, M. W., Tucker, A., & Chapman, R. (2005). A new method for monitoring the
drowsiness of drivers Paper presented at the International Conference on Fatigue
Management in Transportation Operations.
Johns, M. W., Tucker, A., Chapman, R., Crowley, K., & Michael, N. J. (2007).
Monitoring eye and eyelid movements by infrared reflectance oculography to measure drowsiness in drivers. Somnologie, 11, 234–242.
Kaida, K., T, A. K., Kecklund, G., Nilsson, J. P., & Axelsson, J. (2007). The effects of asking for verbal ratings of sleepiness on sleepiness and its masking effects on
performance. Clin Neurophysiol, 118(6), 1324–1331.
Liu, C. C., Hosking, S. G., & Lenne, M. G. (2009). Predicting driver drowsiness using vehicle measures: recent insights and future challenges. J Safety Res, 40(4), 239–245. NTSB (1999). Evaluation of U.S. Department of Transportation: efforts in the 1990s to
address operation fatigue (No. Safety Report NTSB/SR-99/01). Washington, D. C.:
National Transportation Safety Board.
O'Hanlon, J., & Kelly, G. (1974). A psycho-physiological evaluation of devices for preventing lane drift and run-off-road accidents. Technical Report 1736-F, Human
Factors Research Inc, Santa Barbara Research Park, Goleta, California.
Otmani, S., Pebayle, T., Roge, J., & Muzet, A. (2005). Effect of driving duration and partial sleep deprivation on subsequent alertness and performance of car drivers. Physiol
Behav 84, 715–724.
Otmani, S., Pebayle, T., Roge, J., & Muzet, A. (2005). Effect of driving duration and partial sleep deprivation on subsequent alertness and performance of car drivers. Physiol
Behav, 84(5), 715–724.
Philip, P., Sagaspe, P., Taillard, J., Valtat, C., Moore, N., Akerstedt, T., et al. (2005). Fatigue, sleepiness, and performance in simulated versus real driving conditions. Sleep,
28(12), 1511–1516.
Rechtschaffen, A., & Kales, A. (1968). A manual of standardized terminology,
techniques and scoring system for sleep stages of human subjects: Bethesda: US
Department of Health, Education and Welfare, Public Health Service.
Stephan, K., Hoskins, S., Regan, M., Verdoorn, A., Young, K., & Haworth, N. (2006).
The relationship between driving performance and the Johns drowsiness scale as measured by the Optalert system: Monash University Accident Research Center,
Wierwille, W., & Ellsworth, L. (1994). Evaluation of driver drowsiness by trained raters. Accident Analysis & Prevention, 26, 571–581.
Wierville, W., Lewin, M., & Fairbanks, R. (1996). Research on vehicle-based driver
status/performance monitoring, part III.: National Highway Traffic Safety
Administration Report, DOT HS 808 640.
Åkerstedt, T. (2000). Consensus Statement: Fatigue and accidents in transport operations. Journal of Sleep Research, 9(4), 395–395.
Åkerstedt, T., & Folkard, S. (1997). The three-process model of alertness and its extension to performance, sleep latency, and sleep length. Chronobiol Int, 14(2), 115– 123.
Åkerstedt, T., & Gillberg, M. (1990). Subjective and objective sleepiness in the active individual. Int J Neurosci, 52(1–2), 29–37.
Åkerstedt, T., Peters, B., Anund, A., & Kecklund, G. (2005). Impaired alertness and performance driving home from the night shift: a driving simulator study. Journal of
Appendix 1 Page 1 (1)
Sammanfattning
Många olyckor där lastbilar är inblandade härstammar från trötthet i trafiken. Det är därför viktigt att upptäcka och motverka trötthet bland lastbilschaufförer. Det så kallade Optalert Fatigue Management System är ett nyutvecklat system som kan upptäcka förarnedsättningar i form av trötthet. Målet med den här studien är att utvärdera om (a) Optalert kan detektera trötthet lika bra som andra tillgängliga metoder och om (b) data från Optalert korrelerar med data från andra trötthetsindikatorer. Utvärdering gjordes med hjälp av tolv sömndepriverade lastbilschaufförer som fick köra i 90 minuter i en körsimulator. Hela studien var designad så att förarna skulle somna, eller åtminstone bli väldigt trötta, under de 90 minuterna som försöket pågick.
Fyra olika trötthetsindikatorer användes för att uppskatta förarens trötthetsnivå: subjektivt skattad trötthetsnivå (KSS), variation i sidoläge (SDLP), blinkduration och Optalert. Resultaten visar att alla fyra indikatorerna ökar under de 90 minuter som försöket pågår, och en variansanalys (ANOVA) visar att denna ökning är signifikant för Optalert, KSS och SDLP. Vidare finns en svag, men signifikant, korrelation mellan Optalert och SDLP samt blinkningarnas längd.
Sammanfattningsvis kan vi säga att Optalert är ett lovande system som ger åtminstone lika bra trötthetsskattningar som de andra metoderna i testet. Det finns dock några begränsningar som begränsar den praktiska nyttan av systemet: det finns inget generellt tröskelvärde som kan användas för att tala om när en förare är trött (detta gäller också för andra tillgängliga indikatorer), föraren måste använda ett par glasögon som dessutom måste kopplas in i bilen med en kabel samt att kvalitén på mätningarna försämrades märkbart när föraren började köra lastbilen.
Appendix 2 Page 1 (1)
VIP Project: Efficiency and Acceptance Assessment of two Different HMI Solutions for Drowsiness Detection System
VTI project nr.: 40766
Task: Report on measurement system performance
Status: Public
Last modified: 07/10/2010 09:30
Document name: Detecting sleepiness by Optalert 100601.doc
ViP
Virtual Prototyping and Assessment by Simulation
ViP is a joint initiative for development and application of driving sim-
ulator methodology with a focus on the interaction between humans and
technology (driver and vehicle and/or traffic environment). ViP aims at
unifying the extended but distributed Swedish competence in the field of
transport related real-time simulation by building and using a common
simulator platform for extended co-operation, competence development
and knowledge transfer. Thereby strengthen Swedish competitiveness
and support prospective and efficient (costs, lead times) innovation and
product development by enabling to explore and assess future vehicle
and infrastructure solutions already today.
Centre of Excellence at VTI funded by Vinnova and ViP partners
VTI, Saab Automobile, Scania, Volvo Trucks, Volvo Cars, Bombardier Transportation, Swedish Transport Administration, Dynagraph, HiQ, Pixcode, SmartEye, Swedish Road Marking Association