Annual Report 2005: Activities and Findings
This has been a year of new personnel, building new collaborations within and among other institutions, while maintaining our central focus of studying the structure and function of the SGS ecosystem and addressing broader scientific initiatives. This annual report provides a summary of our A) Research Activities, B) Information Management, C) Education, Outreach and Training Activities, and D) Project Management.
A. Research Activities
During the last year, we produced 25 papers in refereed journals, five book chapters, three dissertations, and 28 abstracts from national and international meetings. Twenty-three additional papers have been accepted by refereed journals, 20 for book chapters and three as technical reports. Twenty graduate students and 19 undergraduate students worked on research related to the shortgrass steppe LTER. We continue to sample our long-term projects, as well as initiating some new short-term experiments. Following are key research progress and results in each of our three core areas: population dynamics, biogeochemical dynamics, and
land-atmosphere interactions.
1. Population Dynamics
Plantsa) Very heavy grazing/Mountain Plover nesting study: One of the new areas we have investigated in the project is to incorporate conservation concerns and objectives into some of our basic research when they show promise in extending our understanding of SGS ecosystems. The decline in nesting mountain plovers on the SGS LTER site over the past 20 years is an issue that has provided us with an impetus to extend our analyses of the responses of SGS ecosystems to livestock grazing and to test some aspects of threshold responses of shortgrass ecosystems. An attractive nest site for mountain plovers must have very short vegetation and considerable bare ground. One of the hypotheses about the decline of plovers on the SGS LTER site is that the very wet conditions during the 1990s resulted in excessive plant biomass and cover which proved to have a negative effect on plovers. Since the vast majority of the research site is grazed by livestock an alternative statement of the hypothesis is that livestock numbers did not increase as production increased allowing the buildup in biomass and cover. We began a new long term study in 2004 to test this latter hypothesis. In addition to needing specific biomass and cover conditions for nesting, plovers require that these conditions be evident early in April as they begin returning from their winter habitat in southern California and Texas. Our new study consists of two replications of two grazing treatments and controls. A spring grazing treatment employs very heavy livestock grazing in conjunction with supplemental feed. The spring grazed pastures are not grazed the previous growing season. Livestock are introduced in early March and supplemental feeding stations are used to focus their activity on a portion of the pasture. The objective is to produce the low biomass high bare ground conditions that plovers favor on a small
portion of the pasture. The second grazing treatment is very heavy summer grazing. The objective of this treatment is to create favorable nesting conditions by reducing biomass and cover over the entire pasture.
From a population, community and ecosystem perspective the summer grazed treatments are a much riskier way to solve the plover grazing conditions. While a manager can be sure of the appropriate conditions for favorable plover nesting 6 months in advance of the arrival of the birds, the potential for serious negative consequences are very large. Winter and early spring are our driest and windiest times of the year and low aboveground plant biomass and cover are the conditions that may lead to substantial soil loss and associated plant death which could result in a reinforcing pattern of low biomass and cover-soil loss-plant death-even lower biomass and cover, etc. The risks in the spring treatment are livestock loss due to blizzards and failure to reduce biomass and cover in time to attract nesting birds.
Initial results from the spring grazed treatments indicates that we have been successful in
reducing biomass and increasing bare ground in our target areas without negatively affecting the entire pasture. In 2004 and 2005 we reduced biomass on our target areas to 200 kg/ha and 45 kg/ha respectively (Figure 1). The remainder of the pastures had 2 to 4 times more biomass than the target areas. One of the sources of the large difference between 2004 and 2005 was that because 2004 was the first year of the experiment we had residual biomass from a number of previous years. The large recovery of biomass on the target areas by the end of the grazing period (May 20) in 2005 was due to high precipitation in late April and early May. Responses of bare ground were similar to biomass (Figure 2). We increased bare ground to mid to high 30% on our target areas compared to 10 to 20% for the rest of the pasture.
In addition to exploring long term responses of shortgrass ecosystems, we see our role as
providers of information to land managers should they be put in a position of managing some of their land for mountain plovers. Understanding the tradeoffs between plovers and the remaining populations, the plant community and ecosystem responses will be critical information with which they can make plover management decisions.
b) Long-term grazing experiment: An experiment was initiated in 1991 where half the area of long-term ungrazed exclosures (since 1939) were opened to grazing (UG treatment), and new exclosures were built on previously moderately grazed areas (GU treatment). Previously ungrazed and still ungrazed (UU treatment) and previously grazed and still grazed (GG treatment) areas were left intact, resulting in four treatments at six replicate sites. Plant
community species composition (% cover), productivity, and plant nitrogen concentrations have been monitored. Questions concern the long-term convergence of the two currently grazed and the two currently ungrazed treatments, the effects of soil texture on responses to grazing, and how and if animal selection drives convergence. The long-term data set also shows how species and functional groups respond to weather cycles and drought, and how these responses are affected by grazing.
Grasses display longer term cycles in abundance, while forbs are much more dynamic annually. Both recovered rapidly from the 2002 drought recovery was not strongly related to grazing treatment. Grasses are generally more abundant on GG treatment, and forbs on UU treatment.
Exotics are much more abundant on UU and GU treatment than on GG or UG, and some convergence of UG to GG and GU to UU appears to have occurred 7 to 8 years after switching treatments. Litter appears to converge after 4-5 years, supporting the estimates of turnover-time obtained with 14C. Some species, like the dominant blue grama, do not clearly show
convergence in over 10 years, and slowly increase or decrease with weather cycles. Some species such as the annual weedy mustard (LEDE) are primarily controlled by specific annual weather patterns.
Figure Captions
Figure 1. Standing crop biomass response on lowlands, uplands, and target areas (upland+feed) to very heavy spring grazing.
Figure 2. Cover responses on lowlands, uplands, and target areas (upland+feed) to very heavy spring grazing.
Figure 3. Diversity, as represented by species other than the functional group dominants, was greater in long-term ungrazed than grazed treatment, and this was primarily due to microsites (quadrats) occupying sandier soil textures.
Figure 4. Responses of plant community components to long term grazing and protection. Grass – grasses other than the dominant, forbs – herbaceous dicots, Exotics – non native species, Litt – litter, bogr – Boutloua gracilis the dominant species, lede – Lepidium densiflorum an annual mustard.
March 8 April 15 May 21 Sta n di ng cr op bi o m ass ( k g /ha) 0 200 400 600 800 1000 lowland upland upland + feed
March 11 April 13 May 20
S tand in g c ro p b iom a s s (k g/ h a ) 0 200 400 600 800 1000
a
b
Figure 1BARE BOGR DUNG LITT B a sa l co ve r ( % ) 0 10 20 30 40 50 lowland upland upland + feed
BARE BOGR DUNG LITT
B a sa l co ve r ( % ) 0 10 20 30 40 50
a
b
Figure 220 40 60 80
PERCENT SAND
S
T
A
N
D
ING
BI
O
M
AS
S N
O
N
M
AJ
O
R
S
P
E
C
IE
S
400 350 300 250 200 150 100 50 0 4 44 4 4 4 4 4 4 4 4 4 4 4 4 5 5 5 5 5 5 5 55 55 5 5 5 6 6 6 6 6 6 6 6 6 6 6 6 6 6 7 7 7 7 7 7 7 7 7 7 7 7 7 7 3 3 3 3 3 3 3 3 3 3 3 3 3 3 3 1 1 1 1 1 1 1 1 1 1 1 1 1 1 1 2 2 2 2 2 2 2 2 2 2 2 2 2 2 2 (end of s e as on g /m ) 2UNGRAZED
20 40 60 80 400 350 300 250 200 150 100 50 0 4 4 4 4 4 4 4 4 4 4 4 4 4 4 5 45 5 5 5 5 5 5 5 5 5 5 5 5 5 6 6 6 6 6 6 6 6 6 6 6 6 6 6 7 7 7 7 7 7 7 7 7 7 7 7 77 3 3 3 3 3 3 3 3 3 3 3 3 3 3 3 1 1 1 1 1 1 1 1 1 1 1 1 1 1 2 2 22 2 2 2 2 2 2 2 2 2 2 2 GRAZED w it h o u t B o u teloua, B u c h lo e , Opun ti a , S p h a era lc e a Figure 3BOGR 0 5 10 15 20 25 30 1992 1995 1997 1999 2001 2003 year % UG UU GU GG LEDE 0 0.2 0.4 0.6 0.8 1 1.2 1.4 1992 1995 1997 1999 2001 2003 year % UG UU GU GG LITT 20 30 40 50 60 70 1992 1995 1997 1999 200 1 2003 year % UG UU GU GG EXOTICS 0 0.1 0.2 0.3 0.4 0.5 0.6 1992 1995 1997 199 9 2001 200 3 year % UG UU GU GG GRASS 0 5 10 15 20 1992 1995 1997 1999 2001 2003 year % UG UU GU GG FORBS 0 1 2 3 4 5 6 1992 1995 1997 1999 2001 2003 year % UG UU GU GG Figure 4
Fauna
a) Long-term monitoring of prairie dog colonies on the Pawnee National Grassland (PNG) and the Central Plains Experimental Range: The PNG is administered by the United States Forest Service (USFS) and represents approximately 80,000 ha of publicly owned land
embedded within a checkerboard of lands under federal, state, and private ownership. It is divided into eastern and western units (Pawnee and Crow Valley, respectively) separated by a 16-km wide strip of private land. A greater proportion of the western Crow Valley Unit is contiguous federal grassland than is the eastern Pawnee Unit. The Central Plains Experimental Range (CPER), located on the northwestern corner of the PNG, is a research area established in 1939 and administered by the US Department of Agriculture / Agricultural Research Service to study the effects of grazing on sustainability of the short grass prairie.
Survey 1981-2004 -- Since 1981, USFS personnel have monitored the location, activity (i.e.,
extinct or active), and size of 60 of the prairie dog towns on the PNG. Since 1995, when prairie dogs recolonized the CPER, an additional ten towns have been monitored by the SGS-LTER. Another 16 prairie dog towns monitored by the USFS on the PNG were active in the years just before 1981 but went extinct before the long survey began. Two of these have been recolonized recently. Recent surveys (spring 2005) suggest that relatively few large towns exist on the private land interspersed within the patchwork of the publicly owned land. Thus, the data are representative of the overall black-tailed prairie dog population within the administrative boundaries of the PNG.
Prairie dog town size was measured as the perimeter of the outermost active burrows of a town, with the area of a town determined by the minimum polygon within the perimeter. From 1995 to the present, colonies were mapped using global positioning satellite technology (GPS) and incorporated into a Geographic Information System (GIS) using Arc/INFO 9.0 and ArcView 3.2 (Environmental Systems Research Institute, Redlands, CA). From 1981 to 1994, town
perimeters were mapped using surveying equipment, with distances to nearby landmarks measured. These maps were incorporated into the GIS in 1999 by finding GPS coordinates of landmarks used as ground controls, digitizing paper maps for the GIS, and scaling the towns to size based on the ground control points (Figure 5).
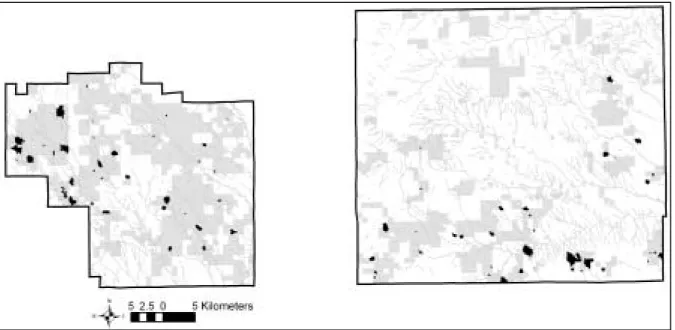
Figure 5. The Pawnee National Grassland in north-central Colorado. The eastern (Pawnee) and
western (Crow Creek) administrative boundaries are shown in black, with the patchwork of public (gray shapes) and private ownership. Dark black shapes show the largest extent of the 86 prairie dog towns between 1981 and 2004.
Prairie dogs have been severely impacted by the introduction into North America of Y. pestis, the bacterium that causes plague. Plague has converted prairie dogs into metapopulations, by
causing local extinction of prairie dog towns during outbreaks, with subsequent recolonization 2-4 years after the disease wanes. Analyses of these data revealed that plague outbreaks are more common during wetter and cooler periods (Stapp et al. 2004), but are uncommon during hot dry years of drought, like those from 2000 to 2003 (Figure 6). Overall, prairie dogs have increased on the PNG and CPER, and currently occupy 1,880 ha (about 1.5 % of the total area). However, as can bee seen clearly below, individual towns experience large fluctuations in size.
Figure 6. Total area (ha) occupied by prairie dogs on the Pawnee National Grassland (solid thick line),
based on the survey conducted between 1981 and 2004. Areas of six representative towns from the western PNG demonstrate the fluctuation in size of towns after they are colonized but before they are decimated by plague.
Pawnee National Grassland, Colorado
0 10 20 30 40 50 60 70 80 90 100 81 82 83 84 85 86 87 88 89 90 91 92 93 94 95 96 97 98 99 00 01 02 03 04 Year Tow n S iz e ( h a) 0 200 400 600 800 1000 1200 1400 1600 1800 2000 T o tal A r e a (h a )
Town 51 Town 62 Town 66
Town 70 Town 69 Town 80
b) Estimation of prairie dog abundance: In 2002, we initiated visual counting of prairie dog colonies. This work is being led by MS student and technician Dan Tripp, in collaboration with a Ph.D. student in the Department of Fisheries and wildlife Biology at CSU, Brett McClintock. In 2004 this was expanded to include all towns on the western PNG, as part of the regular population monitoring. Visual counts indicate that while average colony size has increased on the CPER and PNG, that prairie dog density has also increased as the drought of 2002 ended.
Figure 7. Visual counts on all towns on the CPER and
the western PNG are now a permanent feature of the monitoring on the LTER. We are working, to calibrate the index counts from these methods with robust density estimates via mark-resight procedures. Six towns will be more intensively enumerated in 2005 and 2006, at the same time that visual counts continue.
c) Mapping of suitable habitat on the Pawnee National Grassland and Central Plains Experimental Range: This work was carried out in collaboration with Post-doctoral Researcher Becky Eisen and graduate student Lisa Savage, with additional funding from the Colorado Division of Wildlife and the Pawnee National Grassland. Understanding the habitat requirements of Black-tailed prairie dogs within the shortgrass prairie will be useful in
identifying areas most suitable for prairie dog persistence. The objectives of this study were to: 1) identify landscape features predictive of suitable prairie dog habitat within the short-grass prairie of the Pawnee National Grassland (PNG) in north central Colorado, USA. and 2) create a spatially explicit model, from a Geographic Information System that predicts how much of the PNG is suitable prairie dog habitat. Long term surveys of prairie dog towns on the PNG between 1981 and 2004 show that 1.5% of the PNG is presently occupied by prairie dogs, with 3%
occupied at some point in time since 1981. Comparison between prairie dog towns and nearby unoccupied areas revealed that prairie dog towns were on drier, flatter areas in close proximity to low lying drainages with relatively deep soils and east-facing exposures. Evaluation of a
logisitic regression model’s ability to predict suitable prairie dog habitat yielded accuracy of 68.6%, indicating the proportion of pixels (30 m2) classified as suitable that were occupied. The model predicts that 23% of publicly-owned land on the PNG is suitable prairie dog habitat (Figure 8). 0 25 50 75 100 125 2002 2003 2004 T o wn Ar ea ( h a ) 0 5 10 15 20 De ns it y Size Density
Figure 8. Map of suitable prairie dog habitat on the PNG (publicly-owned land is
shaded gray), based on a probability cut-off of 0.556. Suitable habitat for black-tailed prairie dogs on the PNG is characterized by dry, flat, east-facing areas where density of low-lying drainages is high and soils are deep.
d) Climatic and landscape correlates of extinction and colonization of Black-tailed prairie dogs: To follow up on the discovery that plague outbreaks are clustered during years with El Niño climatic patterns (cooler, wetter) during the last 24 years of survey on the PNG, Ph.D. student Lisa Savage has created a statistical model of plague occurrence. The data set now extends to 2004, with 5 new outbreaks after the end of the drought of 2001-2003. Climate data (temperature, rainfall) from four widely spaced weather stations on the PNG were imputed to determine conditions at each prairie dog town, spatial data and soils data were derived from the GIS we have created. Logistic regression analysis (with AIC) shows that three factors regularly predict plague outbreaks: connectivity (more isolated towns), cooler summers (ratio of days > 26° to > 32°), and soils with the capacity to retain moisture (water potential, -15 bar, at 30 cm depth). Other factors, like total rainfall, were poor predictors of plague outbreaks.
Figure 9. Correlation of Prairie Dog Town Extinctions with Geographic and
Climatic Factors.
e) Population genetic analyses of prairie dogs: Ph.D. student Lisa Savage has also extended population genetic analysis of prairie dogs on the CPER colonies to include three years of sampling (1997, 2000, 2001). This study continues an earlier population study conducted on the
Connectivity Along Drainages
Tow n Ex tinc tion 10^-9 10^-4 10^1 0.0 0 .2 0.4 0 .6 0.8 1 .0 c8090 Tow n Ex tinc tion 2 4 6 8 10 0.0 0 .2 0.4 0 .6 0.8 1 .0 -15bar soils T o w n E x tin c tio n 0.0 0.5 1.0 1.5 0. 0 0 .2 0. 4 0 .6 0. 8 1 .0
Total Yearly Precip
T o w n E x tin c tio n 200 300 500 0. 0 0 .2 0. 4 0 .6 0. 8 1 .0
western PNG (Roach et al. 2001). Analyses are based on variation of seven microsatellite markers and the control region of the mitochondrial DNA (mtDNA). At this scale, evidence for sex-biased gene flow among prairie dog towns: physical distances between colonies are related to genetic distances of maternally inherited mtDNA markers, but not of bi-parentally inherited microsatellites.
Figure 10. Assignment tests indicate that ~10% of individuals captured on prairie
dogs towns have genotypes consistent with them being immigrants or the offspring of immigrants.
Marker – distance measure r2 (1997) r2 (2000) r2 (2001)
Microsatellite Fst – drainage -0.32 0.03 -0.51
Microsatellite Fst -Euclidean -0.28 0.07 -0.60
mtDNA Fst –drainage 0.68 * 0.63 * 0.73 *
mtDNA Fst –Euclidean 0.54 * 0.52 * 0.58 *
Population genetic analysis of indicate that genetic distances between towns (Fst)
was correlated with both direct (Euclidian) distances between towns and distances along drainages.
f) Effects of diet on facultative torpor in Black-tailed prairie dogs: This project comprises the thesis and dissertation work of Erin Lehmer, who graduated with a Ph.D. in spring 2004. Six peer-reviewed publications have resulted thus far. Prairie dogs present a model system for the study of torpor because of their broad geographic distribution, and because the ability of animals to enter torpor depends upon numerous physiological and environmental factors. Black-tailed prairie dogs practice facultative torpor, rather than obligate hibernation. The objective of this research was to examine how diet quality and habitat conditions influence facultative torpor in Black-tailed prairie dogs along elevational gradients in northern Colorado. Dietary analyses showed that prairie dogs prefer plants with high in lipid and nitrogen content, relative to other available plant species. Prairie dogs at lower elevation entered more shallow and infrequent torpor than prairie dogs at higher elevations. During the deepest drought in 2002, a single colony (town 22 on the CPER) at low elevation exhibited torpor patterns that resembled true hibernation, while an adjacent colony (CPER 5) did not. No genetic differences between the colonies could be found, but subtle differences in moisture and diet may have been responsible for the difference. Collectively, the study underscores that torpor can result in significant energy savings, and is an essential component of the life-history of prairie dogs, allowing them to persist in habitats where food resources fluctuate seasonally and where environmental conditions are often unfavorable.
Exclude all pops but
source
Exclude some pops but not
source
Exclude source but not
other pops Exclude all pops sampled p-value used: 1/sample size 1997 16 51 4 10 p=1/82=0.012 19.75% 62.96% 4.94% 12.35% 2000 13 117 6 5 p=1/141=0.007 9.22% 82.98% 4.26% 3.55% 2001 16 98 5 5 p=1/124=0.008 12.90% 79.03% 4.03% 4.03%
g) Effects of prairie dog colony age on vegetation: A study nearing completion by graduate student Laurel Hartley is investigating the effect of colony age ( ~4 years vs. >20 years since colonization) on biomass, cover, species composition, and plant/soil N relationships. As with our long-term study, grass biomass is lower and forb biomass higher on prairie dog colonies, but the differences increase very little with time since colonization. This contrasts with studies on the mixed-grass prairie in which grasses are nearly eliminated from prairie dog colonies in as little as 10 years following colonization. In colonies that recently died of plague, the differences in biomass on and off colonies began to narrow within a year.
h) Effects of prairie dogs on floral abundance and insect pollinators: A study in the final year of data collection by graduate student Kelly Hardwicke is testing the hypothesis that the greater forb abundance on prairie dog colonies provides a more abundant supply of floral resources, and that there is a larger insect pollinator community on prairie dog colonies than on uncolonized grassland. Data to date indicate that both the dominant pollinator orders,
Hymenoptera and Lepidoptera, were observed foraging 2-3 times more frequently on prairie dog colonies than on similar uncolonized sites.
i) Density and distribution of harvester ants on and off prairie dog colonies: This year, graduate student Christina Alba is beginning a study to determine whether grazing and soil disturbance by prairie dogs influences the density of ant mounds or their distribution on the landscape. In addition, she will measure the effects of harvester ants, singly and in combination with prairie dogs, on the vegetation at varying distances from their soil mounds.
j) Effects of black-tailed prairie dog activity on belowground community structure in the shortgrass steppe: There are two main components of this research in prairie dog ecology. 1) in year one, an initial examination on prairie dog colonies was conducted in order to identify types of landscape effects with respect to prairie dog activity on belowground food web interactions. 2) in years two and three, the goal is to differentiate changes in belowground food web
interactions by target sampling on extant and active prairie dog mounds. Specifically we are examining variations on productivity and belowground community trophic structure among different type of mounds (crater, dome and other) within inactive and active areas of two black-tailed prairie dog towns located on the Pawnee National Grasslands (PNG).
k) Preliminary data for fungal-arthropod densities and interactions: Prairie dog activity does have an affect on belowground arthropod populations. The increased abundance of Cryptostigmata and Astigmata mite order in Active sites may be attributed to the influx of detrital material (i.e. fecal matter, fur, plant material ) into the belowground ecosystem due to prairie dog activity. Lack of prairie dog activity in the Extant and Off-town sites shows a decrease in these arthropod populations. The slight decrease of fungal hyphae in our Active treatment in 2004 may be explained by the increased proliferation of Astigmata and
Cryptostigmata populations. Collembola populations increased as total fungal lengths decreased over the course of 2003 for both CPER and PNG. Increased consumption of hyphae or persistent drought conditions may explain prevalent seasonal differences. Arthropod and fungal
communities may be significantly influenced by both the physical disturbance of soil from burrowing and from prairie dog activity.
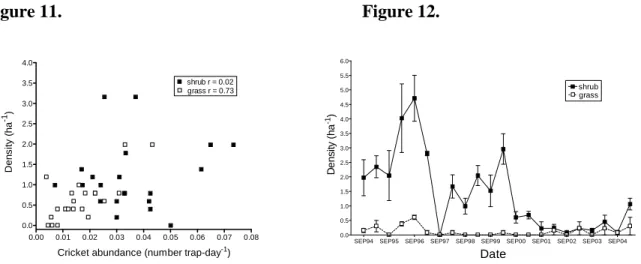
l) Long-term studies of small mammal communities and their resources We have conducted long-term field studies of small mammal populations on grassland and shrub-dominated sites (studies of diurnal ground squirrels began in 1999). In 1998 and 1999, we began sampling arthropod populations and vegetation, respectively, on the trapping webs to monitor changes in habitat and food resources. Also in 1994, we initiated spotlight counts of rabbits for one night each season along a 32-km route to track changes in the abundance of rabbits. Parallel surveys of relative abundance of coyotes and foxes (via scat counts) are conducted each season to estimate predator abundance. In addition, annual BBS and CBC data on raptor populations are available for the SGS-LTER site. We are assembling a long-term data set on trends in small mammal populations, their resources and predators, with the aim of deciphering the relative importance of climate,bottom-up (food resources) and top-down (predators) factors as
determinant of variation in small mammal abundance. Density of grasshopper mice, the most common species captured, were strongly related to abundance of insect prey (crickets,
tenebrionid beetles), but only on grassland sites (Fig. 11). Prey availability may be an important determinant of population density on grassland sites, which provide less cover and may be lower-quality habitat for rodents than shrub sites.
Figure 11. Figure 12.
Shrub areas seem to be sources for deer mice, which spill over into grasslands only during spring when mouse densities in shrub areas are high. Small mammals like deer mice were severely affected by the recent drought and had only begun to recover in early 2005 (Fig. 12). Rabbits have increased over the past four years of drought, largely as a result of increases in numbers of black-tailed jackrabbits, which are associated with arid conditions (Fig. 13). Our scat indices suggest little consistent variation in coyote abundance over this period, although spring coyote numbers are positively related to rabbit numbers the previous autumn.
Figure 13. 0.00 0.01 0.02 0.03 0.04 0.05 0.06 0.07 0.08 0.0 0.5 1.0 1.5 2.0 2.5 3.0 3.5 4.0 grass r = 0.73 shrub r = 0.02
Cricket abundance (number trap-day-1)
Den s it y ( h a -1)
SEP94 SEP95 SEP96 SEP97 SEP98 SEP99 SEP00 SEP01 SEP02 SEP03 SEP04 0.0 0.5 1.0 1.5 2.0 2.5 3.0 3.5 4.0 4.5 5.0 5.5 6.0 grass shrub Date De n s ity ( h a -1)
JUL94 JUL95 JUL96 JUL97 JUL98 JUL99 JUL00 JUL01 JUL02 JUL03 JUL04 JUL05 0.0 0.5 1.0 1.5 2.0 2.5 3.0 3.5 4.0 0 2 4 6 8 10 12 14 16 18 20 coyote scats rabbits Date Rabbi ts seen per km (S c ats k m -1 ni g h t-1 )* 100
2. Biogeochemistry:
Land Usea) Urbanization Influences on SGS Biogeochemical Cycles: While much of our research in the past has been focused on the agricultural landuse types that have comprised the bulk of land area for the past hundred years or more: grazing and row-crop agriculture. However, recently
there has been a dramatic expansion in suburban development, reaching out into the shortgrass steppe. We obtained a USDA NRI Postdoctoral fellowship to study the effects of urbanization on the biogeochemistry of the shortgrass steppe (Kaye et al. 2004, 2005). We found that the additions of water and fertilizer that attend suburban lawns significantly increased ecosystem carbon storage and trace gas fluxes from the region. Figure 14.
b) Faunal Influences on SGS Biogeochemistry: Biota have the largest consequence based upon their capabilities for influencing belowground stores of carbon. For plants, the location, quality, and amount of root production is the major influence over biogeochemical pools and processes. Up to now, we have not examined the direct effect of fauna on biogeochemical pools and processes. We are currently investigating the influence of our keystone species, prairie dogs, on many aspects of the shortgrass steppe. Recent results from a PhD dissertation (Hartley, in prep) indicate that prairie dogs increase N cycling. These results are similar to those found in mixed-grass prairie, but in the shortmixed-grass steppe, these results have substantial significance for livestock. Prairie dogs may decrease total forage, but they apparently increase forage quality for cattle.
0 50 100 150 200 250 300 350 400 450 Off Town On Town Mound Off Town On Town Mound Off Town On Town Mound
New Old Inactive
Type of Prairie Dog Colony
P R S T M pr obe s uppl y r a te (µµµµ g of N /1 0 c m 2/m ont h) Solid = NH4+ Pattern = NO3-A A B Figure 15. 0 1000 2000 3000 4000 5000 6000
S
o
il O
rgan
ic C
g C m -2Urban Wheat Corn Native
0 1000 2000 3000 4000 5000 6000
S
o
il O
rgan
ic C
g C m -2c) Long term experiments of water and temperature controls over biogeochemical fluxes: Our SGS-LTER has 2 long term experiments evaluating the effects of nitrogen and water on ecosystem structure and functioning, as well as one long term experiment addressing temperature increases and reduced precipitation. While these experiments and core data sets represent one important type of scientific endeavor, we are also exploring these questions using simulation analysis, directed at longer term responses, interacting effects using a sensitivity analysis
approach, and comparing our grassland site with other sites as well. Pepper et al. (2005) recently completed such a study that showed that for both the G’DAY and DAYCENT models, only treatments that include N will result in increased net ecosystem production (Figure 16). Temperature increases in the absence of N result in decreased net ecosystem production, or losses of C from the system. Thus, the particular global change scenario matters a great deal for feedbacks with atmospheric carbon dioxide.
We have also conducted simulation analyses to assess the influence of changing the seasonality of precipitation, at all of the grassland LTER sites, using the scenarios implemented in the field at the Konza (maintaining the same amount of precipitation, but changing the events such that it arrives in half as many events (decreased frequency) or twice as many (increased frequency) (Burke et al in prep).
d) The influence of physiography on shortgrass steppe biogeochemistry: Spatial patterns in the shortgrass steppe are largely dependent on the landscape scale variability in soil texture and soil parent material, rather than landscape variability in soil water content. We continue detailed analyses of landscape soil variability across a very much expanded gradient that extends
eastward into the Pawnee National Grasslands (Kelly et al, in prep). Our analyses suggest that landscape varability is considerably more complex than soil texture or parent material,
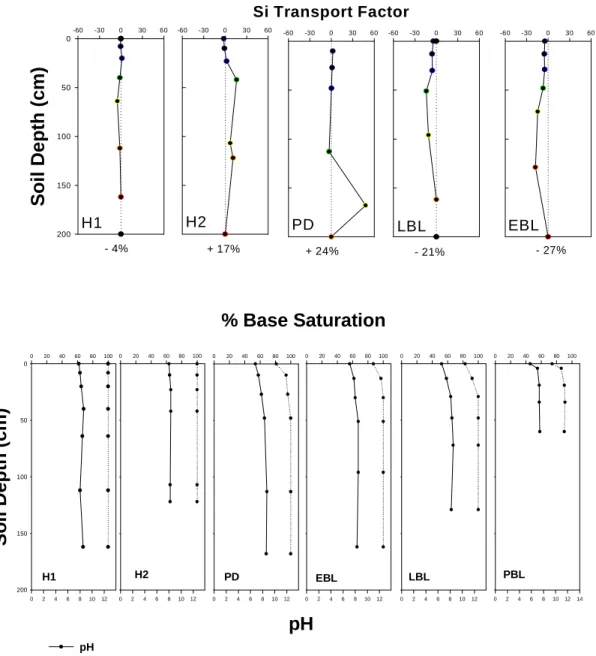
incorporating a weathering sequence that extends from 600,000 years before present, to 2,000 years before present. This substantial temporal gradient has a strong influence on soil available P as we reported last year. Other important chemical properties which seem to express variations in soil chemical behavior are, Si , pH and %base saturation and likely other biogeochemical pools and processes that we are currently investigating (Figure 17).
H1 pH 0 2 4 6 8 10 12 So il D e pth (cm) 0 50 100 150 200 % Base Saturation 0 20 40 60 80 100 pH % Base Saturation H2 0 2 4 6 8 10 12 0 20 40 60 80 100 PD 0 2 4 6 8 10 12 0 20 40 60 80 100 EBL 0 2 4 6 8 10 12 0 20 40 60 80 100 LBL 0 2 4 6 8 10 12 0 20 40 60 80 100 PBL 0 2 4 6 8 10 12 14 0 20 40 60 80 100
Figure 17. Variations in Soil Chemical properties as a function of landscape age (a) ph and % base
saturation, (b) total soil Silica, (H1= 2K, H2= 10K, PD= 17K, EBL = 190, LBL = 190K, PBL = 600K)
H1 -60 -30 0 30 60 S o il D e p th (c m ) 0 50 100 150 200 EBL -60 -30 0 30 60 PD Si Transport Factor -60 -30 0 30 60 H2 -60 -30 0 30 60 LBL -60 -30 0 30 60 - 4% + 17% + 24% - 21% - 27%
e) Spatial and Tempral Integration of Water Movement: We utilized a chloride mass balance model to integrate space and time with regard to ecohydrological conditions that persist over the short grass steppe region. The approach uses the change in concentration of chloride in the soil profile over time to estimate patterns of water penetration. Because chloride undergoes no chemical transformations in the soil, losses or gains of chloride from the soil profile may be assumed to be due to the movement of water containing dissolved chloride. Changes in the total amount of chloride in the soil and the concentration of chloride in water draining from the root zone over time are used to calculate how much water moved through the soil profile during a specified time period. (Figure 18). below shows the Chloride mass balance for Siltstone parent material across hillslope and chloride mass balance as a function of texture. Higher Cl levels suggest more capillary rise in finer texture soils (data from ongoing hillslope studies)
Figure 18 . (a) Chloride mass balance for Siltstone parent material across hillslope, (b) Chloride mass
balance as a function of texture. Higher Cl levels suggest more capillary rise in finer textrue soils (data from ongoing hillslope studies)
f) Silcon Biogeochemistry in Grassland Ecosystems: We and others (e.g. Conley, 2002) hypothesize that there is a critical link in global biogeochemistry between the biogeochemical silica in terrestrial systems and its export to the better documented marine biogeochemical cycle of Si. Because available evidence suggests that grassland systems are a particularly large and active reservoir of biogenic silica (Derry et al., 2002, 2005), we argue that global expansion of grasslands during the late Neogene could have had important consequences for both marine and terrestrial Si cycles, and thus the global carbon cycle. Despite its potential significance for the global silica (and carbon) cycle, the biogeochemical behavior and residence time of biogenic Si in terrestrial grassland ecosystems is largely unknown. Our key results were as follows: 1) In shortgrass systems, higher plant Si contents; lower annual biogenic inputs and larger soil biogenic Si pools are the; 2) Soil biogenic Si turnover increases from short to tallgrass systems; 3) In all grasslands, biogenic Si cycling tends to have a positive impact on mineral weathering; 4) Though weathering trends are apparent, these hydrologically complex systems require more intensive characterization to fully exploit the utility of Ge/Si ratios in discerning stream Si provenance (Figure 19); 5) Our results point out the importance of grasslands in the mobilization of Si from terrestrial ecosystems.
Figure 19.
3. Land-Atmosphere Interactions
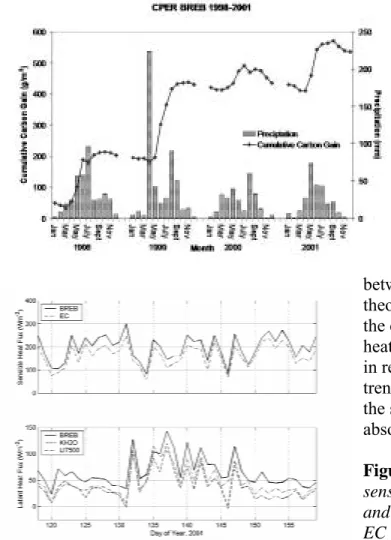
a) Determining fluxes of energy, water and CO2. Analyses of fluxes of CO2 performed in
pastures of native shortgrass steppe vegetation over the past several years reveal higher annual rates of C gain than were anticipated. For instance, we measured an accumulation of
approximately 500 g C m-2 over a 4-year period from our Bowen ratio energy balance (BREB) flux tower (Figure 20). This seems high compared to ANPP estimates from long-term data sets at the SGS site of 97 g dry matter m-2, (Lauenroth and Sala, 1992), and an assumption that C is not changing rapidly in this grassland. To evaluate our BREB flux measurements, we began a collaborative study with Dr. Peter Blanken and gradient student Joe Alfieri (University of Colorado and National Center for Atmospheric Research, Boulder, CO) to install an eddy covariance (EC) tower next to one of our BREB systems and begin a side-by-side monitoring of fluxes of energy, water and CO2.
0 200 400 600 800 1000 1200 1400 1600 0 1000 2000 3000 4000 5000 ANPP (kg/ha) S o il b io g e n ic S i tu rn o v e r tim e (y r)
Figure 20. BREB measurements 1998 through 2001.
The BREB and EC methods have different theoretical and practical considerations that can affect their estimates of the components of the surface energy budget (Alfieri et al., in review). Measurements confirmed this possibility; in that sensible heat flux was 28% greater, latent heat 25% greater, and CO2 fluxes 95% greater
when measured with BREB compared to EC (Figure 21). The discrepancy between BREB and EC flux measures was due, in large part, to different requirements in energy balance closure between the two methods, and the similarity theory in the BREB method which assumes the eddy diffusivities for sensible and latent heat, and CO2 are all the same) (Alfieri et al.,
in review). These results suggest that while trends in fluxes of energy and gases may be the same between BREB and EC methods, absolute values can vary substantially. Figure 21. Comparisons of latent and
sensible heat for the two methods: KH20 and LI7500 in lower panel are two different EC configurations.
b) Paleoclimate and Paleoecology of the SGS: The overriding objective is the reconstruction of dust, vegetation, soil development and climatic records in the western Great Plains during the Holocene. Specific objectives include: 1) Establish isotopic records of SOC, CaCO3 and
phytoliths from paleosols in SGS, 2) Examine loess/paleosol stratigraphc sequences for episodic pulses of dust associated with large changes in vegetation cover. 3) Identify key faunal and botanical remnants to create a model of plant community composition throughout Holocene. 4) Compare results against modeled vegetation changes associated with climate alone.
We chose to start this work by describing and sampling the Old Wauneta site because, at 6 meters, it arguably is the thickest and most complete Holocene loess section on the western and central Great Plains (Jacobs and Mason, 2005), compared to thicknesses of generally less than 2 meters in eastern Colorado. Holocene Bignell loess at Old Wauneta contains as many as 5 buried A horizons. Particle size analysis and pedogenic carbonate analysis is complete for the site. Oversized thins sections from undisturbed samples of loess and soil horizons have been prepared for the entire sequence and analysis is underway. Samples for phytolith morphotype analysis to reconstruct plant communities is underway, as is analysis of δ13C and δ18O of phytoliths.
The Sand content of the loess appears to be a proxy for loess deposition rate (greater sand content equaling greater loess deposition rate). Sand content of the loess was about 35-40% at the end of the latest-Pleistocene Peoria Loess deposition and it increased gradually to about 55% sand by the mid Holocene. This likely indicates slow loess deposition rates at the end of Peoria Loess deposition leading to the formation of the Brady Soil on a landscape stabilized by
vegetation, followed by gradual burial of the Brady Soil as loess deposition rates increased in the early Holocene. Sandier loess and an absence of soil development mark the period from about 9 to 6 ka B.P. and may be the result of deep and persistent drought conditions. Fluctuating
deposition rates alternating with periods of weak soil development then dominated from the mid Holocene to the present (Figure 22.).
Figure 22. Location of bioclimatic sequence of paleosols sampled in 2003-2004 for paleoclimatic studies.
Ages in 1000s yr BP, courtesy of Joe Mason (Miao et al., 2005).b) sedimentation analyses and SOC at at Old Wauneta, Nebraska,
4. Integrated and Synthetic and Cross Site Research
Faunal Ecology Cross-site activities: In July 2005, we submited a proposal to NCEAS to support development of a Working Group to analyze and synthesize results of long-term studies of small mammals across the latitudinal gradient of semiarid and arid grasslands represented by the SGS, Sevilleta and Jornada LTER sites. Invited participants include the LTER PIs
responsible for designing and maintaining these projects, as well as at least one LTER graduate student.
B) INFORMATION MANAGEMENT
The Shortgrass Steppe LTER Information Management (IM) team is working on projects to improve support for local and network science, and access to more integrated, metadata, data and other information. The team currently consists of Nicole Kaplan, who works closely with Bob Flynn, GIS and IT manager. A position on the team has been created to support database and web development, which is currrently being advertised for a comupter science student. It is
1
2
3
% San -700 -600 -500 -400 -300 -200 -100 035 45 55 65 D e p th (c m ) % Carbona 0 0 0 0 0 0 0 0 1 2 3 4 5important to balance our commitment to site support, Network initiatives and outside
ecoinformatics projects. The SGS Principal Investigators are discussing the interpretation and application of newly adopted LTER Network data access and use policies. Nicole is involved with the Network IM and broader ecoinformatics communities as a member of LTER IMexec and Website Design Working Group Leader.
The SGS Information Management team has plans to improve on-line searching capabilities for data and metadata by developing new web site tools. They have recognized the need for better integration of related data sets, spatial and non-spatial data, publications and other research information. Recommendations from the LTER Network Wesite Design Working Group will be considered when implementating the second generation SGS web site (Kaplan 2005). Our field staff are in the process of collecting Global Positioning System coordinates to complete our spatial coverage of most legacy and all current long-term and short-term data stes. We are making progress toward integrating our non-spatial and spatial data sets, to enhance management of study impacts on field sites and support data discovery with level 2 Ecological Metadata Lanaguage from the SGS database.
Metadata in the SGS Information Management System vary in richness, since fifteen percent of our data sets are legacy data sets from the USFS and IBP. Because of this, information required to meet the new LTER standard metadata content of EML may not be available. Metadata for more recent and current SGS data sets can be submitted directly to the RDBMS by students and PIs via web-based forms. We recognize the importance of maintaining robust metadata to ensure the usability of data in the future and are making efforts to conform our metadata tables in the RDBMS to EML according to the EML Best Practices document. We have a strategy to bring metadata in the RDBMS to Level 2 EML by exporting metadata content in XML (Extensible Mark-up Language) and converting the XML to EML with XSLT (Extensible Stylesheet Language Transformation) conversion scripts. Experts at the LTER Network Office have contributed to our efforts by providing licenses for software tools, example code, and tools for harvesting SGS metadata to a Metacat, a remote ecological metadata catalog. The SGS has also contributed to a community model metadata management system in RDBMS that is being developed and implemented at various LTER sites by the LTER Network office. Lastly, a GIS EML tool developed at the CAP (Central Arizona Phoenix) LTER site was tested on SGS GIS metadata to generate EML.
The IM Team is developing a suite of programs to improve QAQC practices at SGS, called the Matrix. The Matrix currently checks and formats meteorological data for submission to CLIMdb (http://www.fsl.orst.edu/climdb/) and is being expanded to support data tables produced by floral dynamics research, which contains over sixty percent of our studies. The IM team will continue to work with researchers to develop tools to more efficiently process, quality check and publish their data with high integrity.
Nicole continues to participate in ecoinformatics community projects, such as the Canopy Databank Project (http://canopy.evergreen.edu/bcd/home.asp) at The Evergreen State College. LTER IMs are contributing to the development of templates for data entry, analysis and
synthesis of aboveground net primary production data collected at distinct grassland sites. Synthesis of nutrient enrichment data is being demonstrated by the Science Environment for
Ecological Knowledge (http://seek.ecoinformatics.org/) project and includes SGS data and input for constructing ontologies of aboveground grassland vegetation measurements.
C) Educational, Outreach, and Training Activities
a) Research Experience for Undergraduates: We sponsored four REU students in 2004/2005.
Year Student Institution Advisor
2004 Julia West Middlebury College Indy Burke
2004 Chris Warren Earlham College Bill Lauenroth
2004 Josh Metten Colorado State University Bill Lauenroth 2004 Martin Dangelmayr Colorado State University Indy Burke b) Schoolyard Ecology: Participants represent a wide range of schools (one K-6, one 6-12, one middle school and 5 High Schools) from districts in the northern Front Range, eastern plains of Colorado and the Navajo Reservation in Arizona.
School
Science Teacher
Akron High School, Akron, CO Ms. Deanna Schrock
Frontier Academy, Greeley, CO Dr. Sean Madden Greeley West High School, Greeley, CO Mr. Gary Prewitt John Evans Middle School, Greeley, CO Mr. Jason Mclaughlin Rocky Mountain High School, Ft. Collins, CO Mr. Dave Swartz Rough Rock High School, Navajo Nation, AZ Mr. William Rosenberg S. Christa McAuliffe Elementary School, Greeley, CO Ms. Rebecca Ramirez Union Colony Prep School, Greeley CO Ms. Cathy Hoyt
c) Research Assistance for Minority High School Students (RAMHSS): The following students were supported with LTER RAMHSS funds in 2003/2004. The students were
participants in the UNC Upward Bound Math and Science program known as COSMOS. The students were supported with room and board, tuition and stipends for the six-week summer program, and provided stipends during the academic year.
Student Gender Ethnicity High School
SaDune Quarles M African-American Greeley West
Jaime Salazar M Hispanic Greeley West
Lucio Smith M African-American Greeley Central
d) GK-12: Human Impact along the Front Range of Colorado: The project is an NSF-funded collaborative between the University of Northern Colorado and Colorado State University. Graduate students in STEM disciplines are placed in K-12 classrooms during the academic year to assist K-12 teachers with the transference of research. K-12 teachers work with the graduate students during the summer on research. The project promoted the schoolyard ecology program,
and provided teachers with graduate credit hours, travel to National Meetings (e.g., the ESA in Savanna, GA in 2003). The following Graduate students have been supported:
Students Institution
Ms. Laurel Hartley Department of Biology, Colorado State University
Mrs. Meghan H. Quirk Department of Biological Sciences, Univ. of Northern Colorado Mr. Rodney Simpson Department of Biological Sciences, Univ. of Northern Colorado e) CLT-W: Center for Teaching and Learning in the West: The CLT-W is an NSF-funded collaborative between Montana State University, the University of Montana, Colorado State University, Portland State University, and the University of Northern Colorado with the
objective of researching the achievement gap between students of color and whites, providing K-12 professional development for teachers in STEM, and providing graduate programs in science education. The project supported research in the nature of the student-mentor relationship, and initiated an outreach program with Native American Tribes in Arizona, Montana and South Dakota (2004 Environmental Education supplement).
f) Teachers on the Prairie: The project is an NSF-funded collaborative between Portland State University, Oregon State University and the University of Northern Colorado, designed to provide K-12 teachers with focused professional development in prairie ecology. The following workshops were offered during June – August 2003:
Topic Instructor(s)
Bagging Big Bugs Dr. Boris Kondratief GIS Workshop Dr. Melinda Laituri Invasive Species Mr. Greg Newman
Peaks to Prairie Ms. Laurel Hartley and Ms. Angie Moline Soil Ecology Dr. John Moore
Soil Formation Dr. Gene Kelley
g) Native American Outreach: The project is an NSF-funded program through the Education and the Environment venture fund. Piloted in the summer of 2004 with funds from the UNC MAST Institute, the Native American Outreach program brought K-12 students, teachers, and elders from the Rough Rock High School in Arizona to the SGS-LTER site for intensive on site training in ecological principles and methodology. The team returned to Rough Rock and established a long term research monitoring program on the effects of grazing on soil erosion. The summer of 2005 will expand the program to include the Crow Reservation in Montana, and the Lakota Reservation from North Dakota.
D) PROJECT MANAGEMENT
We continue to refine our management process as needed to facilitate efficient support of our research, outreach and reporting efforts. For this round of funding we have moved our management efforts from an executive committee composed of all local co-PI’s to a smaller
group representing each of our research areas. The executive committee has met this past year to discuss primarily science and research topics and to prepare for the site review which took place July 13-15, 2005.
Dr. Eugene Kelly (EFK) is serving as lead PI. Dr. Michael Antolin (MFA) will assume the lead co-PI position at the begenning of year four (November, 2005). The small management group remains the same as it did last year and includes EFK, ICB, MFA and the leads of our other two research areas, Dr. Jack A. Morgan (JAM) for Land-Atmosphere Interactions and Dr. William K. Lauenroth (WKL) for Plant Dynamics. This group meets more often than our executive group to discuss issues affecting the project.
We remain active in attracting new scientists to the project. Drs. Justin Derner and Dana Blumenthal are new hires with the ARS in Fort Collins and both have become involved with LTER projects in the past year (mountain plover and invasive weeds, respectively). We have invited Dr. Joe Von Fisher and Dr. Alan Knapp to join our team of investigators and each has agreed to come on board in 2005-2006. This year we also hosted our SGS workshop and
focused our activities on issues relevant to conservation and management of the SGS ecosystem. We had 145 particpants from a wide varieity of institutions including but not limited to CSU, federal and state agencies, ranchers and NGOs.
Our brown bag seminar series continues to be a venue for inviting new researchers to meet our investigators, and talk about collaborations. We are meeting twice monthly during the academic year and have heard presentations from visiting scholars at CSU, graduate students, senior researchers from ARS and USGS, and our own researchers. Within our own research
community the feedback provided from those in one area has often given those in another area new ideas about interpreting data or setting up their next round of experiments. Specifically one graduate student in the fauna group studying prairie dog distribution saw an interesting trend that researchers in the biogeochemistry group could quickly link to differences in soil types. Further discussion of this correlation has lead to refinement in the student’s hypothesis and an extra dimension to interpretation of the data.