Optimal portfolio selection and risk-adjusted
performance of 51 equity funds available in the Swedish
premium pension
Master thesis in Business Administration
Programme of study: Civilekonom
Number of credits: 30 ECTS
Authors: Emilia Svensson 950416
Ninos Khouchaba 951017
Supervisors: Andreas Stephan
Aleksandar Petreski
Acknowledgements
Foremost, we would like to express our gratitude to our supervisors, Andreas Stephan and Aleksandar Petreski for their continuous support, dedication, and guidance throughout the process of writing this master thesis.
The authors would also like to express gratitude to our associated students for their encouragement and valuable inputs provided during the seminars.
________________________ ________________________
Emilia Svensson Ninos Khouchaba
Master Thesis in Business Administration
Title: Optimal portfolio selection and risk-adjusted performance of 51 equity funds
available in the Swedish premium pension.
Authors: Khouchaba, Ninos
Svensson, Emilia
Date: 2018-05
Key terms: Swedish premium pension system, national public retirement pensions, pension
fund performance, risk-adjusted performance measures.
Abstract
Background: In order to assure a livelihood for the working population after retirement, the
national retirement pension was developed. The system is based on 18.5% of each tax-paying worker’s annual salary. The national retirement pension system in Sweden consist of two parts. The first and largest part contributing with 16 percentage points, of the 18.5%, is a defined benefit plan, named the income pension. The second part contributing with 2.5 percentage points, of the 18.5%, is the premium pension, which is a defined contribution plan. The premium pension is the sole part of the national retirement pension controlled by the individual employee, with the opportunity to actively invest in a broad selection of domestic and international funds. Investors not making a choice will be transferred into the governments default fund, named the seventh AP fund. By investing in funds, the premium pension is partly based on each worker’s annual salary but also on the development of the financial market.
Purpose: This thesis has two purposes, the first is to investigate if the default alternative, the
seventh AP fund has had a superior risk-adjusted return compared to fifty of the most commonly selected equity funds available in the premium pension selection. The second purpose is to construct portfolios for active investors with different risk-tolerance in order to compare the risk-adjusted return between an investor that has made an active investment in comparison to an investor that has not made an active choice.
Conclusion: To conclude, this thesis shows that there are superior funds to select, with regard
to risk-adjusted return and risk-exposure, as an alternative to the seventh AP fund. In addition to this, the portfolio construction included in this thesis has proven that active participants can achieve results that are more compatible with their risk preferences in comparison to remaining in the default fund option. However, it is important for investors to remain active and alter their fund selections throughout the years, in order to attain the preferable outcome.
Table of Contents
1. Introduction 1 1.1 Background 1 1.2 Problem description 3 1.3 Purpose 5 1.4 Delimitations 6 1.5 Definitions 7 2. Theoretical Framework 92.1 Premium Pension Funds in Sweden 9
2.2 Risk-Return Trade-Off 10
2.3 Financial Theory 11
2.3.1 Single Index Model 11
2.3.2 Modern portfolio theory 12
2.3.3 Post-Modern portfolio theory 14
2.3.4 Capital Asset Pricing Model 15
2.3.5 Efficient Portfolio Construction 17
2.4 Previous Research 19 3. Method 22 3.1 Choice of Method 22 3.2 Collection of Data 22 3.3 Research Design 24 3.3.1 Sampling 24
3.3.2 Calculations, Assumptions and Benchmarks 25
3.4 Hypothesis Testing 26 3.5 Critical assessment 27 4. Empirical Results 29 4.1 Risk Exposure 29 4.2 Risk-Adjusted Performance 32 4.3 Portfolio Optimization 33
5. Analysis 40
5.1 Risk Exposure 40
5.2 Risk-Adjusted Performance 43
5.3 Portfolio Optimization 46
5.3.1 Minimum Variance Portfolio 46
5.3.2 Optimal Tangency Portfolio 47
6. Conclusion 50
7. Contributions to the Research and Suggested Further Studies 52
8. References 54
8.1 References to theory sources 54
8.2 References to data sources 60
9. Appendix 63
9.1 The 51 equity funds included in the study 63
9.2 Start-of-month net asset values for AP7 64
9.3 Risk-free rate 65
9.4 Yearly average rate of return 66
9.5 Yearly risk measurements 67
9.6 Yearly risk measurement ranking 73
9.7 Yearly risk-adjusted return measurements 74
Table of Figures
Figure 1 - The distribution between “AP7 equity fund” and “AP7 interest-bearing fund”
during a life-cycle ... 7
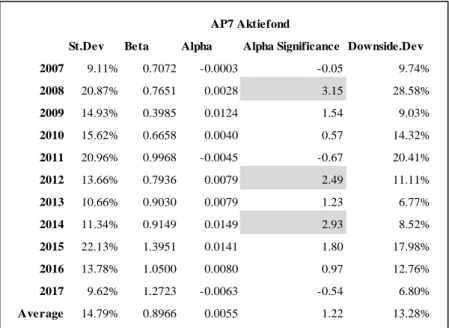
Table 1 – “AP7 Aktiefond” Yearly Risk Measurements (authors’ calculations) ... 29
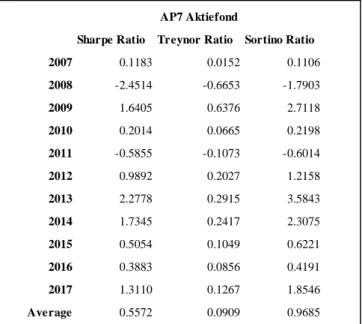
Table 2 - "AP7 Aktiefond" Yearly Risk-Adjusted Return Measurements (authors’ calculations) ... 32
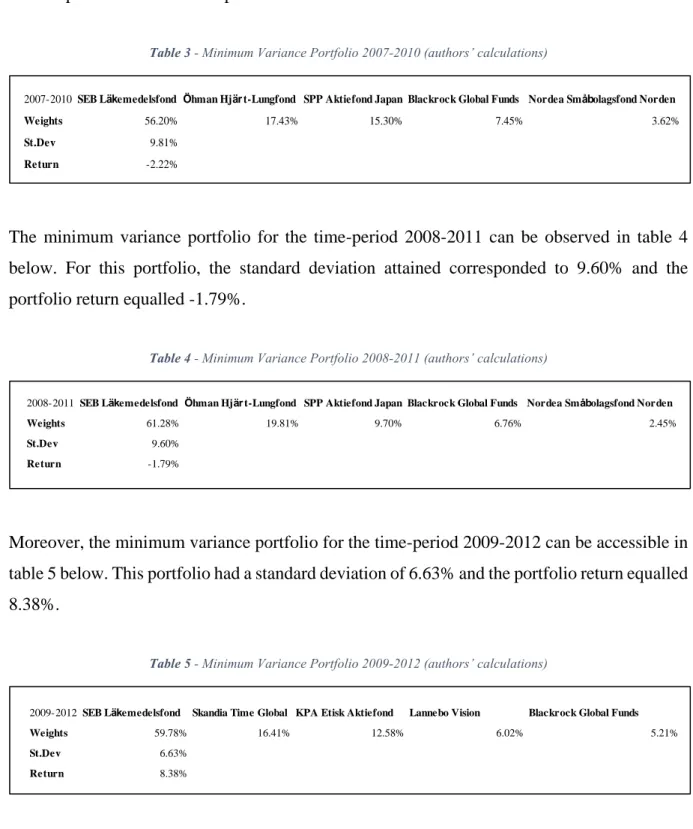
Table 3 - Minimum Variance Portfolio 2007-2010 (authors’ calculations) ... 34
Table 4 - Minimum Variance Portfolio 2008-2011 (authors’ calculations) ... 34
Table 5 - Minimum Variance Portfolio 2009-2012 (authors’ calculations) ... 34
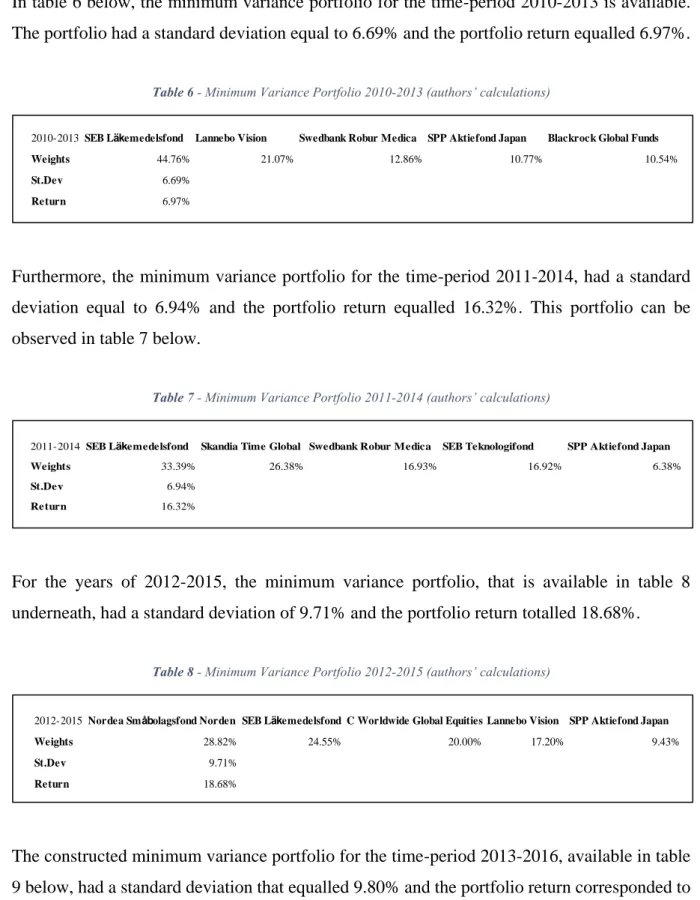
Table 6 - Minimum Variance Portfolio 2010-2013 (authors’ calculations) ... 35
Table 7 - Minimum Variance Portfolio 2011-2014 (authors’ calculations) ... 35
Table 8 - Minimum Variance Portfolio 2012-2015 (authors’ calculations) ... 35
Table 9 - Minimum Variance Portfolio 2013-2016 (authors’ calculations) ... 36
Table 10 - Minimum Variance Portfolio 2014-2017 (authors’ calculations) ... 36
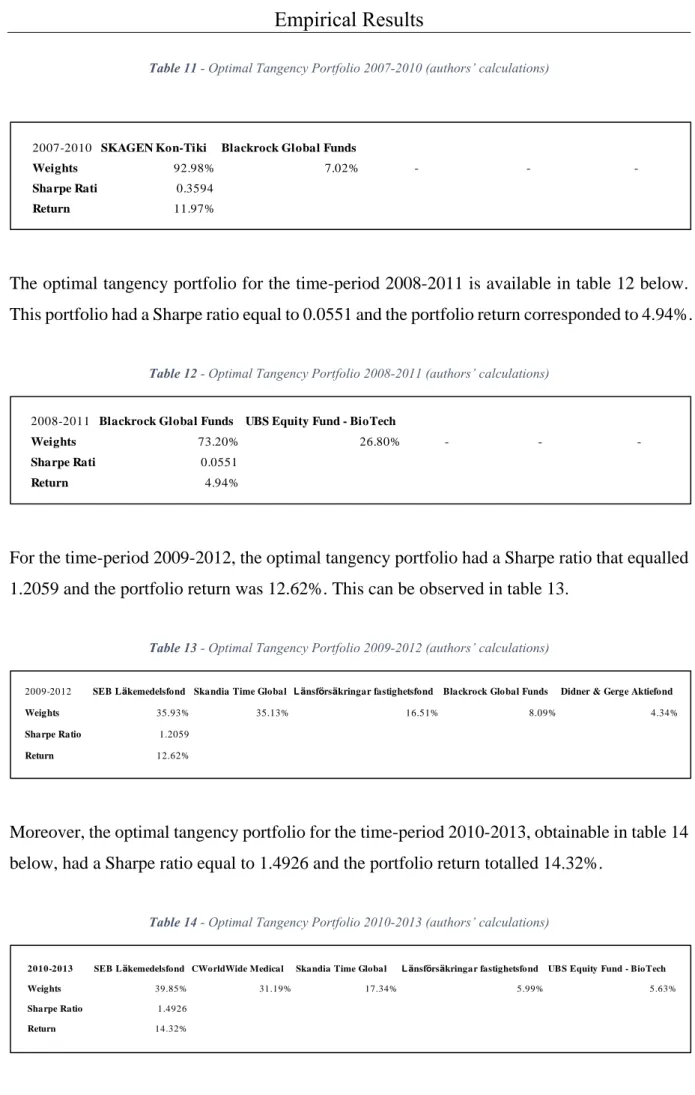
Table 11 - Optimal Tangency Portfolio 2007-2010 (authors’ calculations) ... 37
Table 12 - Optimal Tangency Portfolio 2008-2011 (authors’ calculations) ... 37
Table 13 - Optimal Tangency Portfolio 2009-2012 (authors’ calculations) ... 37
Table 14 - Optimal Tangency Portfolio 2010-2013 (authors’ calculations) ... 37
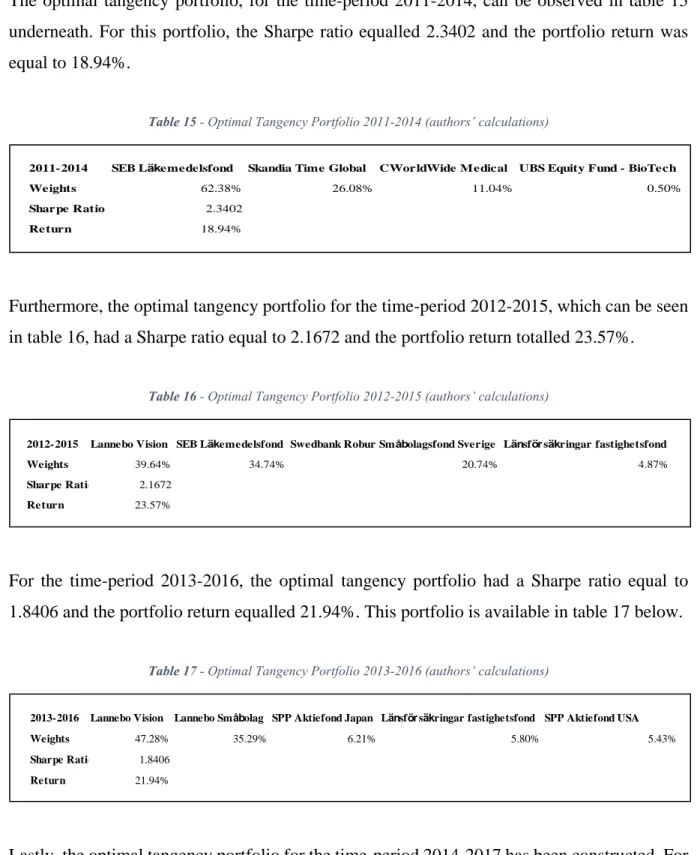
Table 15 - Optimal Tangency Portfolio 2011-2014 (authors’ calculations) ... 38
Table 16 - Optimal Tangency Portfolio 2012-2015 (authors’ calculations) ... 38
Table 17 - Optimal Tangency Portfolio 2013-2016 (authors’ calculations) ... 38
Table 18 - Optimal Tangency Portfolio 2014-2017 (authors’ calculations) ... 39
Table 19 - Low St.dev funds yearly average rate of return (authors’ calculations) ... 42
Table 20 – Standard deviation, MVP in comparison to AP7 (authors’ calculations) ... 46
Table 21 - Return, MVP in comparison to AP7 (authors’ calculations) ... 47
Table 22 - Sharpe Ratio, MVP in comparison to AP7 (authors´ calculations) ... 47
Table 23 - Sharpe Ratio, OTP in comparison to AP7 (authors’ calculations) ... 48
Table 24 - Return, OTP in comparison to AP7 (authors’ calculations) ... 48
1. Introduction
1.1 Background
Growing old is a natural course of life and there is no way to avoid it. As years move on, retirement will one day catch up and when that day comes every retiree will need a pension income. Previous statistics concerning the national retirement pension has shown that retirement savers who followed a passive investment strategy concerning their premium pension, thus automatically being selected into the governments default fund, have performed better than pension savers that have retained services from financial advisors (AP7, 2017). On the contrary, the governments default fund presently has a risk level, for participants up to 55 years of age, that is 1.24 times higher than an ordinary global equity fund (Pensionsmyndigheten, 2018c). The high degree of risk can be explained by the fact that the seventh AP fund uses leveraging in order to increase the probability of higher returns and thus higher pension for investors. The fund acquires derivative contracts, which can be comparable to the fund borrowing to invest and place them in global equities. As a result, the fluctuations of the seventh AP equity fund are greater than the average global equity fund (AP7, 2018a). Based on knowledge and preferences, people choose where to invest their money differently and the choices they make can yield a substantially different outcome (Engström and Westerberg, 2003).
The previous national retirement pension, known as the ATP system, received criticism for not being connected to the social economic development and that the system did not adjust to the increasing expectancy of the population (Sundén, 2006). With the increase in life-expectancy and the fact that economic growth slowed down in the late 20th century, the ATP system was condemned as not financially stable and a study was initiated to revise it in order to create a new sustainable pension system (Pensionsmyndigheten, 2018f). As a result, pressure from the Swedish population led to the creation of a new pension system that was announced in 1999 (Engström and Westerberg, 2003; Pensionsmyndigheten, 2018e). The reform had the intention to address three clear shortcomings from the previous national retirement system. Firstly, a clear connection concerning the contribution and benefits with regards to equality across generations. Secondly, financial sustainability should be realised by tying the pension system to financial growth. Thirdly, individuals should be granted more involvement by giving
them the choice of investing part of their pension saving, namely the premium pension (Barr, 2013).
The new national retirement pension gives every tax-paying worker in Sweden the right to a pension (Pensionsmyndigheten, 2018a). The system is built with an earnings-related structure and the rate of contribution is 18.5% of each workers’ annual salary (Sundén, 2006). From these 18.5%, 16% percentage points will contribute to the main part of the national retirement pension, namely the income pension. The income pension is a notional defined benefit plan, which gives each worker the right to a predetermined pension based solely on their annual earnings (Hagen, 2017). The income pension works as a pay-as-you-go system, where each worker has an individual notional account with a defined contribution. The amount of the individual accounts is based on a defined contribution rate that is applied to the individuals’ earnings from work. The value of the account symbolises an entitlement on a future pension income (Palmer, 2000). The remaining 2.5% percentage points contributes to the premium pension which is a defined contribution system (Hagen, 2017). Previously, all parts in the pension system were based on a pay-as-you-go system, but this changed with the new national pension system. The changes were implemented in order to ensure financial stability and to provide adequate pension income for all inhabitants. Today, the pension system is based on a notional defined contribution and defined contribution plan with a pay-as-you-go structure along with funded individual accounts (Sundén, 2006).
The premium pension is not solely based on each workers’ annual income but also from the development of the financial market (Engström and Westerberg, 2003). Although the premium pension only has a minor contribution to the national retirement pension, this is the only part that is controlled by the individual (Pensionsmyndigheten, 2018h). The participants can actively determine how to invest their premium pension based on a broad selection of domestic and international funds (Palme, Sundén and Söderlind, 2007). The selectable funds include equity funds, interest-bearing funds, mixed funds, and generational funds (Czech, 2016). From the available options, up to five funds can be selected to be a part of the participants’ retirement savings (Hedesström, Svedsäter and Gärling, 2007) and the pension saver has the possibility to change funds an unlimited number of times, free of charge (Czech, 2016). However, if the participant does not make an active fund selection, the government has established a default fund named the seventh AP fund, also referred to as AP7 Såfa (Palme, Sundén and Söderlind,
2007). By allowing individuals to select where their premium pension should be invested, a greater responsibility is put on the individual to plan for their retirement (Sundén, 2006).
With regard to passive and active investment strategies, which can occur in the premium pension system, Sharpe (1991) defines these strategies by stating that the return on the average active investment will equal the return on the average passive investment, prior to any costs. Additionally, the return on the average active investment will be lower than the return on the average passive investment, after costs. According to Sharpe (1991), the stated definitions will hold for any time period. Sharpe (1991) continues by defining a passive investor as one that holds every stock in the market, with each represented in a similar way as the market. In other words, a passive investor will hold the equivalent proportion of the total outstanding volume of each security in the market. On the other hand, an active investor is defined as one who is not passive. Sharpe (1991) continues by stating that the portfolio of an active and passive investor is different since active investors act on insights of mispricing, and since such insights regularly change, active investors are inclined to trade more often.
Supplemental to the national retirement pension there is the occupational pension and the private pension scheme (Pensionsmyndigheten, 2018i). The majority of the Swedish working population has an occupational pension, where the employer sets aside retirement savings for the employee. The occupational pension is determined upon settlements between the worker and the employer or by a collective agreement (Pensionsmyndigheten, 2018d). A worker in Sweden that receive both national retirement pension and occupational pension will approximately receive 60-75% of their taxable income in pension depending on the number of years they have worked, consequently, it can be favourable to also possess a private pension scheme (Pensionsmyndigheten, 2018e).
1.2 Problem description
Under the new premium pension scheme responsibility is shifted more towards individuals by encouraging them to take an active interest in where to invest their premium pension (Engström and Westerberg, 2003), meaning that individuals actively can select in which funds to allocate their premium pension (Pensionsmyndigheten, 2018h). When creating the premium pension system, the government wanted to offer the participants a broad number of funds, so all fund companies that have a licence to operate in Sweden can participate in the system (Sundén, 2006).
As of today, there are approximately 850 premium pension funds to select from when making an active investment (Morningstar, 2018). Subsequently, the participants are given the opportunity to achieve a higher return and to tailor parts of their pension according to their risk preference (Palme, Sundén and Söderlind, 2007).
However, many people lack both the knowledge and interest to make own investment decisions, which is why there is an alternative investment route to pursue for these people (Engström and Westerberg, 2003). The Seventh AP Fund has a generational design and is made up of two separate funds, “AP7 Aktiefond and AP7 Räntefond” (AP7, 2018b). The two AP7 funds can be chosen separately for participants that do not wish to finance their premium pension in a generational fund. “AP7 Aktiefond” is an equity fund with a higher level of risk and “AP7 Räntefond” is an interest-bearing fund for participants with a lower risk preference (Weaver and Willén, 2014). By investing in the Seventh AP Fund, the distribution between the equity fund and the interest-bearing fund is adjusted according to the age of the saver. Initially, the saver is exposed to more risk with higher potential return. The risk decreases over time as the distribution changes between the funds, meaning that lower-risk investments are made as the saver approaches retirement (AP7, 2018a). This adjustment of allocation between the funds, aims to solve the issue of pension savers that retire at the same time as the stock-market drops (Cobley, 2009).
In recent years, fewer people have actively selected and changed their premium pension funds, meaning that more savers remain in the predetermined fund, AP7 Såfa (Pensionsmyndigheten, 2015). In 2000 when pension savers were first offered to make an active investment in the premium pension, 67% of the participants made an active choice and only 33% were transferred into the default fund. Participants making an active choice has fallen steeply since then and the reason behind the distinct fall in involvement is according to Czech (2016) the rising number of fund alternatives. He argues that 850 funds to choose from is more discouraging than stimulating. Another argument is that the massive media campaign that introduced the premium pension, has faded away and consequently, so has people’s awareness (Czech, 2016). As for AP7 Såfa, at the end of 2017, the fund had been selected by approximately 3.7 million people, out of this only 400 000 had actively selected the fund. In other words, 3.3 million people passively ended up with holdings in the fund (Pensionsmyndigheten, 2018b). For additional number of fund selections see appendix 9.1.
According to Madrian and Shea (2001), people make passive investment decision as a result of uncertainty and lack of knowledge. In addition, Madrian and Shea (2001) state that individuals perceive the predetermined alternative, in this case AP7 Såfa, as an investment advice and therefore tend to pursue that advice by remaining in the specified fund. In some situations, people tend to follow the path of least resistance which means that they select the easiest thing to do, which in this case is to not make a choice at all. Additionally, people lean towards making passive investment decisions due to the reason that the benefits from an active decision are offset by the unintended transaction costs of collecting and assessing information on the available funds, therefore it is easier to not make an active choice (Madrian and Shea, 2001).
1.3 Purpose
The primary purpose of this report is to investigate whether the default fund alternative, i.e. AP7 Såfa, has had the superior risk-adjusted performance from 2007-2017 in comparison to fifty of the most selected equity funds available in the premium pension selection. The authors of this report will use risk-exposure and risk-adjusted measurements to compare the funds that are included in this study in order to draw conclusions. AP7’s equity fund is of interest to study, partly due to it being the default alternative, but also because the fund recently had a risk level that is 1.24 times higher than in an ordinary global equity fund.
Furthermore, this thesis will attempt to find up to five funds that should have been included in an active participants’ portfolio, using a rolling-window approach with eight formation periods between the years of 2007 and 2017. The authors of this report will construct an optimal tangency portfolio and a minimum variance portfolio in order to compare the risk-exposure and risk-adjusted return between a passive and active investor with different levels of risk-tolerance.
The research questions are stated as follows:
• Has AP7’s equity fund had the superior risk-adjusted performance compared to fifty of the most selected equity funds in the premium pension selection?
• How will an active investor with a constructed portfolio perform in comparison to a passive investor with holdings in the AP7 equity fund?
1.4 Delimitations
Limitations have been made to clearly focus on the stated research questions. Primarily, the authors have limited the scope of this study to the Swedish premium pension system. Consequently, no statements or conclusions will be made regarding the pension system in other countries. Furthermore, no statements or conclusions will be made regarding the entire Swedish national retirement system. This is also applied for the remaining parts of the Swedish pension system, no research will be made regarding the occupational pension of Swedish workers or with regards to private pension savings. These limitations do not indicate that the purpose of this study cannot be applied to other parts of the pension system, butsimply that it is not the objective of the authors.
Additionally, the authors are aware of the changes that AP7 underwent in 2010. Previously, there were two separate funds named “Sparfonden” and “Valfonden” that had a different arrangement than the funds that are available today. The authors of this thesis have obtained the net asset values for the years 2007 to 2010 through contact with an employee at AP7 Såfa. These net asset values have been used as supplemental to the existing AP7 Equity fund’s net asset values. Although the fund has undergone changes, this was a requirement in order to analyse the years 2007 to 2010, which are of interest partly due to the financial crisis.
Furthermore, the authors of this study have calculated the implicit returns for every fund included in this report. The reasoning behind the choice to calculate implicit returns instead of the explicit returns is due to the fact that every fund included in the study charge different fees that have been altered throughout the years. Consequently, there were difficulties for the authors to find these fees dating back to 2007. For this reason, implicit returns have been calculated which consequently will make the outcome of this study more accurate given that the authors could not access the necessary data.
Moreover, a limitation has been made regarding the age of the participants in the premium pension selection. The authors have limited the scope of participants to those between the age
of 20 to 55. By including this limitation, the authors can narrow the scope of AP7 Såfa merely to AP7’s equity fund, since 100% is invested in the equity fund until the participants reach 55 years of age (Pensionsmyndigheten, 2018c). Consequently, the scope of this study will be limited to only equity funds and no consideration or conclusions will be made in regard to interest-bearing funds, mixed funds, or generational funds.
The last limitation of this study has been made concerning the number of equity funds to investigate in addition to the AP7 equity fund. The authors have restricted the number of equity funds available in the premium pension selection to the fifty most actively selected funds that have been available prior to 2007.
1.5 Definitions
• Swedish pension authority - Svenska Pensionsmyndigheten
The pension authority is a Swedish government that has the full responsibility over the national retirement pension.
• National retirement pension - Allmän pension
Every Swedish Citizen that works or lives in Sweden has the right to a national retirement Pension. The pension is grounded on all tax-based income.
• Premium pension- Premiepension
The premium pension is a part of the national retirement pension. 2.5 % of the tax-based income is each year set aside to each citizen’s premium pension. Each citizen has then the right to place the money in 1 to 5 fund selections or leave them in the pre-determined fund selection, AP7 Såfa.
• Occupational pension - Tjänstepension
The occupational pension originates from working. The occupational pension is determined upon agreements, either between the worker and employer or by a collective agreement
• Private pension scheme - Privat pension
A private pension scheme means that each citizen sets aside money for their own retirement. This pension is a tool for citizens who prefer a higher pension income and it is not mandatory.
• Equity fund – Aktiefond
An equity fund contains of equities, meaning that the fund holds shares for several companies. The value of the fund is based on the development of each company. Subsequently, the fluctuations of the stock market often imply a higher risk, but with the possibility of a higher return.
• Interest-bearing fund – Räntefond
An interest-bearing fund contains of interest-bearing securities often issued by the government or by a municipality in order to borrow money. Interest-bearing funds generally has a stable value change, consequently, the fund have a low risk and usually implies a lower return.
• Generational fund – Generationsfond
A generational fund contains both equities and interest-bearing securities. The distribution between the securities is adjusted according to each citizen’s age in order to take on a lower risk closer to retirement.
2. Theoretical Framework
2.1 Premium Pension Funds in Sweden
A fund is a collection of financial securities with ownership to the investor who possesses holdings in the fund. The purpose of having fund savings is to get an easy access to a portfolio of financial securities that possibly can implicate an increase in value. The funds available in the premium pension selection have requirements regarding the distribution of the funds risk through diversification, by containing a number of different financial securities. The holdings of the fund are determined by the fund’s manager, but it has to be within the specified requirements (Pensionsmyndigheten, 2018g). In order for a fund to be accessible in the premium pension selection, the fund must be approved by the Swedish pension authority and the fund’s manager must have a certification of operating in fund trading activities. The fund manager also needs to have a cooperation agreement with the Swedish pension authority and has to release specified information at requests. Furthermore, managers also need to undertake the requirements of not charging any withdrawal fees or other fees that has not been permitted by the agency (Riksdagen, 2018a).
The premium pension selection has different sorts of funds available, namely equity funds, interest-bearing funds, mixed funds, and generational funds. The motivation for using diverse funds is to make it easier for the investors to separate them and to be able to make comparisons. What kind of category the fund belongs to depends on what combination of financial securities the fund invests in (Pensionsmyndigheten, 2018g). There are two main types of funds, equity funds and interest-bearing funds. Interest-bearing funds only hold assets in debt securities and generally have a lower risk than equity funds. Equity funds, that is the most common fund alternative among Swedish investors and that will be the focus of this report, holds assets that are traded on the stock market (Avanza, 2018). Consequently, the fund will result in ownership of several companies. An equity fund contains ownership of at least 16 different companies, usually more, meaning that the risk will be diversified and not dependent on a single company (Pensionsmyndigheten, 2018g). An equity fund is therefore determined by the fluctuations on the stock market. Factors that may affect the degree of risk that the fund is exposed to are dependent on whether the fund manager invests in equities in Sweden or abroad, and in a stable or unstable market. An equity fund that is invested in markets and industries that has a high
degree of fluctuations due to the world economy and currency movements, will ultimately result in a higher degree of risk (Avanza, 2018).
AP7’s equity fund functions as a normal equity fund but has particular directions from the Swedish pension authority. The fund cannot acquire more shares in a single company to the extent that it exceeds five percent of the total voting rights for all shares. The assets managed by the Seventh AP equity fund shall be divided into fund units and all fund units must be equal within the fund. The fund manager must also calculate the fund value every day and inform the pension authority about the value (Riksdagen, 2018b).
2.2 Risk-Return Trade-Off
In financial markets, the performance of monetary properties are measured by well-known mathematical models of risk and return. These statistical measurements are central to the finance community due to the reason that it enables the comparison of performance of various asset classes, thereby simplifying the selection of investment strategies (Higgins, 2015).
The financial concept, known as the risk-return trade-off, states that the return an investment will yield should increase as the risk associated with that investment increases. The risk-return trade-off is an important factor that affects the decision taken by the investor (Aslanidis, Christiansen and Savva, 2016). Investors have different levels of risk tolerance, meaning that some investors are willing to take on a low risk investment that can yield a potentially lower return whereas others are willing to take on higher risk that can yield a greater potential return. Subsequently, some investors are risk-averse whereas some are risk-takers. The level of risk tolerance can be affected by years to retirement, gender, and education (Bollen and Posavac, 2018). Furthermore, it is important to recognize that higher risk does not necessary imply a higher potential return. The risk-return trade-off only indicates that there is a relationship between a higher risk level and the likelihood of greater returns, however, higher risk can also cause problematic situations associated with major losses on an investment due to changes in the economic conditions (Aslanidis, Christiansen and Savva, 2016).
The risk-return trade-off is central to the field of finance, thereby making it an important tool for investors to use when assessing what level of risk they are willing to retain when making an
investment. Moreover, it can be useful for investors to understand how risk and return are correlated in order to make a good investment decision (Lundblad, 2007).
2.3 Financial Theory
2.3.1 Single Index Model
The single-index model was introduced to the field of finance by William Sharpe (1963) and is an asset pricing model that measures both the risk and the return of a stock. According to the single-index model, the systematic risk that affects the returns of the stocks is caused by only one macroeconomic factor and that this factor can be characterized by the rate of return on an index, for example the S&P 500. This assumption has been made in order to make the analysing process easier (Sharpe, 1963). Furthermore, the model is based on the following assumptions (Sharpe, 2000):
• Nearly all stocks have a positive covariance, due to their similar response to macroeconomic factors.
• There are firms that are extra sensitive to macroeconomic factors and this firm-specific difference is usually symbolised by its beta.
• The covariance between stocks arise from different responses to macroeconomic factors. As a result, the covariance of the individual stock can be calculated by multiplying the beta of the stock with the market variance.
The single-index model equation, i.e. the mathematical expression, is stated as:
𝑟𝑠− 𝑟𝑓 = 𝛼 + 𝛽 (𝑟𝑚− 𝑟𝑓) + 𝜀
Where, 𝑟𝑠 represents the return of the stock and 𝑟𝑓 is the risk-free rate, 𝛼 symbolises the stocks abnormal return, 𝛽 represents the stocks sensitivity to the market return, 𝑟𝑚 is the market portfolio return and 𝜀 represents the residual returns of the stock which is caused by firm-specific factors. The single-index model was developed to simplify the portfolio analysis and to make the process of analysing the relationship amongst securities easier, today the model is widely used in the finance industry.
2.3.2 Modern portfolio theory
The modern portfolio theory was introduced by Harry Markowitz (1952) and is a commonly used financial theory. Markowitz highlighted the importance of utilizing diversification and its effects on the portfolio to increase risk-adjusted returns. Markowitz emphasized that investors could through diversification reduce the risk, by allocating the holdings in different asset types, such as in different companies and industries. Risk is measured as the standard deviation and through risk spreading, investors can exploit the relationship between risk and return thereby improving their investment selections to maximize returns given a certain level of risk. Stated differently, it is significant to analyse how the selected assets in a portfolio relate to each other in terms of risk and return.
Markowitz theory is essentially built around the basis of two assumptions. Firstly, all investors are rational in their investment decision making. Secondly, all investors want to achieve the greatest return as possible given the lowest risk. In other words, investors are risk-averse, i.e. they want to avoid risk. Given two investment opportunities that yield the same return, the investor would choose the alternative with the lowest risk as there is no reason for the investor to choose the high-risk option given these assumptions.
The Modern Portfolio Theory contains several risk-measurements and risk-adjusted performance measurements, such as variance and standard deviation as well as Treynor ratio and Sharpe ratio.
2.3.2.1 Variance
The variance is a frequently used measure of dispersion, known as the squared expected deviation from the mean. The variance formula is stated as:
𝑉𝑎𝑟(𝑅) = 1
𝑇 − 1∑ (𝑅𝑡− 𝑅̅)
2 𝑇
𝑡=1
Where 𝑅𝑡 expresses the rate of return, 𝑅̅ is the average rate of return and 𝑇 denotes the number of assets (Berk and DeMarzo, 2014). In general, when calculating the variance, the mean rate of return is needed. However, the mean rate of return typically is an unknown factor and as a
2.3.2.2 Standard Deviation
The standard deviation, frequently referred to as the volatility, is calculated as the square root of the variance. The standard deviation is used to calculate the degree of dispersion when using a set of data. A low standard deviation specify that the data points are near the mean whereas a higher standard deviation express that the data points are further from the mean, resulting in a higher deviation. The standard deviation formula is expressed as (Berk and DeMarzo, 2014):
𝑆𝐷 (𝑅) = √𝑉𝑎𝑟(𝑅)
2.3.2.3 Treynor Ratio and Beta
The Treynor ratio, developed by Jack Treynor (1965), is a measure that exploits the correlation amongst annualized risk-adjusted return and risk in order to measure efficiency. In other words, the ratio tries to quantify to what extent an investment has compensated the investors given the degree of risk. The Treynor ratio is dependent on beta, which is a measurement of a stock's sensitivity to market fluctuations. The principle idea of the Treynor ratio is that systematic risk, i.e. risk that is central to the whole market, must be penalized due to the fact that it cannot be reduced through diversification.
The Beta formula is expressed as: 𝛽𝑖 = 𝑐𝑜𝑣 (𝑅𝑖,𝑅𝑚)
𝜎2(𝑅
𝑚) , where𝑅𝑖 denotes the return of the asset
and 𝑅𝑚 the return of the market (Hübner, 2005). A Beta equal to one indicates that the price of
an asset moves with the market, whereas a Beta lower than one signifies that the asset theoretically is less volatile than the market and a Beta greater than one means that the asset theoretically is more volatile in comparison to the market. The Treynor ratio can be calculated as: 𝑇 = 𝑟𝑖− 𝑟𝑓
𝛽𝑖 , where 𝑟𝑖 represents the return of portfolio i, 𝑟𝑓 is the risk-free rate and 𝛽𝑖 denotes
the portfolio beta (Hodges, Taylor and Yoder, 2003).
2.3.2.4 Sharpe Ratio
The Sharpe ratio, developed by William Sharpe (1966), measures the excess rate of return of a given asset and adjusts for risk. There are similarities between the Sharpe ratio and the Treynor ratio, but instead of using the beta factor, Sharpe ratio uses standard deviation. A higher value of the Sharpe ratio indicates that the security has superior performance, concluding in a greater
risk-adjusted portfolio with a higher rate of return for every unit of risk (Sharpe, 1966). The Sharpe ratio is defined as (Berk and DeMarzo, 2014):
𝑆ℎ𝑎𝑟𝑝𝑒 𝑟𝑎𝑡𝑖𝑜 = 𝐸[𝑅𝑝] − 𝑟𝑓 𝑆𝐷(𝑅𝑝)
Where the 𝐸[𝑅𝑝] is the expected portfolio return, 𝑟𝑓 denotes the risk-free rate and 𝑆𝐷(𝑅𝑝)
symbolises the standard deviation of the portfolio.
2.3.3 Post-Modern portfolio theory
The Post-modern Portfolio Theory is a further development of the well-known Modern Portfolio Theory. The basis for both theories is to explain how investors ought to use diversification to enhance their portfolios and how to price risky assets. In the early days, the Modern Portfolio Theory reformed the decision-making process of making investments within the field of finance by describing risk associated to investments and thus introducing a risk-return framework. The limitations of the Modern Portfolio Theory, such as assuming that variance is the correct risk measure and referring to all returns as normally distributed, steered the model to addressing all uncertainties the same. As a response to the inadequacies of the Modern Portfolio Theory, and the fact that the model penalizes both upside and downside deviation similarly, the creation of a new investment decision-making framework that would overcome the limitations of the Modern Portfolio Theory started. Today, this model is known as, The Post-modern Portfolio Theory (Rom and Ferguson, 1993).
2.3.3.1 Sortino Ratio
The Sortino ratio differentiates itself from the Sharpe ratio by measuring the risk-adjusted return of an asset, or portfolio, using the target rate of return. Although both ratios quantity an assets risk-adjusted return, the way of calculating is significantly different. The Sortino ratio use the so-called downside risk in the denominator, as a substitute for the standard deviation, meaning that the ratio only penalizes the return below the target rate of return (Sortino, 2010).
𝑆𝑜𝑟𝑡 = 𝑅𝑖 − 𝑅𝑚𝑎𝑟
δ
Where 𝑅𝑖 signifies the rate of return, 𝑅𝑚𝑎𝑟 denotes the minimal acceptable rate of return and 𝛿 symbolizes the downside deviation.
2.3.4 Capital Asset Pricing Model
A central question in the field of finance is how the risk affects the expected return of an asset. The first consistent framework that answered this question, was the Capital Asset Pricing Model (CAPM). The model was presented in the early 1960s by William Sharpe (1964), John Lintner (1965a and 1965b) and Jan Mossin (1966). The CAPM is built upon the notion that not all risks have an impact on asset prices. Particularly, a risk that is diversified away when united in a portfolio with other investments is, roughly considered, not a risk of any kind. The CAPM is an advancement of Markowitz’s (1952) portfolio theory which is founded by the concept that specific risk can be disregarded with diversification, on the other hand, systematic risk can only be reduced and not removed. Furthermore, the CAPM provides us with understandings about what type of risks that is correlated to return.
The Capital Asset Pricing Model is based on four assumptions:
• Investors are risk averse and assess their investment portfolios only in the matter of expected return and standard deviation of return.
• Capital markets are perfect: all assets are endlessly divisible; transactions costs, short selling restrictions and taxes are non-existent; information is free and accessible by everyone; and investors can borrow and lend at the risk-free rate.
• All investors have the equivalent investment opportunities.
• Investors make similar estimations of expected returns, standard deviations of return and correlation concerning individual assets.
The assumptions above characterise a remarkably simple and faultless world, however, they are needed for the CAPM to be functional. Under the stated assumptions, every investor will determine a matching portfolio of risky assets with the highest Sharpe Ratio. Given their degree of risk tolerance, every investor will assign a part of their wealth to this collection of assets,
known as the optimal portfolio, and the rest to risk-free borrowing or lending. In order to guarantee that the market is in equilibrium, the price, i.e. expected return, of every individual asset must be such that investors cooperatively agree to hold precisely the supply of the asset. If all investors hold the equivalent amount of risky assets, that amount must be equal to the amount of risky assets that are held in the market portfolio, which is the portfolio containing all existing shares of each risky asset. When in equilibrium, consequently, the portfolio of risky assets that have the highest Sharpe Ratio has to be the market portfolio.
The risk premium of every asset has the obligation to satisfy the condition of, 𝐸 (𝑅𝑖) − 𝑅𝑓 = 𝛽𝑖 (𝐸(𝑅𝑚) − 𝑅𝑓), where 𝐸 (𝑅𝑖) is the expected return of the asset, 𝑅𝑓 is the risk-free rate and
(𝐸(𝑅𝑚) characterise the expected excess return of the market portfolio and when deducting the risk-free rate from this, the equity risk premium is derived. The variable 𝛽𝑖 stand for the Beta of the asset which represents the volatility of the given asset. The expected return of an asset is derived by 𝐸 (𝑅𝑖) = 𝑅𝑓+ 𝛽𝑖 (𝐸(𝑅𝑚) − 𝑅𝑓).
2.3.4.1 Alpha
Alpha, also known as Jensen’s Performance Index or Jensen’s alpha, was developed by Michael Jensen (1968), and is used to determine the excess return of an individual security, or a portfolio of securities, in comparison to the returns proposed by the Capital Asset Pricing Model (CAPM). The securities can be any assets, for instance stocks, bonds, or derivatives. When measuring the value of the excess return, the outcome can be positive, negative, or zero. When a security is fairly priced, the actual return of that security will be equal to what the CAPM suggests, i.e. the alpha will be zero. The reasoning behind this is that the CAPM considers the risk of the security and measures the adjusted returns and if the security does not earn more than the risk-adjusted returns the outcome of the two measures will be equal. In contrast, the security, or portfolio of securities, will have a positive alpha if it receives more than the risk-adjusted return. A positive, or higher, alpha is continuously looked-for by managers since a negative alpha implies that the return of the portfolio is less than the required return. Jensen’s alpha is symbolised by α𝐽 and is mathematically expressed as:
Where, 𝑅𝑝 is the return of the portfolio, 𝑅𝑓 signifies the risk-free rate, 𝛽 denotes the stock’s beta and 𝑅𝑚 is the market return. Jensen’s alpha is stated in percentage form, signifying the fraction by which the collection of securities, or a single security, has either underperformed or over-performed in contrast to the market.
2.3.5 Efficient Portfolio Construction
The Modern Portfolio Theory, presented by Harry Markowitz (1952), introduced the concept of having an efficient portfolio, which is a process that allows the investor to find the portfolio that yields the highest expected return for a certain level of risk, or the minimum risk for a given return. The portfolios that satisfy the requirements of an efficient portfolio are located on what is referred to as the efficient frontier, which is the assembly point of optimal portfolios that offers the maximum expected return for a given level of variance (or volatility) or the lowest risk for a defined level of return. According to Markowitz (1952), the portfolios that are not on the efficient frontier are insufficient, as they do not offer the required return for the given level of risk, or they yield a higher risk for the given level of return
2.3.5.1 Global Minimum Variance Portfolio
The global minimum variance portfolio (GMV) is a low-risk investment strategy. The portfolio lies on the efficient frontier, below the capital market line (Bodnar, Mazur and Podgoriski, 2016). Among the optimal mean-variance portfolios, GMV is the portfolio that has the lowest variance. The GMV portfolio has the solution to the following optimization problem (Bodnar, Parolya and Schmid, 2018):
𝑤′Σ𝑛𝑤 → 𝑚𝑖𝑛, 𝑠𝑢𝑏𝑗𝑒𝑐𝑡 𝑡𝑜 𝑤′1 = 1
Where w = (w1…., wp)’ stands for the vector of portfolio weights, 1 is an appropriate vector of ones, and Σ𝑛denotes the covariance matrix of the asset returns. The solution of the optimization formula is given by (Bodnar, Parolya and Schmid 2018):
𝑊𝐺𝑀𝑉 =
Σ𝑛−11
1′Σ 𝑛 −11
2.3.5.2 Optimal Tangency Portfolio
The optimal tangency portfolio is the portfolio that has the highest Sharpe ratio. This portfolio can be found on the efficient frontier, where the capital market line and the efficient frontier intercepts and offers the highest return per unit of risk. Stated differently, it is the portfolio that gives the investor the optimal risk-return trade-off. The optimal tangency portfolio does not only consist of the securities with the highest expected return or the ones with the lowest risk. Instead, this portfolio intends to balance securities with the highest possible returns with an appropriate level of risk or securities with the lowest level of risk for a certain level of potential return (Berk and DeMarzo, 2014).
In order to find the optimal portfolio, the expected return and the variance of the portfolio must be calculated. The portfolio expected return is calculated as (Berk and DeMarzo, 2014):
𝐸 (𝑅𝑃) = 𝑤1𝐸 (𝑅1) + 𝑤2𝐸(𝑅2)+ . . . + 𝑤𝑛𝐸(𝑅𝑛)
Where, 𝑤1𝐸 (𝑅1) symbolizes the weight for security 1 multiplied with the expected return of
that security and 𝑤2𝐸(𝑅2) represent the weight for security 2 multiplied with the expected return for that portfolio. Furthermore, the portfolio variance is calculated as (Berk and DeMarzo, 2014): 𝜎𝑝2 = ∑ 𝑤𝑖2𝜎𝑖2+ 𝑛 𝑖=1 ∑ ∑ 𝑤𝑖𝑤𝑗𝑐𝑜𝑣𝑖𝑗 𝑛 𝑗=1 𝑖≠𝑗 𝑛 𝑖=1 Where, 𝑤𝑖2𝜎
𝑖2 represents the squared weight of security i multiplied with the variance of that
security, and 𝑤𝑖𝑤𝑗𝑐𝑜𝑣𝑖𝑗 is the covariance between the securities included in the portfolio. Moreover, the portfolio standard deviation is needed which can be found by taking the square root of the portfolio variance. Additionally, the Sharpe ratio is required to find the optimal tangency portfolio. The portfolio Sharpe ratio formula is stated as (Berk and DeMarzo, 2014):
𝑆ℎ𝑎𝑟𝑝𝑒 𝑟𝑎𝑡𝑖𝑜𝑃 = 𝐸(𝑅𝑃)−𝑅𝑓
𝜎𝑃 , where, 𝐸(𝑅𝑃) is the expected portfolio return, 𝑅𝑓 signifies the
2.4 Previous Research
When searching for previous research within the field that this thesis focuses on, the authors of this study cannot find another study with a similar purpose as this thesis. However, there are several studies focusing on fund and stock performance, pensions systems and investor behaviour regarding the pension system. The studies discuss why the involvement rate is decreasing regarding how many savers that participate in making an active choice and the performance of AP7 Såfa in comparison with other funds.
In a study made by Dahlquist, Martinez and Söderlind (2016) evidence is found that active investors make higher risk-adjusted returns and returns compared to inactive investors who remains in the predetermined fund, AP7. The findings are analysed from a sample of 100 000 premium pension savers daily portfolio changes over a 10-year period from 2000-2010. The results revealed that inactive investors, who contributed with 93.5% of the sample, earned average returns of 3.82% per year. Active investors that had made one up to nine portfolio changes during 2000-2010, equivalent to 5.8% of the sample, earned average returns of 6.68% per year. The investors with the highest activity, 0.6% of the sample, received an average return of 12.57% per year. The study produced similar results for the risk-adjusted returns, consequently showing that active investors did not take on a higher amount of risk. The authors found that a significant part of the highly active investors’ success was related to their propensity to invest in premium funds with recent good past performances, also known as the momentum effect.
In a report by Czech (2016), evidence is found that that the falling rate of involvement in the Swedish premium pension fund selection is a response to the growing number of funds available to the population. Czech (2016) states that the increasing number of investment funds has discouraged investors to actively make an investment decision, when there were only a few available funds to select from during the year of 2000, the percentage of people that made an active choice was as high as 67%. Later, due to the increasing number of funds, only 1.5% of newcomers made an active fund selection in 2011. Furthermore, the negative rate of return on capital has had an impact on the falling percentage of active choice makers. According to Czech (2016), 100 SEK invested in the system in 2000 was worth less than 60 SEK after two years. Although the market improved during the subsequent years, it fell again in 2008, due to the financial crisis. The results of these circumstances exposed that individual choice did not matter
compared to irresistible market forces, consequently people started to ask themselves why they should make a time-consuming investment decision if the result was negative anyway. Czech (2016) states that most pension savers are not interested in managing their accounts. During the years of 2000-2011, only 7% of pension savers made at least one change per year in their portfolio. The percentage of savers that did not bother to select a fund and thus automatically were transferred into AP7 Såfa, amounted to 51%.
Czech (2016) continues to argue that since only a small fraction of the people makes an active choice, Sweden must have a reliable and well-performing default alternative. According to Czech (2016), AP7 Såfa, had an average yield of 6.2% while an average pension fund had 4.8%, during the years of 1995-2013. Moreover, in 2013, these numbers increased significantly, AP7 Såfa’s average yield was 26.6% whereas the yield of an average pension fund was 16.7%. As stated by Czech (2016), the reason behind why the default alternative had such a positive outcome in comparison to other funds can be described by the fact that most of the fund’s holdings are made up of stocks, not only domestically but also globally. As a result, the default alternative can be more profitable but at the same time it is much riskier.
In another study made by Dahlquist and Martinez (2015), evidence is found that inattention to pension funds past performance among Swedish investors can be inefficient and costly. The findings were based on 263 equity funds covering a time series between October 2000 and July 2008. The authors created a portfolio containing funds with good performance in the past and received an average abnormal return of 6% per year. Contrary, the authors created a portfolio with past bad performance funds with an abnormal return of -2%. A significant difference that can cause a huge reduction in retirement capital. The authors reasoned that the main reason for investors in the premium pension selection to be so inattentive is due to the mandatory pension system. Since the system includes individuals which may have no interest in saving or investing for retirement.
Moreover, Madrian and Shea (2001) presents evidence that uncertainty has an impact on the investment decisions made by individuals. They claim that people tend to notice the pre-determined alternative as investment advice. Moreover, Choi et al. (2002) conclude that individuals often take the easy route, known as the path of least resistance, meaning that the easiest thing to do is nothing, which can be an explanation to why people tend to lean towards
why people tend to make passive investment decisions and it could be that it is time-consuming to form an understanding and to gather knowledge about how to invest your money.
3. Method
3.1 Choice of Method
This thesis undertakes a positivistic approach by assessing research findings that are observable and quantifiable. A positivistic approach will allow the authors of this thesis to analyse the findings in an objective manner, meaning that the authors are independent, and the results are based on facts. Moreover, the use of a positivistic research approach will address the purpose of this study in a manner that fits the vision of the authors, with hypothesis testing and the ambition to explain the findings of this thesis (Esterby-Smith, Thorpe & Jackson, 2015). Moreover, this thesis will apply a formal study using a quantitative research approach to measure if AP7’s equity fund in the premium pension selection has the greatest combination of risk and return. A quantitative methodology is commonly used when conducting a business research to assess information about consumer behaviour, experience and attitude (Cooper and Schindler, 2011). The quantitative research will be performed using numerical data, which essentially is deductive. With a deductive theory the research question will be tested using statistical measurements, the analysis will be applied, and conclusions will be drawn in order to answer the stated research question (Watson, 2015).
Additionally, a monitoring approach has been used when collecting data, meaning that the researchers have retrieved information about the chosen topic without attempting to obtain opinions from anyone. This type of data collection has been made with a longitudinal time dimension, since the authors of this report have tracked alterations of data over time. Subsequently, the researchers have no control over the data that has been used and therefore no manipulation has been made, which is known as an ex post facto design. In other words, the authors have only used statistical manipulation of what has happened with the data over the chosen time-horizon (Cooper and Schindler, 2011). The authors of this thesis have faith in that the use of a quantitative research method will give this study a more precise result, with an accurate study of the chosen subject and its problems.
3.2 Collection of Data
from relevant literature, peer-reviewed articles, and journals, but also from appropriate and trustworthy websites, such as the Swedish Pension Authority. In order to find high-quality articles and books, databases such as Primo and Google Scholar have been used. When conducting this thesis, the authors recognized several advantages of using secondary data. The use of secondary sources makes it possible to gather high-quality data over a longitudinal time-horizon during a short period of time (Bryman and Bell, 2011). Even though the use of secondary sources has limitations, such as biasness, lack-of-control and familiarity of the data, the sources have been used with confidence (Cooper and Schindler, 2011). The authors of this report have faith in that the sources used in this thesis have a high level of trustworthiness, since many reports and statistics that have been used are written in agreement with Swedish law. Even though this report is based on secondary sources, knowledge of the potential disadvantages has been deliberated. Consequently, every source is evaluated thoroughly by considering for what purpose the source is written, when the source was written and by who it was published (Cooper and Schindler, 2011).
Thomson Reuters DataStream is used as a source in this report to retrieve the majority of the financial information, such as monthly net asset values of the various equity funds that are included in this thesis. DataStream is a well-recognized provider of financial information and investment research around the world. Thus, the authors of this report believe that DataStream is a reliable source to use, as it fulfils the data-quality requirements such as data objectiveness, data representativeness, data completeness and data accuracy (Jesilevska, 2017). Since DataStream lacked information of each year’s monthly net asset values for some funds, additional sources have been used in order to retrieve the required data. The supplementary sources have been retrieved from banks and fund managers’ websites, namely AMF, Swedbank Robur, SEB and Lannebo Fonder. In order to retrieve the complementary returns of the predetermined fund, AP7, we had to request additional data from an employee at the seventh AP Fund who transferred the necessary data over email. The start-of-month net asset values for the AP7 fund is available in appendix 9.2.
When using sources from market participants such as AMF, Swedbank Robur, SEB and Lannebo Fonder, there may be a problem because secondary sources may be biased. But, the authors have used sources from market participants with carefulness and only after discussion and evaluation if the source is appropriate for this thesis. When retrieving information about the history of the Swedish pension system and the background, information published by, most
importantly, the Swedish Pension Authority has been essential. The information retrieved from the Swedish Pension Authority is believed to be relevant, trustworthy, and useful for this report. The authors of this study have confidence in that the use of different sources will help them grasp the chosen topic from different perspectives. In addition to improving the overall assessment of this thesis, the use of different sources ensures that this study is well-written and non-biased.
3.3 Research Design
3.3.1 Sampling
The funds in the Swedish pension premium system is used as the population of this research. Due to time constraint, a sample of 51 equity funds have been selected. The sample have been selected based on highest amount of fund selections and the time of operation. The funds included in the sample are the funds that have the highest selection rate and have been active for at least eleven years. The authors believe that the sample will give a good reflection of the Swedish premium pensions equity funds due to the high level of market share that the selected funds possess. The authors are aware that smaller funds may outperform AP7’s equity fund, but with regard to the time constraint of this thesis, a sample had to be selected since all funds available in the premium pension cannot be included. See appendix 9.1 for the funds included in this study.
The sample period includes monthly net asset values from 2007-01-01 until 2017-12-01, representing a period of eleven years. In order to use monthly net asset values, calculations of the funds return and fluctuations during the eleven-year period can be made. The underlying reason behind why a time-horizon of eleven years was chosen is due to time constraints and inaccessibility of data for several equity funds. Subsequently, the chosen time-period made it possible to include the majority of the most selected equity funds available in the selection. Another interesting aspect of the sample period is that it included a time of a financial crisis, giving the opportunity to see how the analysed funds performs in a time of financial distress.
3.3.2 Calculations, Assumptions and Benchmarks
The measurements of exposure, presented in sections 2.3.2.1 to 2.3.4.1 and the risk-adjusted performance measures presented in sections 2.3.2.3, 2.3.2.4 and 2.3.3.1 have been fundamental to this report. The foundation of this report is built upon the presented models in these sections and the analysis is based on the equations derived from these models. The Modern Portfolio Theory, Post-Modern Portfolio Theory, the Single Index Model, and the Capital Asset Pricing Model have been central in order to analyze the retrieved data, particularly the risk-exposure measurements, such as Standard deviation and Beta, and risk-adjusted measurements, mainly Sharpe Ratio, Sortino Ratio, and Treynor Ratio. The analysis is built on numerous measurements that quantify the intended portfolio characteristic, such as risk, giving the authors a broad understanding of how to analyze the outcome of the calculations.
Additionally, a rolling-window approach has been used in this thesis when solving for the minimum variance portfolio and the optimal tangency. The rolling-window contains a total of eight formation periods, where each period includes four years. The first formation period covers the years 2007-2010 and by moving one-year ahead during the calculations, the subsequent holding period cover the years 2008-2011, 2009-2012, 2010-2013, 2011-2014, 2012-2015, 2013-2016 and 2014-2017. The authors of this thesis are confident that the use of a rolling-window will be a beneficial approach that levels out short-term variations and make long-lasting trends more apparent.
As previously mentioned, Thomson Reuters DataStream has been used as the main source of financial information, in the form of monthly net asset values. For several funds complementation’s has been made from banks and fund managers websites. The supplementary sources have been stated in daily net asset values and not in monthly terms. These net asset values have been manually transformed into start-of-the-month net asset values, in order to match the data retrieved from DataStream. This transformation has been made in order to have the same amount of observations across the sample when performing the assessments and regression analysis. The sample of monthly net asset values has thereafter been converted into index values in order to compute the rate of return. In order to calculate the monthly rate of return, continuous compounding has been used.
As a benchmark, the MSCI World Index has been selected. The MSCI World Index is an extensive worldwide equity benchmark that denotes large and mid-cap equity performance across 23 established market countries (MSCI, 2018). According to the authors, this index will perform as a suitable benchmark for the purpose of this thesis, since the majority of the funds possess holding in international equities. Arguments for this selection is mainly the fact that MSCI World Index is a representation of a fluctuating equity market and that this study focuses on assets traded on the stock market. Subsequently, the performance of the equity funds studied in this thesis is determined by the fluctuations on the stock market. For this reason, the MSCI World Index will be the benchmark the risk-adjusted performance of the Swedish equity funds in the premium pension are compared to.
The risk-free rate used in the calculations is a 10-year Swedish government bond note. The authors consider this to be a suitable benchmark since government bond yields frequently are used as a representation for risk-free rates. The risk-free rates for the period 2007-2017 are available in appendix 9.3 (Riksdagen, 2018c). The minimal acceptable rate of return, 𝑅𝑚𝑎𝑟 , used in the calculations of the Sortino ratio is the annual Swedish inflation target of 2.00% (Riksdagen, 2018d). The argument for this benchmark is that the investors within the Swedish premium pension system at least want to be reimbursed with the money they invest. Setting the minimum acceptable rate of return to the Swedish inflation target, fulfills the assumption of not losing the investment put in due to the macroeconomic environment.
3.4 Hypothesis Testing
Hypothesis testing is a method resulting from statistical inference, with the purpose of drawing conclusions using a set of rules. Hypothesis testing is used to decide whether the probability of a given statement, or hypothesis, is true by creating a constant decision-making principle. The method of hypothesis testing involves a number of phases. First, the null hypothesis must be formulated, then the test statistics and significance level need to be selected and to conclude, the computed value must be compared with the designated significance level (Pereira and Leslie, 2009).
This report will test whether the corresponding yearly alpha for each fund, from 2007 to 2017, is significant using a two-tailed hypothesis test. Contrary to a one-tailed test, which only allows
the alternative hypothesis to be either greater or lower than that of the null hypothesis, a two-tailed test allows the value of the alternative hypothesis to be both (Pereira and Leslie, 2009). The two-tailed hypothesis test, in this report, will be based on a t-test of which the test statistic is calculated as (Anderson, Sweeney, Williams, Freeman, and Shoesmith, 2010):
𝑡 = 𝑥̅ − 𝜇0 𝑠/√𝑛
Where, 𝑥 ̅ is the sample mean, 𝜇0 represents the mean of the hypothesized population and 𝑠/√𝑛 signifies the standard error. The hypothesis testing in this report will use a significance level of 1.96 with an alpha equal to 5% (0.05) and the decision to reject or not reject the null hypothesis will be tested using the t-stat corresponding to each fund for every year. The hypotheses that will be tested are stated as:
𝐻0 = −1.96 > 𝛼 > 1.96 𝐻1: − 1.96 < 𝛼 < 1.96
3.5 Critical assessment
To begin with, the authors would like to draw attention to the inadequacies of Microsoft Excel. Throughout this thesis, Excel and the Solver add-in contained in the program, has been used extensively. The authors have experienced difficulties when using the mentioned software, particularly the Solver function in order to find the efficient portfolios. As a result of the inability to create a constraint that would not allow the program to select more than five funds when using Solver, complications occurred, and new means of calculating had to be found. Instead of calculating the intended portfolios using a constraint that automatically selected up to five funds that should be included, the authors created an approximate solution by selecting up to five funds with the highest weights derived by Solver and re-scaling the weights of these funds so that the sum of the weights amounted to 100%. The authors have faith in that the approximate solution is nearly as good as the solution that would have been generated using a superior software than Excel. Regardless of the experienced shortcomings, the authors have used Excel with confidence and are certain that it has been beneficial to the calculations made in this report.
Regarding the financial theories used in this thesis and although the Capital Asset Pricing Model has been criticized for the models’ simplicity due to its unrealistic assumption that all markets are perfect, the authors have faith in that the model will be useful for the calculations that will be made in this thesis. The CAPM is a widely used and straightforward model that considers systematic risk which is disregarded by several other return models, therefore it should be included in this thesis. Furthermore, the Sharpe ratio has been criticized due to the reason that standard deviation is perceived as not a good enough measure to quantify risk. Sortino and Satchell (2001) states that standard deviation does not capture the entire risk and that measurements, such as downside risk, using semi-variance and minimum acceptable return (MAR) delivers a more precise measurement of risk. Sortino and Satchell (2001) carry on by emphasizing the problem with possibly misrepresentative results when using standard deviation as a measurement of risk. This is caused by both non-normally distributed returns and irregularity of risk from the investors’ standpoint, since the investors do not actually identify upside volatility as a risk. On the contrary, Sharpe ratio is one of the most commonly used risk-return ratio, and the authors have faith in that the advantages of this ratio outweigh the disadvantages, for that reason it has been used with confidence in this thesis.
With reference to the Treynor ratio, the retrospective feature of the measurement is a weakness that the authors have knowledge about. Investments are subject to the fluctuations of the stock market and therefore past results will change in the future. A stock that has generated a 5% return last year cannot be expected to produce the same result next year. However, in this thesis, the authors rely on past returns during the previous eleven years and therefore consider the Treynor ratio an appropriate and advantageous measurement.