The Study on the Development of Flood Forecasting and Warning
System in On-cheon Stream
Hyun Suk Shin1, Mi Eun Kim2, Young Su Jang, and Tae Seok Shon3
Department of Civil and Environmental Engineering, Pusan National University, Pusan 609-735, South Korea
Abstract. As prevention of disasters concerning flooding in coastal urban area, this study has developed the real time monitoring system aimed at the On-cheon stream in Busan. The basis of this study was a selection of various geological data based on the numerical map and computation of hydrologic GIS data. Thiessen polygon method was used to analyze rainfall on this site. And regression equation of 6th degree and Huff's Type Ⅱ was used for investigating time-distribution of rainfall. To estimate warning standard rainfall and flood discharge, risk depth was selected on Sebyeong bridge site. Flood depth and threshold runoff considering the effect of tidal water level was estimated for hydraulic analysis using HEC-RAS and urban flash flood rainfall were evaluated using PCSWMM 2002. Consequently, this study estimated warning standard of rainfall and flood discharge using ArcView GIS, HEC-RAS and SWMM on the study area. And real time monitoring system developed is to study various cases on a variety of basins to reduce natural disasters
induced by flood in coastal urban area.
1. Introduction
For increasing imperviousness and decreasing roughness coefficient by urbanization and industrialization, peak discharge has increased and concentration time has decreased. As a result, flood damage in urban area was occurred by flash flood. In this study, a method us-ing SWMM model estimated standard rainfall over the flash flood. And then real time monitoring system was installed at Sebyeong bridge site at where is flash flood hazard zone.
2. Methods
2.1. Construction of Topological Data
This study selected the optimal site for protecting citizen through installing real time moni-toring system in coastal urban area. For selecting study site, there were several reasons for this. The site is overpopulated area and is easy to maintain. And the site is higher
1 Civil Engineering Division
Civil and Environmental Engineering Department Pusan National University, Busan
Tel: (82)51-510-2348 e-mail: hsshin@pusan.ac.kr
2 Civil and Environmental Engineering Department
Pusan National University, Busan Tel: (82)51-510-3288
Shin, Kim, Jang, Shon
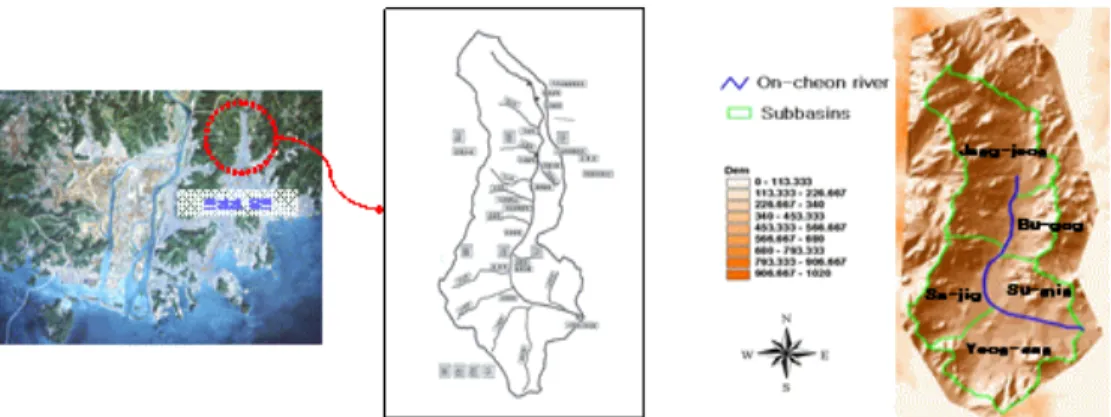
tion levels and has completed river maintenance and rainwater management system. For this reason, the site selected On-cheon stream in Busan for monitoring site.
Fig. 1. State of the Watershed of On-cheon Stream and Dividing its Watershed
Fig. 2. A view on Sebyeong bridge site 2.2. Modeling
For calculating flood level and critical discharge, hydraulic model was developed using HEC-RAS model and SWMM model for implementing hydrologic model. This study es-timated peak flow with rainfall and basin characteristics and duration time.
2.3. Estimation of standard rainfall
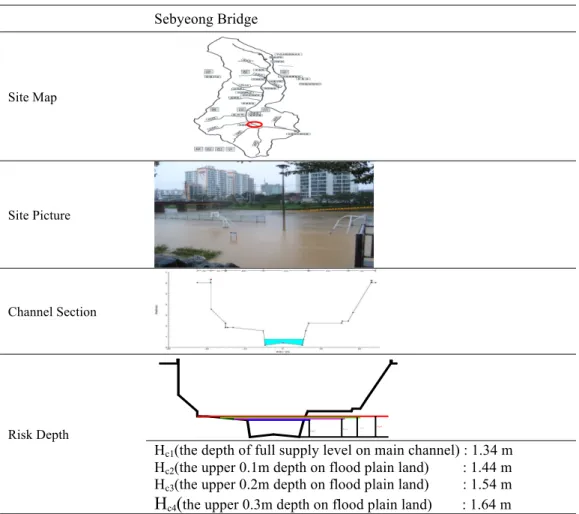
This study estimated the standard of duration time from 10 to 120 minutes for calculating standard rainfall of flash flood in the site. Risk depth defined overflow over flood plain land. The risk depth was shown in table 1.
Fig. 3. SWMM Modeling Mimetic Diagram
Table 1. Risk Depth of Sebyeong Bridge site (Hc)
Sebyeong Bridge
Site Map
Site Picture
Channel Section
Risk Depth Hc1 Hc2 Hc3 Hc4
Hc1(the depth of full supply level on main channel) : 1.34 m
Hc2(the upper 0.1m depth on flood plain land) : 1.44 m
Hc3(the upper 0.2m depth on flood plain land) : 1.54 m
Shin, Kim, Jang, Shon
Table 2. Threshold Runoff of Sebyeong Brigde site (Qc)
Rating Curve Regression Curve
Hc1=1.34m 18.043cms 17.847
Hc2=1.44m 20.263cms 21.235
Hc3=1.54m 22.894cms 25.006
Hc4=1.64m 25.526cms 29.180
Regression Curve ⇒ (a=0.542512, b=0.362031) R2=0.996
Huff's method was used for decision of time distribution by duration time using the report of Analysis of Temporal Variations for Determining the Local Design Storms from Korea institute of construction technology (1993). Therefore 10, 20, 30, 40, 50, 60, 120 minutes rainfall duration over 5, 10, 15, 20, 25, 30, 35, 40, 45, 50, 100 mm distributed in 1 minute increments with Huff method and probability rainfall calculated using continuous hourly rainfall data.
3. Results
3.1. Estimation of warning standard rainfall and flood discharge
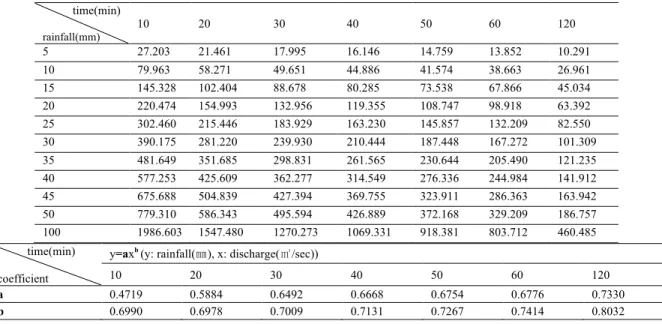
In this study, peak flow induced by rainfall and duration time was calculated for hydrolog-ical simulation using continuous hourly rainfall data. A correlation between rainfall and discharge was shown as table 3 and correlation curve of duration-effective rainfall-discharge were in fig. 4.
Table 3. Peak flood of Sebyeong bridge by rainfall and duration (unit: ㎥/sec)
time(min) rainfall(mm) 10 20 30 40 50 60 120 5 27.203 21.461 17.995 16.146 14.759 13.852 10.291 10 79.963 58.271 49.651 44.886 41.574 38.663 26.961 15 145.328 102.404 88.678 80.285 73.538 67.866 45.034 20 220.474 154.993 132.956 119.355 108.747 98.918 63.392 25 302.460 215.446 183.929 163.230 145.857 132.209 82.550 30 390.175 281.220 239.930 210.444 187.448 167.272 101.309 35 481.649 351.685 298.831 261.565 230.644 205.490 121.235 40 577.253 425.609 362.277 314.549 276.336 244.984 141.912 45 675.688 504.839 427.394 369.755 323.911 286.363 163.942 50 779.310 586.343 495.594 426.889 372.168 329.209 186.757 100 1986.603 1547.480 1270.273 1069.331 918.381 803.712 460.485 time(min) coefficient
y=axb (y: rainfall(㎜), x: discharge(㎥/sec))
10 20 30 40 50 60 120
a 0.4719 0.5884 0.6492 0.6668 0.6754 0.6776 0.7330
Fig. 4. The correlation curve of duration-effective rainfall-discharge 3.2. Estimation of Risk Depth
This study determined critical discharge about risk depth and peak flow by duration time. For prevention of disasters concerning flash flood using real time monitoring site, warning stand-ard estimated using correlation between rainfall and discharge. Warning standstand-ard of 20 minutes duration was seen in table 4.
Table 4. A warning standard to the watershed of On-cheon stream (Duration of 20min)
Site Risk Level Rainfall intensity Standard Note
Sebyeong Bridge
Flood watch 4 mm/20min Rainfall at 20 minutes duration time when Risk depth H
c1 4.158 ㎜
Flood warning 1 5 mm/20min Rainfall at 20 minutes duration time when Risk depth H
c2 4.947 ㎜
Flood warning 2 6 mm/20min Rainfall at 20 minutes duration time when Risk depth H
c4 6.048 ㎜
3.3. Development of Real Time Monitoring System
Real time monitoring system developed to study basin cases to reduce natural flood
disasters in coastal urban area. For development of real time monitoring system, radar level transmitter installed in Sebyeong bridge and rainfall observation equipment installed in Pusan national university nearby Sebyeong bridge. And this study developed real time monitoring site that could confirm real time water level, flow velocity and rainfall
(http://210.118.169.13/).
4. Conclusion
This study estimated warning standard of rainfall and flood discharge using ArcView GIS, HEC-RAS and SWMM on the area. And real time monitoring system developed to various
Shin, Kim, Jang, Shon
data and the study on the development of flood forecasting and warning system should be considered and developed to reduce natural flood disasters in coastal urban area.
(a) Radar level transmitter (b) rainfall observation equipment
Fig. 5. Real time monitoring equipment
Fig. 6. Real time monitoring web-site (test version)
Acknowledgements. This research was supported by a grant [NEMA-Nature-2011-45] from the Natural Hazard Mitigation Research Group, National Emergency Management Agency of Korea.
References
Cordery, I. and Pilgrim, D.H., 1987: Storm loss and design rainfall excess, Australian rainfall and runoff, A guide to flood estimation, Volume I, Chapter 6, The Institution of Engineers, Australia.
Eric Christopher Tate, M.S.E., Francisco Olivera., PhD and David R. Maidment, 1999: Floodplain Mapping Using HEC-RAS and ArcView GIS, Center for Research in Water Resources.
Estrela, T., and Quintas, L., 1994: Use of a GIS in the modeling of flows on floodplains, Proc. of Second In-ternational Conference on River Flood Hydraulics, March 22-25, 1994, York, England, 177-183. HEC, 2002: HEC-RAS River Analysis System Hydraulic Reference Manual Version 3.1. US Army Corps of
Engineers, 3-1-3-25.
Huff, F.A., 1967: Time distribution of rainfall in heavy storms, Water Resources Research, 3(4), 1007-1019. H.S Shin, S.W. Jeon, B.C Seo, 2000: Flood influence analysis on Suyoung river based on
HEC-HMS/HEC-RAS, Korea Water Resources Association, 281-287.
H.S Shin, H.T Kim, M.J Park, 2004: The study of the fitness on calculation of the flood warning trigger rain-fall using GIS and GCUH, Korea Water Resources Association, 37(5), 407-424.
H.T Kim, H.S Shin, 2005: Flash flood warning system for mountainous region based on hydrogeomorpho-logical approach, Korea Water Resources Association, 811-815.