Accelerated testing of FCW for trucks
Part 2: Driving behaviour after exposure
to repeated critical events
ViP publication 2010-5
Authors
Carina Fors, VTI Magnus Hjälmdahl, VTIPreface
Accelerated Testing of FCW for Trucks is a collaborative project between Scania and
VTI within the competence centre Virtual Prototyping and Assessment by Simulation (ViP). The project consists of two parts:
Evaluation of a forward collision warning (FCW) system.
Assessment of changes in driving behaviour after being exposed to repeated critical situations.
This report describes the second part of the study, which was conducted in VTI’s Driving Simulator in 2009. The study was financed by ViP. The results from the second part of the study are public and the simulator scenarios used will be available to all ViP partners. The results from the first part are classified.
Participants from Scania were Fredrik Stenson (project leader), Tom Nyström, Lars Hjorth, Hanna Johansson, Erik Fagerman, Mattias Nilsson, Anna Svensson and Josefin Nilsson.
Participants from VTI were Carina Fors (project leader at VTI, test leader, data analysis), Magnus Hjälmdahl (experimental design, test leader, data analysis), Jan Andersson (experimental design), Tania Dukic (questionnaires), Åsa Forsman (statistical support), Sara Nygårdhs (test leader), Håkan Sehammar (hardware integration), Laban Källgren (scenario programming), Anders Andersson (scenario programming), Mats Lidström (simulator graphics) and Kristina Kindgren (test driver recruiting).
Ruggero Ceci (Swedish Transport Administration, STA), Hans Erik Pettersson and Lena Nilsson (ViP Director) have reviewed the report and provided valuable feedback. Thanks to all of you who have contributed to this project.
Linköping, October 2010
Quality review
Peer review was performed on 12 April 2010 by Hans Erik Pettersson and on 19 September 2010 by Ruggero Ceci (Swedish Transport Administration, STA)). Carina Fors has made alterations to the final manuscript of the report. The ViP Director Lena Nilsson examined and approved the report for publication on 15 December 2010.
Table of contents
Executive summary ... 5 1 Introduction ... 7 1.1 Aim ... 8 1.2 Limitations ... 8 2 Method ... 9 2.1 Experimental procedure ... 10 2.2 Participants ... 11 2.3 Simulator scenario ... 11 2.3.1 Critical events ... 12 2.3.2 Non-critical events ... 15 2.3.3 Dummy events ... 17 2.4 Questionnaires ... 17 2.5 Performance indicators ... 17 2.5.1 Number of warnings ... 172.5.2 Distance to lead vehicle ... 18
2.5.3 Overtaking ... 18
2.5.4 Mean speed ... 18
2.5.5 Arrows task ... 18
2.6 Statistical analysis ... 19
3 Results ... 20
3.1 Evaluation of the critical events ... 20
3.2 Subjective evaluation of driving behaviour ... 21
3.3 Objective evaluation of driving behaviour ... 23
3.3.1 Number of warnings ... 23
3.3.2 Distance to lead vehicle ... 23
3.3.3 Overtaking ... 24
3.3.4 Mean speed ... 25
3.3.5 Arrows task ... 26
4 Discussion ... 28
4.1 Driving behaviour ... 28
4.2 Evaluation of the events ... 30
4.3 Conclusions ... 30
References ... 31
Accelerated testing of FCW for trucks – Part 2: Driving behaviour after exposure to repeated critical events
by Carina Fors, Magnus Hjälmdahl and Lars Hjorth1
Swedish National Road and Transport Research Institute (VTI) SE-581 95 Linköping Sweden
Executive summary
Forward collision warning (FCW) systems alert the driver of an imminent rear-end collision with the vehicle ahead. FCW systems are difficult to test and evaluate in a real driving situation and a simulator study can thus be a feasible way of assessing various aspects of FCW systems, such as effectiveness and acceptance. A driving simulator allows for repeated exposure to critical situations, however, there is a risk that repeated critical situations reduce the realism and result in a change in driving behaviour. The aim of this study was to assess driving behaviour during non-critical parts of a driving session that contained repeated critical situations.
In a truck simulator 48 professional drivers participated in two driving sessions. The first session aimed at evaluating a FCW system which is reported elsewhere (classified). The second session was a 35 min long motorway drive with two critical and three less critical events. Between all events there was a car following situation. 32 of the drivers had a FCW system while the remaining 16 drivers had no FCW. Mean speed between the events, minimum distance to the vehicle in front in the car following situation, and performance on a secondary task – the arrows task – were used as measures of driving behaviour. In addition, the drivers answered a questionnaire about their driving
behaviour.
The changes in driving behaviour after being exposed to repeated critical events were relatively small and did not increase/decrease with time. About half of the drivers stated that their attention and preparedness increased with time, particularly in potentially critical or suspicious situations, and there was a tendency towards increased distance to the vehicle in front. There was no difference between the FCW and the no FCW groups with regard to mean speed, minimum distance to the vehicle in front, and arrows task performance.
The results from this study augur for the fact that accelerated testing in simulators is possible and that behaviour does not change in such a way that the results would be false or unrealistic. It should be noted that the study doesn’t address how to handle possible learning effects associated with the FCW system itself and how the results (e.g. reactions to warnings) from repeated critical events should be analysed and interpreted. Further research is needed in order to draw any general conclusions on if and how to use accelerated testing.
1 Introduction
Forward collision warning (FCW) systems alert the driver of an imminent rear-end collision with the vehicle ahead and can thus potentially reduce the number of collisions and/or make accidents less severe. Development and evaluation of FCW systems are technically challenging. The timing of the warning must be adjusted to a level where the driver will have time to react and avoid a collision, but at the same time the FCW system must not alert the driver too early since that will cause irritation. The human-machine interface must be designed in a way that the driver immediately understands what the warning means and reacts adequately.
FCW systems are hard to evaluate in a real driving situation because of the difficulties associated with creating test scenarios and the high risk of accidents. A simulator study can thus be a feasible way of assessing various aspects of FCW systems, such as effectiveness and acceptance. A driving simulator allows for repeated exposure to critical situations, however, there is a risk that repeated critical situations reduce the realism and result in a change in driving behaviour (e.g. lowered speed, increased attention). This project addresses both evaluation of an FCW system and investigation of potential changes in driving behaviour after being exposed to repeated critical situations.
A sole simulator experiment was performed, which aimed at studying both research questions. The first part – the FCW evaluation – was classified and the results are therefore not included in the present report. Also some details in the method description related to the FCW evaluation have been omitted.
The present report contains the second, methodological part of the project: assessment of driving behaviour after being exposed to repeated critical situations. The risks that are associated with accelerated testing are primarily learning effects, that result in a changed response to situations or events that occur several times. For example, the first time a certain warning is issued to the driver, the driver might not understand what the warning means. If the driver can relate the warning to the situation or if he/she looks in a manual, he/she will probably react differently the next time the warning is issued. Learning effects can also be related to situations. For example, if a bus turns out from a bus stop just in front of the driver, the driver might be suspicious and drive more carefully the next time a bus appears. This is of particular relevance in simulator experiments, where identical situations can be repeated several times. The results from studies where learning effects are present can be very hard to interpret and there is also a risk that the learning effects are greater than the effects of the treatment itself. It is therefore of great importance to find methods to minimize the influence of learning effects.
There is also a risk that repeated critical events result in an indirect effect on driving behaviour, for example in terms of a general increased attention, lowered speed or increased level of stress. Changed and/or unpredictable driving behaviour may lead to difficulties when interpreting the results but also when designing the scenario. For example, if a certain event – in order to become critical – requires that the driver drives in at least 90 km/h and the driver has lowered the speed because of previous events, the present event will not occur and thus, the potential benefits of using accelerated testing are precluded. The problem described gets even more complicated if drivers in the treatment group and the reference group (in between group designs) change their
Another concern when using repeated critical events is that the realism might decrease to a level where the drivers don’t take the driving task seriously. They may start to drive as if they are playing a video game or they may stop acting and reacting in situations that normally would require some action.
The present study is focused on investigating indirect effects on driving behaviour after being exposed to repeated critical events, i.e. behaviour on non-critical road sections. The investigation also included a comparison of driving behaviour of drivers with and without the FCW system. Analysis of potential learning effects related to the FCW system and the critical situations were unfortunately not possible to any greater extent, of secrecy reasons. Performance indicators were mean speed, minimum distance to the vehicle in front, number of warnings, willingness to overtake and willingness to pay attention to a secondary task. The study was performed in a truck simulator with
professional drivers. A number of different critical situations were used. Only situations where there was a risk of a forward collision were included in the scenario.
1.1 Aim
The aim of this study was to investigate possible changes in driving behaviour after being exposed to repeated critical forward collision situations in a truck simulator. The study focused on general driving behaviour on road sections between the critical events, for drivers with and without an FCW system. The investigation was done both
subjectively by questionnaires and objectively by studying driving parameters such as speed and distance to lead car.
Behaviour, reactions and possible learning effects that were related to the critical events and the FCW system were not addressed, because of secrecy reasons.
This report also includes a brief description and evaluation of the critical events used, since they will be available to all ViP partners. Also some recommendations for future studies are provided.
1.2 Limitations
The main focus of the project as a whole was the evaluation of the FCW system. The study design was therefore not optimized for investigating changes in driving
behaviour. Moreover, creating critical situations and defining robust measures on driving behaviour are not simple and straightforward tasks. Therefore, the part of the project reported here tended to be somewhat explorative.
2 Method
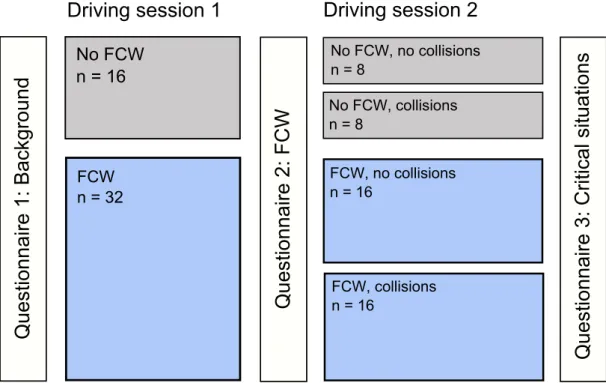
The experiment included two driving sessions and 48 drivers in total. The experimental design is shown in Figure 1. In the first driving session, a between group design was used. One group, consisting of 16 drivers, had no FCW system, while the remaining 32 drivers had FCW. Both groups had lane departure warning systems (LDW). In the second driving session, each group was divided into two subgroups. Half of the groups were exposed to critical situations aimed to result in collisions really experienced/per-ceived by the drivers, while the other half was exposed to the same critical situations but collisions were avoided or “masked” by pushing the other vehicle away. (However, these “masked” collisions were still registered as collisions in the logged data.) The aim of this division was to be able to investigate whether the seriousness of the collision had an impact on driving behaviour.
The first driving session mainly aimed at evaluating the FCW system (classified part, not reported here), while the second session was intended to be used for the
methodological part, i.e. the study described in this report.
Figure 1 Experimental design.
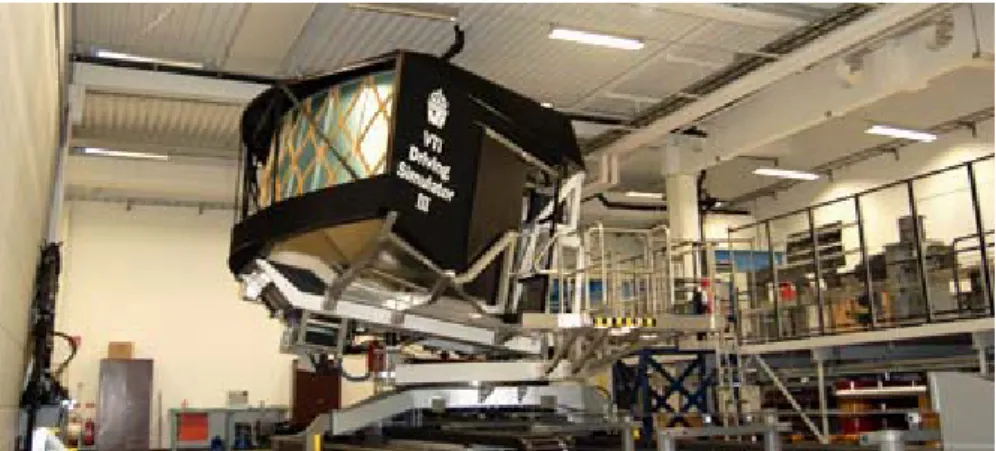
The study was conducted in VTI Driving Simulator III, which is a moving base simu-lator with a 120 degrees forward field of view, Figure 2. The cabin was directed along the motion table, which facilitates a linear motion for the simulation of longitudinal forces. The cabin was a Scania truck cabin (model T112H) with an upgraded instrument cluster and automatic gearbox. The simulated vehicle model was a three-axle truck. More information about the simulator can be found on the VTI web pages (VTI Driving Simulators, 2010).
Figure 2 VTI Driving Simulator III. In this experiment, the platform was rotated 90 degrees and the cabin was a truck cabin (not shown in the picture).
2.1 Experimental
procedure
The participants were not informed that the study was about FCW and critical situa-tions. When they arrived to the test, they were informed that the study consisted of two driving sessions of approximately 30 min each. They were told to drive as they do in the real driving situation, and to drive as if they had a time schedule to follow. In the
information given, it was mentioned that the truck was equipped with FCW and LDW (the participants in the no FCW group were only informed about the LDW system), but no further information about the systems was provided.
In order to draw focus from the real purpose of the study and also to get a measure of driving behaviour with regard to the willingness to pay attention to other things than traffic, a distraction task – the “arrows task” – was used (Östlund et al., 2004). A small touch screen at the right side of the steering wheel intermittently showed a matrix of arrows, Figure 3. If at least one arrow was directed upward, the driver should press a “yes” button, otherwise a “no” button. The task always started with a sound. There are several levels of difficulty, with regard to the total number of arrows and their direction, which were randomly varied during the experiment. The participants were instructed about the arrows task before the driving session started. The instruction was basically “do the arrows task each time you hear the sound”. There was no reward offered for motivating the performance of the task.
Before the first driving session, the participants had to fill in a background question-naire (Appendix A). The driving test began with a 7 min training session. The training allowed for the participants to get used to the simulator and for the test leader to make sure that the drivers understood how to do the arrows task. When the training was completed, the drivers were reminded about the driving instructions and then the driving session started. After the first session, the test leader told the participants that the study was about FCW and the participants were then asked to fill in a questionnaire about FCW. The test then continued with the second driving session, which was followed by another questionnaire that was focused on driving behaviour in critical situations. The participants, the driving scenarios and the questionnaires are further described below. Driving performance data, such as speed, brake pressure, distance to the vehicle in front etc., were sampled with 100 Hz in the events and 10 Hz otherwise. A video of the driver (from three cameras) and the forward view of the road were recorded on DVD.
2.2 Participants
Forty-eight professional truck drivers were recruited to the study and randomly assigned to one of the groups (FCW or no FCW). The recruitment criteria were:
Age: under 65 years
Mileage: more than 15 000 km/year Truck driving license: more than 1 year.
The participants had a mean age of 42 years (one participant was older than 65 years). Their mean mileage was approximately 75,000 km/year (range 15,000–150,000). On average, they had had their truck driving license for 18 years (range 1–46 years) and their total mileage was approximately 1,050 000 km on average.
Twenty-seven of the participants mainly drove Scania trucks and ten mainly drove Volvo trucks. Two drove MAN or Mercedes, while nine varied between different brands.
Fifteen of the participants had ESC (Electronic Stability Control) in their trucks and six had LDW. None had FCW.
The participants were compensated 500 SEK for their participation in the study.
2.3 Simulator
scenario
Each test occasion consisted of one training session and two test sessions. The first driving session was a mix of urban/suburban roads, rural roads and motorways. Since this part was mainly used for the classified part of the experiment, it will not be
described in detail. The second driving session was motorway only. The road type and the order of events of the scenarios are illustrated in Figure 4.
Figure 4 Overview of the simulator events. The first driving session is classified and the road type and the order of events are therefore not shown.
Since the aim of the first driving session was to evaluate the FCW system, a mix of different road environments and events were used, in order to reduce learning effects and possible effects of exposure to repeated critical events. The second driving session, on the other hand, consisted of motorway only and some of the events occurred more than once in order to facilitate investigations of driving behaviour over time.
In total, there were six critical events, four in the first session and two in the second session. These events were designed to be critical enough for the FCW system to issue a warning. In addition, there were four less critical events, where the driver would have to brake, but not critical enough to result in an FCW warning (unless the driver is
distracted and unaware of the situation). There were also some dummy events, where there was no need to brake, but where the drivers might suspect that something would happen.
The arrows task was activated a couple of times during the first driving session and between each event in the second driving session, but never during an event. 2.3.1 Critical events
There were five different critical events. One event (C4) occurred twice: once per driving session.
Event C1 – Lead car brakes because of crossing car
Event C1 occurs on an urban road, where the posted speed limit is 50 km/h, Figure 5. The lead car suddenly brakes at the intersection, when a crossing car drives through red light. If the test driver is too far behind the lead car, the crossing car will not appear. Instead a new attempt to trigger the situation will be made in the next intersection. The
event will be terminated (by letting the lead car turn left in an intersection and disappear) either when the critical situation has occurred or after three attempts.
Figure 5 Event C1 – Lead car brakes because of crossing car.
Event C2 – Bus turns out
A bus turns out from a bus stop without giving way to the simulator vehicle, Figure 6. The event occurs on a rural road where the posted speed limit is 70 km/h. The test driver either has to brake hard or steer to the left to avoid a collision.
Figure 6 Event C2 – Bus turns out from a bus stop.
Event C3 – Hidden car turns out
This event occurs on a rural road where the posted speed limit is 70 km/h, Figure 7. A passenger car that is hidden behind a parked bus turns out suddenly. The car swerves
Figure 7 Event C3 – Car hidden behind a bus turns out from a parking lot.
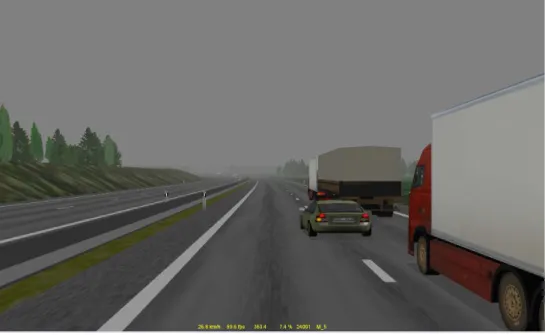
Event C4 – Lead car changes lanes and reveals a slow moving car
Event C4 is a motorway event, Figure 8. A van drives in front of the test driver. A queue in the passing lane prevents the test driver from changing lanes. Suddenly the lead car, i.e. the van, changes lanes and reveals a car that moves very slowly. The test driver has to brake hard or change lanes – which is difficult because of the queue – in order to avoid a collision.
Figure 8 Event C4 - Lead car changes lanes. Another, slow moving vehicle appears in front of the test driver.
Event C5 – Overtaking car cuts in
An overtaking car cuts in close in front of the test driver, and brakes, Figure 9. The car then accelerates and disappears. This event occurs on the motorway.
Figure 9 Event C5 - An overtaking car cuts in close and brakes.
2.3.2 Non-critical events
There were three different non-critical events. One event (N1) occurred twice and thus, there were four non-critical events in total.
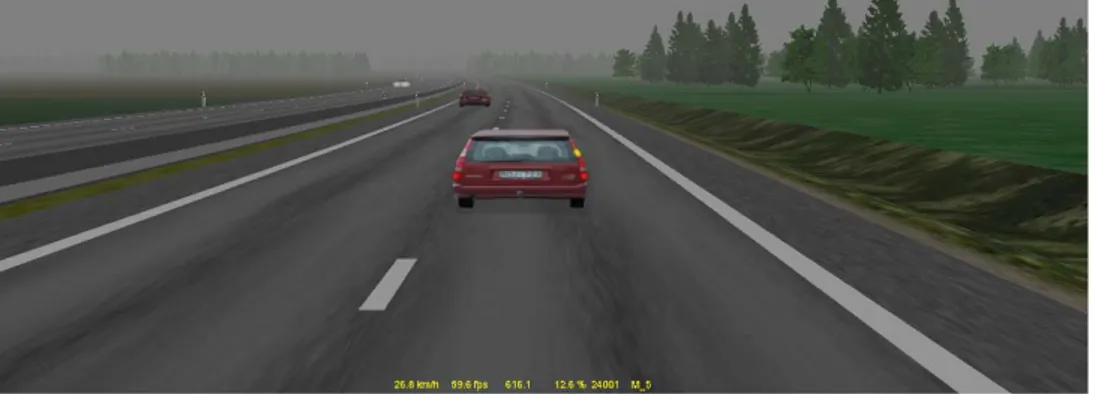
Event N1 – Three trucks
Event N1 occurs on the motorway, Figure 10. When the test driver overtakes three slowly driving trucks a passenger car that drives between the trucks suddenly changes lanes. The test driver has to brake and slow down somewhat.
Event N2 – Lead car brakes
A van drives in front of the test driver on the motorway, Figure 11. Suddenly the van brakes and drives slowly for a short while and then parks at the side of the road. The test driver has to brake or change lanes.
Figure 11 Event N2 – Lead car brakes and parks at the side of the road.
Event N3 – Overtaking car cuts in
This event is similar to event C5, but less critical. An overtaking car cuts in and brakes, Figure 12. The test driver has to brake and slow down somewhat.
2.3.3 Dummy events
There were two different dummy events. One of the events occurred twice (once during the training session) and the other event occurred six times.
Event D1 – Stationary bus
A bus has stopped at a bus stop on the right side of the road. Because of the two other bus events (C2 and C3), the test driver might suspect that something will happen.
Event D2 – Car following
This event occurs six times in the second driving session, i.e. between each critical or non-critical event. A van – either white, blue or yellow (the colour is randomly chosen) – drives in 79 km/h in the right lane on the motorway. When the test driver approaches from behind, a queue of vehicles passes in the left lane, making overtaking difficult (but not impossible). If the test driver chooses not to overtake, the van accelerates and disappears after a while.
2.4 Questionnaires
Each participant had to answer three questionnaires, see Figure 1: 1. Background questionnaire (before first driving session) 2. FCW questionnaire (after first driving session)
3. Critical situations questionnaire (after second driving session).
The first questionnaire included background questions about age, gender and driving experience. The second questionnaire was mainly about the FCW system and is therefore not further described here. The third questionnaire was about driving behaviour and critical situations and it was mainly a free text questionnaire. Both the second and the third questionnaire also included a few general questions about the driving session (realism, motion sickness etc.).
The background and critical situations questionnaires can be found in Appendix A – Questionnaires (in Swedish).
2.5 Performance
indicators
Six performance indicators were used for the evaluation of driving behaviour: Number of warnings
Distance to lead vehicle (car following event) Overtaking
Mean speed
Arrows task (2 performance indicators). 2.5.1 Number of warnings
If drivers become more cautious and prepared after being exposed to repeated critical events, identical situations should be less critical the second time they occur and thus, the number of participants who receive a warning will decrease. Two non-dummy events occurred twice – once in each driving session – and are thus included in this analysis: C4 and N1. This performance indicator is the only one that is related to driving behaviour in the critical situations.
2.5.2 Distance to lead vehicle
The car following event (D2) occurred between all non-dummy events in the second driving session. This event aimed at investigating the drivers’ choice of distance to the vehicle in front. The performance indicator distance to lead vehicle is defined as the minimum distance during the whole car following event. For drivers that overtake, this indicator is undefined and excluded from the analysis. The reason for not using for example mean distance to the lead vehicle as a performance indicator is that there were no well-defined beginning and end of the car following event. Furthermore, the lead vehicle kept a constant speed and thus, it was not possible to use measures such as the coherence and reaction time suggested by Brookhuis and colleagues (Brookhuis et al., 1994).
The hypothesis was that the distance to the vehicle in front would increase if drivers become more cautious after being exposed to repeated critical events.
2.5.3 Overtaking
The overtaking indicator is a binary flag that is 1 if the driver overtakes the vehicle in front in the car following event (D2), and 0 otherwise.
It was hypothesized that drivers might be less willing to overtake, which involves an interaction with other vehicles, if they had been exposed to repeated critical events caused by other vehicles.
2.5.4 Mean speed
This performance indicator is defined as the mean speed during a specific interval between all non-dummy events in the second driving session. The interval was selected so that it would not occur during any event where the driver had to adapt the speed to the surrounding traffic. The interval started when the driver was 800 m behind the lead vehicle in the car following event (D2) and ended when the distance to the vehicle in front was 500 m.
The hypothesis was that drivers who had been exposed to repeated critical events would decrease their speed in order to be better prepared for new critical situations.
2.5.5 Arrows task
The arrows task results in two measures: percentage of correct answers (%) and mean response time (ms). The arrows task was activated before, between, and after the non-dummy events in the second driving session (see Figure 4). For each participant, the measures were averaged for each before-, between-, and after-event period, resulting in six observations per participant and measure.
The aim of the arrows task was to get a measure on the drivers’ willingness to pay attention to other things than the driving task. It was hypothesized that drivers would spend less time on the arrows task after having been exposed to repeated critical events, and thus the percentage of correct answers would decrease while the response time would increase.
2.6 Statistical
analysis
The analysis was mainly done using data from the second driving session. The indi-cators distance to lead vehicle, mean speed and arrows task were analysed statistically in the same way, using a univariate ANOVA. Time and FCW group (no FCW or FCW) were used as fixed variables and participant was used as a random variable, in order to take individual variations in driving behaviour into account. A p-level of < 0.05 was considered as significant.
Number of warnings and number of overtakings were presented as descriptive variables. It was originally planned to divide the drivers into two groups – collision group and no collision group (see Figure 1) – and to investigate differences in driving behaviour between the groups. Unfortunately, not many drivers had a collision, Table 1, and this analysis was therefore abandoned. Instead, only changes over time were studied, by trend analysis using polynomial contrasts, where linear trends were of main interest. Possible effects of the FCW system and the interaction between group (no FCW or FCW) and time were also studied, since this is of great relevance for the possibilities to use accelerated testing.
Table 1 Number of collisions (in the no collision groups the collisions were “masked” while in the collision groups they were experienced).
Number of collisions
No FCW (n = 16) FCW (n = 32)
Event No collisions Collisions No collisions Collisions
C5 overtaking 4 6 1 5
C4-2* lane changing 0** 0** 0** 0**
*) Event C4 in second session
3 Results
The results section begins with an evaluation of the events used in the study. The results from the investigation of possible changes in driving behaviour are then presented.
3.1
Evaluation of the critical events
In the FCW questionnaire (after the first session), the drivers were asked about how realistic the critical events were, on a scale from 1 to 7 where 7 meant “very realistic”. The mean values are shown in Table 2.
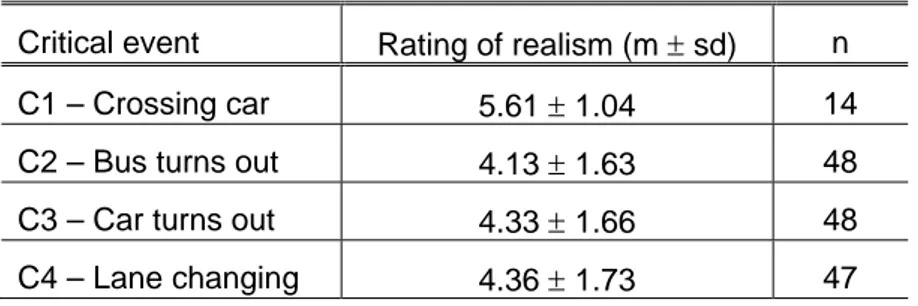
Table 2 The test drivers’ rating of the realism of the critical event; “1” corresponds to “not realistic at all” while “7” corresponds to “very realistic.”
Critical event Rating of realism (m sd) n C1 – Crossing car 5.61 1.04 14 C2 – Bus turns out 4.13 1.63 48 C3 – Car turns out 4.33 1.66 48 C4 – Lane changing 4.36 1.73 47
The test drivers were only asked about the realism of the critical events that occurred in the first driving session. They were not asked about the realism of the non-critical events, the dummy events nor any of the events in the second driving session. The events are further commented below.
Event C1 – Lead car brakes because of crossing car
Event C1 did not work as expected. A majority of the drivers drove very slowly through the town and thus, they never caught up with the lead car. A reason might be that the road through the town feels very narrow when driving a truck. One of the test drivers said that he seldom drove in urban areas in real life and therefore he did not feel very comfortable driving in the (simulator) town.
The pilot tests indicated that there could be problems with this event. The instruction “drive as if you have a time schedule to follow” was added to the information to the test drivers in an attempt to make the drivers drive as fast as the posted speed limit allowed. Apparently, this was not enough.
Event C2 – Bus turns out
The bus turning out event worked well. It became critical for all test drivers. Most of the drivers braked and stayed behind the bus, while a few overtook the bus. The latter behaviour could probably be prevented by adding some oncoming traffic.
Event C3 – Hidden car turns out
The event always occurred and became critical for most drivers (some drivers slowed down when they saw the bus and because of their low speed the event did not became very critical). However, this event might not be suitable for evaluation of FCW systems, since the turning out car appears very quickly from the side of the road where the tracking radar cannot detect it.
Event C4 – Lead car changes lanes and reveals a slow moving car
This event became critical for 79% of the drivers the first time it occurred and for 63% the second time. Some drivers kept a too long distance to the vehicle in front and a few managed to change lanes despite the dense traffic in the left lane.
Event C5 – Overtaking car cuts in
This event worked well and became critical for all drivers. Sixteen out of the 48 drivers collided.
Event N1 – Three trucks
The three trucks event worked well as a non-critical event. For some drivers it became critical enough to result in a warning, but the majority of the drivers only had to brake slightly, as desired.
Event N2 – Lead car brakes
About 60% of the drivers received a warning in this event, which was more than expected. This might be explained by the fact that it is somewhat difficult to see the brake lamps of the vehicle in front in the simulator.
Event N3 – Overtaking car cuts in
This event became more critical than expected, and about 96% of the drivers received a warning. There were, however, no collisions in this event.
3.2
Subjective evaluation of driving behaviour
The subjective evaluation was done through the critical situations questionnaire. The responses to the yes/no questions are given in Table 3. Each yes/no question was followed by a free text question: if yes, how? The free text answers are summarized below.
Table 3 Summary of the critical situations questionnaire answers.
Question Yes No Total
Did you expect that critical situations would occur? 45 3 48 Did you act differently than you would have done in
real traffic
- before the situations? 9 39 48
- during the situations? 4 44 48
- after the situations? 3 45 48
Did you act differently in the end than in the beginning of the driving session with regard to
- your choice of speed? 11 36 47
- your distance to the vehicle in front? 23 25 48 - your attention/preparedness? 29 19 48 - your performance of the arrows task? 14 34 48 - your willingness to overtake? 16 32 48
Did you expect that critical situations would occur?
Almost all drivers stated that they expected critical situations to occur. In the free text comment, about a third of the drivers wrote that they expected things to happen in overtaking situations. Thirteen drivers mentioned the three trucks event and some of them wrote that they knew that the car would turn out the second time the event occurred. Six drivers expected critical situations to happen when they caught up with the car in front. Thirteen to fourteen drivers gave more general answers: either that they expected things to happen since they participated in a simulator study or that you always have to be vigilant when driving.
Did you act differently than you would have done in real traffic?
Most drivers answered that they did not; neither before, during nor after the situations. Of those who said that they acted differently before the situations, most mentioned different strategies in order to avoid potential critical situations, for example paying more attention or keeping a longer distance to the vehicle in front. One driver wrote that he did not shout and scream like he usually does, during and after the situations.
Did you act differently in the end than in the beginning of the driving session?
More than half of the drivers stated that they acted differently with regard to their
attention. Almost all of these drivers said that their attention increased. One driver said
that his/her attention decreased because of the arrows task. Almost half of the drivers stated that they kept a longer distance to the vehicle in front. About a third answered that their willingness to overtake changed; however, some became more willing to overtake while others avoided overtaking. Also the behaviour regarding the arrows task
differed among the drivers. More than two thirds stated that their arrows task
performance did not change, while some said that they paid less attention to the arrows task and some said that they performed better and faster. (The drivers were not told about their result on the arrows task when they filled in the questionnaire.) Most of the eleven drivers that answered that they acted differently with regard to their choice of
speed stated that they became more attentive and prepared and therefore lowered their
speed.
3.3
Objective evaluation of driving behaviour
3.3.1 Number of warnings
The number of warnings given in the two critical events that occurred twice is shown in Table 4.
Table 4 Number of warnings given.
Number of warnings
Event First time Second time
C4 – Lane changing 38 30
N1 – Three trucks 5 13
3.3.2 Distance to lead vehicle
Figure 13 shows the average minimum distance to lead vehicle in the car following event (D2). The statistical analysis showed that there was a significant difference between the means over time but there was no linear trend in the data. There was no significant difference between the groups, although the no FCW group always had shorter distances than the FCW group on average. No interaction effects between time and FCW group were found.
D2-1 D2-2 D2-3 D2-4 D2-5 D2-6 0 20 40 60 80 100 120 140
Minimum distance to lead vehicle (m sd)
Di s ta n c e ( m ) n=35 n=34 n=34 n=31 n=32 n=32 all no FCW FCW
Figure 13 Minimum distance to lead vehicle. The statistical analysis showed that there were significant differences over time, but there was no linear trend in the data.
3.3.3 Overtaking
Table 5 shows the number of test drivers who overtook the lead car in the car following event (D2).
Table 5 Number of drivers who overtook in each car following event.
Number of overtakings per car following event
D2-1 D2-2 D2-3 D2-4 D2-5 D2-6 12 13 14 17 15 16
Figure 14 shows which drivers who overtook in each event. It can be seen that the drivers tended to stick to a strategy: either to always overtake or to never overtake. From Figure 14 there seems to be no clear difference in overtaking strategy between the no FCW and the FCW groups.
Overtakings (black) S u bj ec t
Car following event
D2-1 D2-2 D2-3 D2-4 D2-5 D2-6 5 10 15 20 25 30 35 40 45
Figure 14 The horizontal markings show which drivers who overtook in each event. Subjects 1–16 are the no FCW group.
3.3.4 Mean speed
Mean speed between the non-dummy events is shown in Figure 15. The statistical analysis showed that there was a significant difference between the means over time. There was no linear trend in the data. There was no significant difference between the FCW/no FCW groups, although the no FCW group always had a higher speed than the FCW group on average. No interaction effects between time and FCW group were found.
C5 N2 C4 N3 N1 84 85 86 87 88 89 90 91 92 93 94 S p e ed ( k m /h)
Speed between events (m sd)
all no FCW FCW
Figure 15 Mean speed between non-dummy events. The statistical analysis showed that there were significant differences over time, but there was no linear trend in the data. n = 48 (except between N3 and N1 where n = 47 because of simulator failure).
3.3.5 Arrows task
The percentage of correct answers and the response time are shown in Figure 16 and Figure 17, respectively. The statistical analysis showed that there was a significant difference between the means over time for both percentage of correct answers and response time. For percentage of correct answers there was no significant linear trend while for response time a significant linear trend was found. There were no significant differences between the FCW groups for neither parameter, although the no FCW group tended to perform somewhat better on average. No interaction effects between time and FCW group were found.
C5 N2 C4 N3 N1 70 75 80 85 90 95 100 P e rc e n ta ge (% )
Arrows task: percentage of correct answers (m sd)
all no FCW FCW
Figure 16 Arrows task percentage of correct answers. The statistical analysis showed that there were significant differences over time, but there was no linear trend in the data. n = 47. C5 N2 C4 N3 N1 2100 2200 2300 2400 2500 2600 2700 2800 2900 3000 R e sp o n se t im e ( m s )
Arrows task: response time (m sd)
all no FCW FCW
Figure 17 Arrows task response time. The statistical analysis showed that there were significant differences over time and there was a linear trend in the data. n = 47.
4 Discussion
4.1
Driving behaviour
The changes in driving behaviour after being exposed to repeated critical events were in this study relatively small and not increasing/decreasing with time. The maximum difference over time of the average values of mean speed was approximately 1 km/h and there was no linear trend in the data indicating that speed decreases with time. A
possible explanation for the nonlinear variations – which were similar for both groups (no FCW and FCW) – could be the inclination of the road and this factor was therefore controlled for by investigating the correlation between mean speed and road inclination (<0 for downhill). The correlation was -0.65 (not significant), i.e. the inclination of the road may contribute to the variations in speed. Nearly one out of four drivers stated in the questionnaire that they changed their speed. Either the subjectively reported
differences in speed were too small to be found in the statistical analysis, or the drivers who reported that they changed their speed may have meant that they changed their speed in potential critical or suspicious situations.
Also the minimum distance to the vehicle in front varied over time in a nonlinear way. There is, however, a tendency that the distance increases towards the end of the driving session. This is in agreement with the results from the questionnaire, where almost half of the drivers stated that their distance to the vehicle in front increased with time. For both mean speed and minimum distance to the vehicle in front, a difference between the FCW/no FCW groups can be seen (Figure 13 and Figure 15), although no significant difference between the groups were found. This can be explained by the fact that three drivers chose to drive at a lower speed than the posted speed limit, since they did that in real life of economical reasons. All these drivers were in the same group (the FCW group), and thus the major part of the differences between the groups are related to these three drivers. It should be noted that there are great individual differences in minimum distance to the vehicle in front, and to the willingness to overtake.
The number of correct answers to the arrows task was significantly different over time, but the differences were relatively small and there was no linear trend in the data, i.e. there is no evidence that the test drivers became less willingly to pay attention to the arrows task after being exposed to repeated critical events. However, the response time decreased over time and thus, there seems to be some learning effects which means that the drivers had to spend less time on the arrows task as the time progressed.
There were no interaction effects between time and FCW/no FCW group, i.e. there were no differences in driving behaviour over time between the two groups. Differences in behaviour between the treatment group and the reference group would speak against the use of accelerated testing. For example, if one of the groups would drive slower with time, the collision events would be less critical for that group and thus hard to compare to the other group. The absence of differences in this study is thus a good sign, but since the amount of data is limited and because of the limitations of the study, the result should be confirmed by further studies.
Almost all drivers stated that they expected that critical situations would occur during the driving session. Many drivers said that they became more attentive, either in general or in certain situations where they expected that something would happen. Particularly situations that happened more than once – overtaking’s, car following and the three trucks event – were mentioned as situations where the drivers became more attentive. Two events, C4 (lead car changes lane) and N1 (three trucks) occurred twice. The
number of drivers who received a warning decreased in the critical event (C4), but increased in the non-critical event (N1). The amount of data is very limited, but a possible explanation to this somewhat contradictory result might be that the drivers recognize the situations and are more attentive the second time event C4 occurs, while they know that event N1 will not become critical and thus drive somewhat more offensive the second time.
A somewhat confusing observation is that most drivers stated that they did not act differently before, during or after the situations than they would have done in real traffic, but on the other hand, most drivers also stated that they acted differently (with regard to their attention) in the end than in the beginning of the driving session. A possible explanation is that the latter question was more specific than the former and that most drivers did not include attention in the general question on how they acted. As stated in the introduction, investigating changes in driving behaviour after repeated critical events was a secondary aim in the project as a whole, and the experimental design was therefore not optimal for studying repeated critical events. The drivers had already been exposed to a number of critical events in the first part of the driving session and possible behavioural changes after the first or the first few events are thus not captured in this study. When the drivers performed the second driving session they also knew that the study was about forward collision warning systems and that probably had an effect on their attentiveness.
The choice of critical and non-critical events and the design of the scenario can be discussed. One could argue that the scenario design with only two critical events in the second driving session does not qualify as “repeated critical situations”. The reason for using a mix of critical and less critical events was twofold: 1) there was an ambition to keep the scenario as realistic as possible in order to be able to evaluate the effect of the FCW system and 2) fast decelerations (hard brakings) in the simulator tend to cause motion sickness.
It should be mentioned that it was probably a good choice to have the cabin directed along the motion table, since that gives a better acceleration/deceleration motion. Only two participants stopped driving because of motion sickness, although the scenario included several hard brakings.
Based on the results and the experiences from this study, if a similar study – i.e. a study which aimed at investigating driving behaviour between critical events – was to be conducted, the following design is suggested:
Only one driving session of approximately 35–40 min. The road should be of the same type during the whole session. The drivers should not be informed that the study is about critical events.
Two groups (no FCW and FCW) of drivers with equal number of subjects in each group.
A critical event approximately every 5 min. No events should be identical, in order to reduce learning effects. Only critical and thus no non-critical events would be used. The order of the events should be balanced.
No grouping into collision/no collision, since this was hard to implement. Investigating learning effects and their influence on accelerated testing is probably of greater importance than studying driving behaviour between critical events. Further
for example whether it is meaningful to use accelerated testing of a warning system that issues a warning only on very rare (and very critical) occasions. For such systems, it is of utmost importance that the driver understands the warning the first time it is given. Thus, giving the warning repeatedly in a simulator might not give results that are applicable to the real driving situation.
For some research questions, the influence of learning effects may be of less importance. For example, a comparison of two HMIs is probably less affected by learning effects than an investigation of the absolute effect of a system (e.g. in terms of crashes), and thus more feasible for accelerated testing.
There are no simple answers to if, when and how to use accelerated testing. The question is too complex to be answered by a single study. The present study provides some information on driving behaviour after exposure to repeated critical events, but more research is needed in order to draw any general conclusions.
4.2
Evaluation of the events
The bus turning out event (C2, rural road) and the event where an overtaking car cuts in (C5, motorway) were the most successful in terms of criticalness and number of
participants for whom the situation became critical. The event where the car in front brakes because of a crossing car (C1, urban road) did not work well, because most test drivers drove too slow. In order for this event to work, the car in front must drive slower and/or maybe a wider road would make the test drivers drive faster. The event where a hidden car turns out in front of a parked bus might not be a good event for FCW studies, because the radar detects the car very late.
The results from the questionnaire show that drivers tend to recognize situations that have happened before. Some drivers mentioned the three trucks event and some pointed out that the same red Volvo was involved in several events.
4.3 Conclusions
The changes in driving behaviour after drivers being exposed to repeated critical events were relatively small and did not increase/decrease with time. About half of the drivers stated that their attention and preparedness increased with time, particularly in
potentially critical or suspicious situations, and there was a tendency towards increased distance to the vehicle in front. There was no difference between the FCW and the no FCW groups with regard to mean speed, minimum distance to the vehicle in front and arrows task performance. The study did not show any signs of “gaming” behaviour or that it would be difficult or impossible to entice drivers into critical situations several times.
It should be emphasized that the study was conducted in a truck simulator with
professional drivers. Truck drivers may be more rule-based in terms of speed choice and headway than car drivers, and a truck differs a lot from a car. Thus, the results should not be generalized to be valid also for car drivers.
It should be noted that the study did not address potential learning effects associated with the FCW system or the critical events. The results of the present study do not speak against the use of accelerated testing, but before any general conclusions or
recommendations on accelerated testing are given, more studies are needed, particularly on learning effects and their influence on the results.
References
Brookhuis, K., De Waard, D. and Mulder, B., (1994). Measuring driving performance
by car-following in traffic, Ergonomics, 37:3, 427–434
VTI Driving Simulators (2010). http://www.vti.se/templates/Page____3257.aspx (downloaded on 2010-10-22).
Östlund, J., Nilsson, L., Carsten, O. M. J., Merat, N., Jamson, H., Jamson, S., et al. (2004). Deliverable 2 – HMI and Safety-Related Driver Performance (No.
GRD1/2000/25361 S12.319626): Human Machine Interface and the Safety of Traffic in Europe (HASTE) Project.
Appendix A Page 1 (4)
Appendix A – Questionnaires
Below are the background and critical situations questionnaires, in Swedish.
Bakgrundsfrågor
1. Födelseår: 19___ 2. Kvinna Man
3. Hur många mil har du kört med lastbil de senaste 12 månaderna? _____________ 4. Hur gammal är den/de lastbil/ar du huvudsakligen kör? _______________
5. Vilken(a) lastbilsmodell(er) brukar du köra med? ________________________ 6. Hur många mil har du kört tung lastbil totalt i ditt liv? _____________
7. Vilket år tog du lastbilskörkort (C/CE körkort)? _____________
8. I vilken utsträckning använder du följande utrustning under körning (i lastbil) en vanlig arbetsdag?
System Ofta Någon gång Aldrig
Mobiltelefon Handdator (PDA)
Färddator Farthållare
GPS-navigator Dynafleet / Fleet management
system / Interactor
Mobitex Annat:___________
Annat:___________
9. Använder du följande säkerhetssystem i den lastbil du kör oftast?
Appendix A Page 2 (4)
Körning del 2, frågeformulär
Du har under de två körningarna upplevt flera kritiska situationer, där du har behövt bromsa hårt eller väja för att undvika kollision. Du kan också ha upplevt situationer där det inte har gått att undvika en kollision.
Frågor om hur du upplevde körningen och situationerna
1. Förväntade du dig vid något tillfälle före eller under körningen att kritiska situationer skulle komma att inträffa?
ja nej
Om ja, varför och när förväntade du dig att något skulle inträffa?
___________________________________________________________________________ _____________________________________________________________________ _____________________________________________________________________
2. Agerade du på något sätt annorlunda än vad du skulle ha gjort i verklig trafik: - Före situationerna ja nej
Om ja, på vilket sätt?
____________________________________________________________________________ ____________________________________________________________________________ - Under situationerna ja nej
Om ja, på vilket sätt?
____________________________________________________________________________ ____________________________________________________________________________ - Efter situationerna ja nej
Om ja, på vilket sätt?
____________________________________________________________________________ ____________________________________________________________________________
Appendix A Page 3 (4)
3. Upplever du att du mot slutet av körningen agerade annorlunda än vad du gjorde i början av körningen med avseende på:
- Ditt val av hastighet ja nej
Om ja, på vilket sätt?
____________________________________________________________________________ ____________________________________________________________________________
- Din avståndshållning ja nej
Om ja, på vilket sätt?
____________________________________________________________________________ ____________________________________________________________________________ - Din uppmärksamhet/beredskap ja nej
Om ja, på vilket sätt?
____________________________________________________________________________ ____________________________________________________________________________ - Ditt utförande av piluppgiften ja nej
Om ja, på vilket sätt?
____________________________________________________________________________ ____________________________________________________________________________
- Din vilja att köra om ja nej
Om ja, på vilket sätt?
____________________________________________________________________________ ____________________________________________________________________________
Appendix A Page 4 (4)
Allmänt om hela körningens upplevelse
Följande frågor avser del 2 av körningen.
1. Har du kolliderat under körningen?
Ja Nej Vet inte
2. Hur krävande tyckte du att ”piluppgiften” var att utföra under körningen?
inte alls krävande mycket krävande
1---2---3---4---5---6---7
3. Hur realistisk tycker du att körningen i simulatorn var?
inte alls realistisk mycket realistisk
1---2---3---4---5---6---7
4. Hur mådde du under körningen i simulatorn?
mycket dåligt mycket bra
1---2---3---4---5---6---7 Om du mådde dåligt (1-3 på skalan) på vilket sätt mådde du dåligt?
………. ……….. Fria kommentarer: ………. ……….. ……….
ViP
Virtual Prototyping and Assessment by Simulation
ViP is a joint initiative for development and application of driving
sim-ulator methodology with a focus on the interaction between humans and
technology (driver and vehicle and/or traffi c environment). ViP aims at
unifying the extended but distributed Swedish competence in the fi eld of
transport related real-time simulation by building and using a common
simulator platform for extended co-operation, competence development
and knowledge transfer. Thereby strengthen Swedish competitiveness
and support prospective and effi cient (costs, lead times) innovation and
product development by enabling to explore and assess future vehicle
and infrastructure solutions already today.
Centre of Excellence at VTI funded by Vinnova and ViP partners
VTI, Saab Automobile, Scania, Volvo Trucks, Volvo Cars, Bombardier Transportation, Swedish Transport Administration, Dynagraph, HiQ, Pixcode, SmartEye, Swedish Road Marking Association