Travis P. Teegardenl Bruce E. Gilbert2
ABSTRACT
Land application disposal (LAD) systems have been used throughout the U.S. for several decades, but land application of wastewater in Montana has little documentation. More importantly is the lack ofliterature on the performance of LAD systems. As companies and municipalities, both public and private, plan for future expansion, wastewater treatment and disposal issues are of significant concern. The State of Montana's "non-degradation" rule places strictly regulated limitations on the discharge of wastewater into Montana's public waters. These regulations have many entities seeking new technological methods and economical solutions for wastewater treatment and disposal that meet current standards. Stillwater Mining Company (SMC) has upgraded LAD systems and developed a water quality monitoring plan to stabilize and reclaim approximately 42 acres (17 hectares) of partially reclaimed chromium tailings. Forage on the LAD area supports resident mule deer and serves as winter range for bighorn sheep. In 1993, SMC commissioned MSE-HKM, Inc. (formerly HKM Associates) to design a new LAD system and monitoring program for the partially reclaimed tailings site. After two years of operation and monitoring, results show high levels of nitrogen utilization and significant forage improvement on the LAD site. The design considerations, operation, monitoring, and results of two years ofland application at SMC are presented. Wildlife ecosystem and habitat enhancements have been achieved by increasing natural food sources and cover. Results show that land application disposal systems can be utilized to improve reclamation efforts and
can
economically provide treatment and disposal solutions to improve water quality.INTRODUCTION
Stillwater Mining Company (SMC) is a platinum and palladium mine near Nye, Montana. The only mine of its type outside the former USSR and South Africa, SMC provides precious metals required in the production of items used daily by most Americans, such as catalytic converters and computer chips. Located along a blue ribbon trout stream, the Stillwater River, and at the foot of the Beartooth
I Agricultuml Engineer. MSE-HKM. Inc .. P.O. Box 31318 Billings, MT 59107
~ Environment.11 Affairs Manager. Stillwater Mining Co. , HC-S" Box 365, Nye. MT 59061 297
Mountain Range, much ofSMC's property supports resident mule deer and
wintering bighorn sheep. SMC is continually improving methods of operation to
protect and enhance the surrounding ecosystem and environment.
SMC uses nitrogen-based blasting agents to break ore in mine workings on the
east and west sides of the Stillwater River
.
Natural groundwater inside the mine
mixes with the nitrogen residues remaining after blasting and flows out of the
mine
.
Most of the mine production water, referred to hereafter as adit water, has
historically been diverted to percolation ponds, with a small portion applied to land
by big gun sprinklers. Current SMC water and nitrogen disposal methods are well
within the existing discharge limits ofthe permit issued by the State of Montana.
However, in an effort to improve "disposal" methods, SMC has installed two
state-of-the-art land application systems to spray irrigate a variety of grasses
growing on partially reclaimed chromium tailings.
In 1993 SMC commissioned MSE-HKM, Inc. (formerly HKM Associates), a
consulting engineering firm in Billings, Montana, to design the LAD system and to
prepare a water quality monitoring program that would quantitatively document
the nitrogen utilization of the LAD system
.
The design team used innovative,
site-specific design concepts to help develop two center pivot sprinkler systems for the
LAD site
.
The new center pivots are unique in that the spray irrigation system
design maximizes the water and nitrogen utilization. To minimize costs of the LAD
system, an existing pumping plant and pipeline were utilized to deliver adit water
from a storage pond to the two LAD systems
.
This paper discusses the engineering
considerations and design parameters used to develop the LAD system layout.
MSE-HKM developed a water quality monitoring plan to measure the
performance ofthe LAD system. SMC has collected data for two years, 1994 and
1995.
Anoverview of the water quality monitoring plan, including data collection
and analyses, is presented. A summary of the LAD performance for 1994 and 1995
is also included.
BACKGROUND INFORMA nON
Mine operations produce year-round adit water flows ranging from approximately
500 to 1,000 gallons per minute (32 to 63 liters/second)
.
About 60% of this flow
originates from the east side of the Stillwater River and 40% is produced from the
west side. Typical nitrate plus nitrite (referred to herein as nitrogen) concentrations
range from approximately 2 to 6 milligrams per liter (mgll) on the east side to 15
to 20 mgll on the west side
.
Existing soils in the LAD area vary widely depending on location
.
The soil profile
in the southern portion of the LAD area consists of varying depths of chromium
tailings, usually 5 to 10 feet (1.5 to 3.0 m), overlain by varying depths of gravelly loam topsoil, typically 2 to 12 inches (51 to 305 mm). Soils in the northern portion of the LAD area are generally deep gravelly loams overlain by 0 to 6 inches (0 to 152 mm) of chromium tailings. The small depth of chromium tailings over native soil in the northern portion of the LAD area is a result of wind erosion and deposition from the tailings to the south. The native soils and the chromium tailings have high permeabilites, ranging from 2 to 6 inches per hour (51 to 152 mmlhr). Baseline soil samples collected in 1993 and 1994 show very low nitrogen levels.
Site vegetation prior to LAD system operation varied in type and population depending upon topsoil quantities and past irrigation patterns. Vegetation under the portion of the site which had historically been irrigated with big gun sprinklers consisted primarily of alfalfa. The site also had scattered areas of bluegrass, fescue, and assorted wheatgrasses. Sparse vegetation existed over tailings with shallow topsoil. Some areas of exposed chromium sand tailings had no established vegetation. The surrounding areas are a mix of native grasses, brush, aspen, and conifers. Site vegetation is used as a year-round food source for a variety of wildlife.
ENGINEERING DESIGN CONSIDERATIONS
LAD System Design
The design of an optimum land application disposal system requires a variety of professional expertise. The design team, consisting of agricultural and civil engineers, environmental specialists, and a soil scientist evaluated water quality, soils, vegetation, climate and topography to design the LAD system. MSE-HKM worked closely with SMC personnel to identifY the project objectives and to develop the details of the LAD system and monitoring plan. The LAD system plan and site enhancements were reviewed by a multi-disciplinary team from SMC, MSE-HKM, the Natural Resources Conservation Service (formerly SCS), and the State Department of Environmental Quality.
The shallow topsoil over chromium sands results in an effective root zone depth of approximately I foot (305 mm). The water holding capacity in the root zone of the existing vegetation is low, estimated at 0.5 to 1.5 inches (13 to 38mm). Soil fertility tests show little or no residual nutrients, particularly nitrogen, in the soil profile. Topographic characteristics on the site vary from relatively flat areas to steeper slopes (15 to 20 percent) along the base of the mountain. Based on the soils and topography, the use of a mobile, automated sprinkler system that would apply frequent, light applications of irrigation to the site with a high level of control was recommended. A high level of water management is necessary to
maximize crop water and nitrogen use which will result in vigorous plant growth.
The goal is to develop the soil profile by increasing the organic matter in the root
zone
.
Vegetative conditions on the site varied from areas of thick grasses, where historic
irrigation had occurred, to areas with limited foliage. Analysis of mine water
quality (nitrogen concentration), climate, soils and vegetation indicated that
inter-seeding a meadow grass with a high water and nitrogen uptake potential was
·
most
suitable for the LAD site
.
Garrison Creeping Foxtail (A1opecurus arundinaceus)
was selected to inter-seed with the existing grasses for a variety of reasons: high
water use potential, high nitrogen uptake potential, good sod building
characteristics, lush growth in a wet environment, excellent forage qualities, and
adaptability to a variety of soils. Garrison Creeping Foxtail is a hearty variety that
will thrive with the existing species under
irrigati~n.If irrigation ceases, the
existing species more adapted to semi-arid conditions will dominate the site
.
Vegetation establishment in the chromium tailings has proven difficult in the past.
Therefore,
inter-seeding
was completed by drill seeding with a no-till drill to insure
minimum disturbance of the tailings
.
Climatic conditions during the growing season, typically April through October,
were evaluated. The majority of growing season precipitation occurs in April, May
and June
.
Mid-summer and early-fall months (July, August, September, and
October) are typically warm, dry and breezy with little rainfall
.
Climatic conditions
of the site indicated that the crop water demand would be highest in the summer
and fall, and lower in the spring
.
A two-phase conceptual design layout for SMC's land application disposal system
was prepared in 1993
.
The Phase I layout was designed to be a pilot study and
included one center pivot sprinkler system that was installed in 1993. Successful
results of the pilot study prompted the implementation of the Phase
n
design
layout, which included a second center pivot sprinkler system that was installed in
1994
.
Center pivot sprinkler systems were selected over other potential methods of
land application for several reasons
:
• Center pivot irrigation systems provide uniform application distribution which
maximizes the consumptive use of the crop and optimizes nitrogen uptake
.
• Nozzles can be designed and located to maximize water and nitrogen
utilization.
• Operation and management of a center pivot system can be modified
throughout the growing season to match the climatic and vegetative demands
of the crop.
• Design objectives could be achieved matching the existing pumps at SMC
which operate at approximately 80 psi (552 kPa).
• Center pivots are easily automated with computer control panels and thus operate with a high level of management with minimal labor.
• Automated operation ofthis type of irrigation system provides a higher level of quality control than conventional stationary irrigation systems.
• Computer controls automate the water accounting of system operations.
Water Ouality Monitoring Plan
An investigation was made ofthe data required to analyze the system's performance. Field data necessary to analyze the LAD system included: water delivered to the LAD system, rainfall, application depth, and deep percolation. From the field data, calculations of crop uptake and evaporation were made. The water quality monitoring plan to measure the water and nitrogen utilization performance of the LAD system was implemented in two phases. A pilot monitoring program under Pivot # I began in 1994 and was expanded as Phase IT in 1995 to include Pivot #2.
Bucket Iysimeters and rain gages were installed to quantify water application, rainfall, deep percolation, and crop uptake. Samples from the Iysimeters and rain gages allow quantification of water quantity and quality for both the water applied and the water deep percolated. SMC's monitoring data was summarized by MSE-HKM and presented in two reports (MSE-HKM Associates, 1994 and MSE-MSE-HKM, Inc.,
1995).
Additional water quality monitoring components in place at Stillwater Mine include monitor wells, located down gradient of the LAD area. The monitoring plan also includes periodic soil sampling to assess the long-term effects of applying nitrogen to the soil.
LAND APPLICATION DISPOSAL (LAD) SYSTEM LAD System Layout and Operation
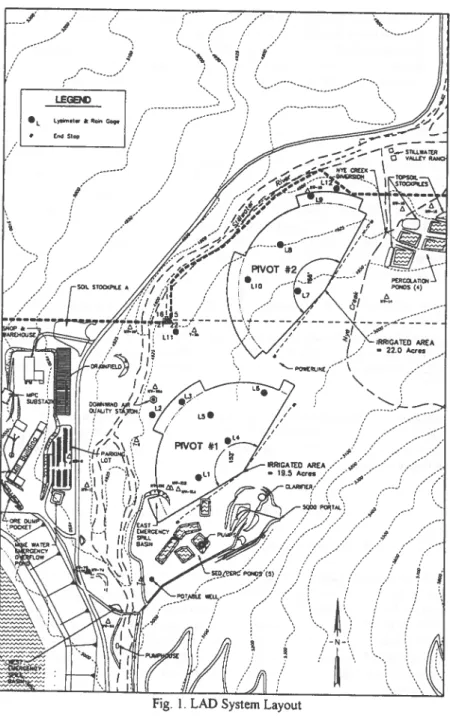
SMC installed two center pivots, Pivot # I and Pivot #2, in the fall of 1993 and the spring of 1994, respectively. Pivot # I and Pivot #2 cover 19.5 and 22.0 acres (7.9 and 8.9 hectares), respectively. Pivot #1 operated on a limited basis in the fall of 1993, with full operation and monitoring beginning in 1994. Pivot #2 had limited operation in 1994, with full operation and monitoring beginning in 1995. Twelve Iysimeters and rain gages, including three baseline units outside the irrigated area, were installed. Figure 1 shows the layout of the center pivots and monitoring components.
_____ .1'
/
---/
//
e •.. /L-_ _ _ _ - - - l
Seasonal operation of the center pivots generally begins in May and ends in late October. During warm, dry autumn seasons, the pivots may operate well into November. Typically, the systems are operated 10 to 12 hours per day, Monday through Friday. During light rain showers, the systems generally continue operation. However, during regional storm fronts producing heavier rainfall, the LAD systems are usually shut off
Water Ouality Monitoring Plan
Adit water flows from clarifiers on the east and west sides are measured and sampled continuously, producing a daily composite sample from each side. Flows through the center pivots are measured by flow meters at each pivot's
computerized control pane\. Water delivered to the LAD system is sampled daily, and compo sited weekly. Precipitation and irrigation under the LAD system and in the baseline Iysimeters are measured daily. Daily samples' are combined into a weekly composite for each sampling site. Deep percolation samples are collected weekly from each Iysimeter using a suction pump. Soil samples are collected twice per year, before and after the LAD season. Monitor wells are sampled quarterly by SMC personnel. All water quality monitoring samples are analyzed by a certified independent laboratory.
RESULTS
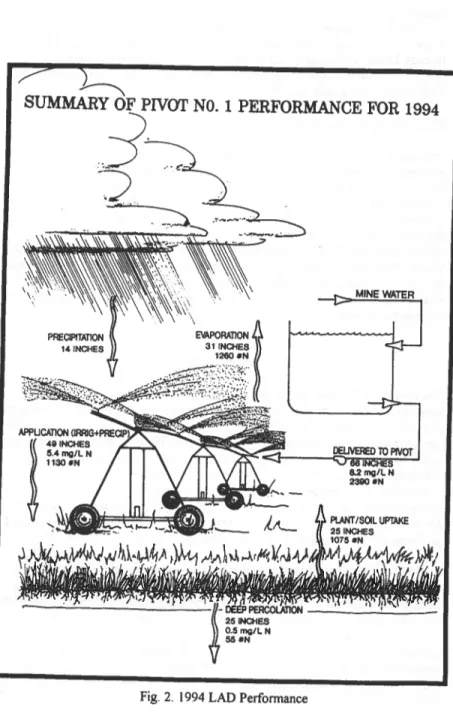
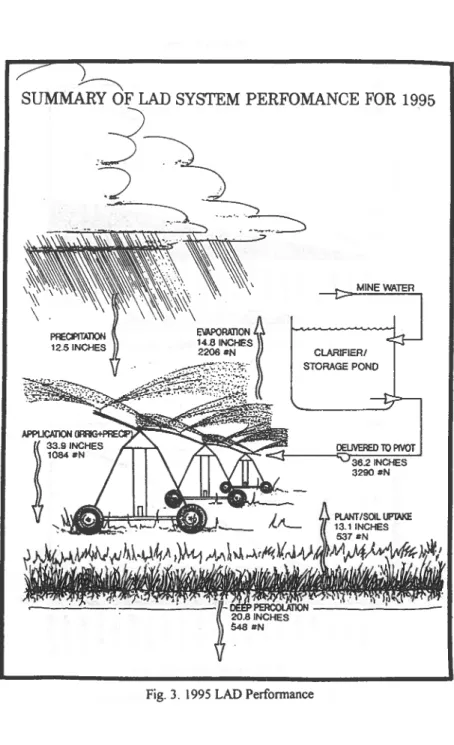
The overall performance of the LAD system can be defined by the amount of nitrogen deep percolating from the LAD area versus the amount of total nitrogen delivered to the system. In 1994 and 1995, the nitrogen utilization efficiencies of the LAD system were 98% and 83%, respectively. The LAD system performance was lower in 1995 than in 1994 due, in part, to a very wet spring season in 1995.
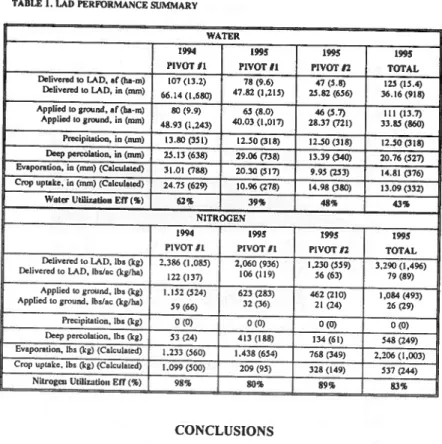
The water utilization efficiencies in 1994 and 1995 were 62% and 43%, respectively. The performance ofSMC's LAD system for 1994 and 1995 is summarized in Table 1. Figures 2-7 show graphical representations of the results for 1994 and 1995. Detailed results of this study are presented in two annual LAD performance reports (HKM Associates, 1994 and MSE-HKM, Inc., 1995). The total annual water delivered to the LAD area exceeded the crop water use potential of the forage, resulting in deep percolation. However, annual nitrogen loads delivered to the LAD area were less than the nitrogen uptake potential of the crop. Therefore, nitrogen utilization efficiencies are significantly higher than the water utilization efficiencies. Total annual nitrogen loads delivered to the pivots averaged 1221bslac (137 kglha) and 791bslac (89 kglha) in 1994 and 1995, respectively. An SCS trial at the Bridger, MT plant materials center found that Garrison Creeping Foxtail has increasing yields with nitrogen application up to 240 Ibslac/yr (270 kg/haiyr) (SCS, ,1979).
~
SUMMARY
jIVCJf NO.1 PERFORMANCE FOR 1994
-J
MINE WATER APPUCATION (IRAG+PllECII""~
~I=~
1130 .N F~*~SUMMAR
3
~STEM
PERFOMANCE FOR 1995
J
~
...-
.... ~ MINE WATER CLARIFIERI STORAGE POND APPlICATION (AlIG+PFlEcP~r~ ~IIN H;]ESiW=~~~~QC':'
Fig. 3. 1995 LAD Performance
DElIVERED 10 PIVOT 362 INCHES 3290 aN
&
--
....
,
....
~ Ha
I! I! CI 0 ~8
III
8
~ 0 0 5123194 5123/94 616/94 6/6/94 'Tl 6120/94 6/20/94.
'Tl ~ 6128194qQ.
6128/94-
~ 715194 ~ 7/5/94 ~ \l)-I
CI\ \l)a
7/12194 \l) 7/12/94 ~ ~I
>D rI.ln
7/19194 ~ 7/19/94n
cn
3 814194 I-A-!
c 814194 I-A t:I c 3!
!!T
8/9194 c 8/9/94 ~<
.
•
Z
[
•
~ CI>~
8/16194~
8/16/94S
-=i
< Ii'~
8123194 CI> 8123194 1:1..,
I
~
~ Q. 0 8130194 !!l.r-
...
(JQ C) CI> rI.l CI> 9/6194..,
9/6/94:=
~ :2 rl1~
EI
~
9/13194a
z
9/13/94;0
9120194 ~.e
9/20194 0) ~. t:..,
9/28/94 No
·
9/28194o
·
~
:2 :2 10nt94 10nt94 0 10/13194 Z 10/13/94 10120194 10120/94 10128194 10128194TABLE 1. LAD PERFORMANCE SUMMARY
WATER
1994 1995 1995 1995
PIVOT 11 PIVOT 11 PIVOTn TOTAL Delivem 10 LAD. af (ha-m) 107 (13.2) 78 (9.6) 47 (5.8) 125 (15.4)
Delivem to lAD, in (mm)
66.14 (1,680) 47.82 (1,215) 25.82 (656) 36.16 (918)
Applied 10 around, If (bo-m) 80 (9.9) 65 (8.0) 46 (5.7) III (13.7)
Applied to ground, in (mm) 48.93 (1,243) 40.03 (1,017) 28.37 (721) 33.85 (860)
Precipitation, in (mm) 13.80 (351) 12.50 (318) 12.50 (318) 12.$0 (318) Deep percolation, in (mm) 25.13 (638) 29.06 (738) 13.39 (340) 20.76 (527)
EVlpot1ltion, in (nun) (Calculated) 31.01 (788) 20.30 (517) 9.95 (253) 14.81 (376)
Crop uptake, in (nun) (Calculated) 24.75 (629) 10.96 (278) 14.98 (380) 13.09 (332)
Wllter UlilIzatloa Err (~) 62~ 39~ 48~ 43~
NITROGEN
1994 1995 1995 1995
PIVOT 11 PIVOTIl PIVOTn TOTAL Delivem to LAD, Ib, (kg) 2,386 (1,085) 2,060 (936) 1.230 (559) 3,290 (1,496)
Delivem to LAD, Ibs/ac (kg/ha) 122 (137) 106 (119) 56 (63) 79 (89)
Applied 10 ground, Ib, (kg) 1.152 (524) 623 (283) 462 (210) 1,084 (493)
Applied to ground. Ibs/ac (kg/ha) 59 (66) 32 (36) 21 (24) 26 (29)
Precipitation, Ib, (kg) 0(0) 0(0) 0(0) 0(0) Deep percolation, lb. (kg) 53 (24) 413 (188) 134 (61) 548 (249)
Evaporation, lb. (kg) (Calculated) 1.233 (S60) 1.438 (654) 768 (349) 2,206 (1,003)
Crop uptake. lb. (kg) (Calculated) 1.099 (500) 209 (95) 328 (149) 537 (244)
Nilrogcu UtiliutiOIl Err (~) 98'11> 80'11> 89'11> 83~