©8 01 01 40 92 ] Sm np op fn up p od Al J PU D S] P1 49 1P A 24 1] fo na or ma y ju nu uy oq ] dit #kk* Fsl*hd k# . . . . I . . . l . . . . . . P * & & så & 8 we i % g
TIRE TECHNOLOGY INTERNATIONAL 7996
Tire Evaluation on Ice
Olle Nordström, Swedish National Road and Transport Research Institute (VTI), Sweden
A specially refrigerated test
facility has been constructed in
Sweden to provide all
year-round evaluation of tire
perfor-mance on ice-packed surfaces.
The facility is available for use
by tire manufacturers,
auto-motive companies and other
interested organisations
ruck and passenger car tire characteristics on low friction surfaces such as ice are still not very well known but are
important, for example, for ABS
perfor-mance evaluation in terms of stability, steerability and braking performance. The VTI tire test facility is a tool for investigations on ice, independent of weather conditions, open for use by both authorities and manufacturers.
The facility has a stationary tire test rig and a moving at test road surface. The equipment is enclosed in a special climate controlled building, but the road surface is refrigerated separately. A general View of the facility is given in Figure 3.
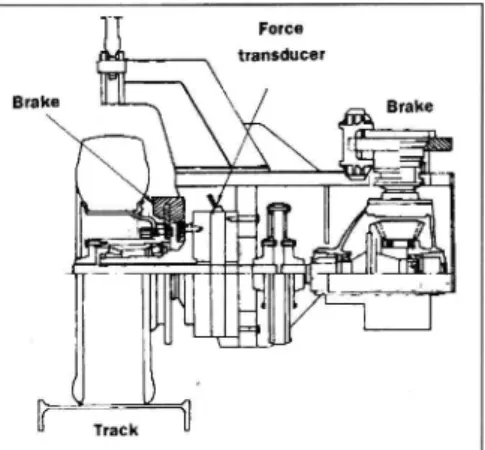
Tire test rig
The tire test rig (Figure 1) consists of a steel frame with a double wishbone
Figure l : Tire test rig (front view)
Force transducer
Track
. Figure 2: Sub-frame with test wheel hub, force
trunsducer and bruke system
wheel suspension resting on a large cen tral roller bearing. This enables the test wheel to be rotated around a vertical axis
for steering tests. The motion is computer
controlled by a hydraulic motor; Side slip angle
The side slip angle can be controlled from a 90° right hand to 30° left-hand steering angle at angular velocities of up to 30° per second
Camber angle
The camber angle can be adjusted manu ally by 10° in both directions by tilting the frame including the force trans ducer system relative to the plane of slip angle rotation.
Wheel load
Wheel loads up to lOOkN are applied by means of a computer controlled hyd raulic cylinder.
Braking system
Two disc brakes can be used for truck tire testing (Figure 2). One is more
Stationary test rig Hydraulic and pneumatic equipment Selfpropelled water tank
Moving
Hydrostatic traction unit steel track trolley for ice coating
v c w x m o a -y x n w x i m n -t h z
Pneumatic pulley with
emergency hydraulic cable
brake tension control
Refrigerator building Control room
Figure 3: VTI flat bed tire test facility
powerful than the other. The most pow-erful brake ampli es its braking torque four times in a gearbox and transmits this braking torque via a shaft to the wheel hub. The maximum braking torque is about SSkNm. When car tires are tested a special wheel suspension and hub with a standard car disc brake is used with a torque capacity of about lOkNm.
Wheelforce and moment
measurement
The forces and moments acting on the test wheel are measured by means of a triaxial force and moment transducer consisting of four triaxial KISTLER piezo-electric transducers pre-stressed in com pression between two stainless steel plates. The test wheel hub is mounted on one of the plates and the other is attached to a sub frame carrying the main braking system (Figure 2). The measuring ranges for the forces are from zero to lOOkN vertical load and up to 70kN for the lateral and longitudinal forces. Moving at bed test track system The road surface is represented by a at steel beam test track 55m long and 0.6m wide. Supported by small steel wheels, the beam travels along an approximately 130m long steel rail track (Figure 3).
Figure 4: Ice laying machine in rest position above
the track tunnel
Figure 5: Ice laying machine in operation
The test wheel load is supported by three steel rollers contained in the base of the test rig. These rollers can be dri-ven by an electric motor at a speed of 50kph for conditioning of the test tire when the track is run to an end position, leaving the rollers free to support the test tire directly.
The VTI tire test facility is
a tool for investigations on
ice, independent of
weather conditions, open
for use by both authorities
and manufacturers
The test track is pulled by an electro hydraulic winch with accumulators. A traction or braking force of 70kN can be applied at speeds of up to 10m/s (36kph). The maximum speed is cur rently limited to llm/s (40kph).
The accumulator power is only used in one direction. To return the track to the starting position, the pumps feed the motors directly which results in a track
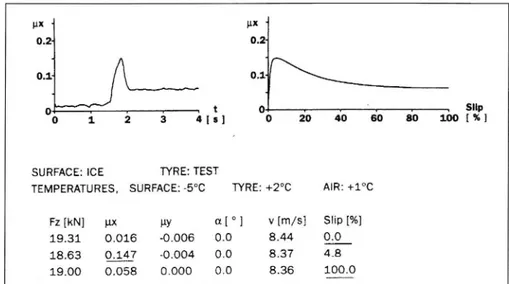
TIRE TECHNOLOGY INTERNATIONAL 7996 rix i 0.24 0.1 0 . 0 1 2 3 4 [ s ]
SURFACE: iCE TYRE: TEST
thkN] wc uy at°i
le '
0.2-0 . . . SIIP
TEMPERATURES, SURFACE: 5°C TYRE: +2°C
although low speed measurements at about 2kph are also used in special cases. At a predetermined point of the test track
' the brake is applied at a rate that pro
0'1
M
duces wheel lock in about 0.5 seconds.
* The wheel remains locked for the rest of
o
20
40
so
so
100 (%]
the test run.
Cooling of the test track
m.m
is achieved with 0
mm sum]
refrigerator system where
19.31
0.016
-0.006
0.0
8.44
0.0
.
.
18.63
0.147
0.004 0.0
8.37
4.8
G glyCOl refrigerant IS
19.00
0.058
0.000 ' 0.0
8.36
100.0
pumped lO Ct pipe Wlll l
Figure 6: Example of result from measurements of braking friction on ice witha295/75R22.5 truck tire at
nozzles in CI channel
l9kN wheel load and 6.5 bar inflation pressure at 30kph
below the test trock
o.2<- 20 a _aoo Mz 0.2- 800 Mz .
uy __ I N'" 1 My. I "ml The results are documented in tabular
0.1- _ 400 0.1. 400 form, specrfyrng the maxrmum (peak)
_ Y friction and locked wheel friction calcu
,_ e . _ _ . j 3 lated according to a slightly modi ed ver
W W t [ s]l- 5 1°Mz 15 0 if 0] sion of the US ASTM Standard E 1557 90.
-"I The results are also shown graphically
both in the form of friction as a function
SURFACE: ICE TYRE: TEST f _ dl . d' l 1, (F 6)
. TEMPERATURES, SURFACE: -4°c
TYRE: -2°c AIR: -3°C
0 me an ongrtu ma 5 1p lgure '
Fz [kN] px ' uy a[ ° ] v [m/s] Slip [%] Mz [Nm] Lateral FrIC'I'lon
59.89 0.019 0.031 0.0 8.10 0.1 -38 Lateral friction is measured in order to
59-09 0018 (ELO 2-1 8-94 0-7 '160 describe the steerability of the tire. The
61'63 0'014 0042 293 8'75 19'3 '133 maximum lateral friction and the lateral
Figure 7: Example of result from measurements of lateral friction on ice with a 3] 5/80 R 22.5 truck tire at
60kN wheel load and 8 bar inflation pressure at 30kph
speed of about Göm/s (1kph). The
return travel time is about three minutes.
The charging of the accumulators usually
takes two minutes.
Refrigergtion and Ice
Generation System
The cooling of the test track is achieved with a refrigerator system where a glycol refrigerant is pumped to a pipe with noz zles in a channel below the test track and sprayed directly onto the under surface of the track when it is in its starting posi tion. Ice temperatures down to about
20°C can also be produced in summer time. The air temperature is controlled by several small refrigerator systems, one of which can also be used for heating the air if the outside temperature is lower than desired. Water for making ice is added successively to the steel track from a self propelled battery powered trolley (Figures 4 and 5) which runs from one
friction at a 20° side slip angle are used as characteristic values. The 20° side slip angle indicates the violence of a lateral breakaway if the peak friction is passed
end of the track to the other using the and for optimum safety the 20° value
edges of the test track beam as rails. should deviate as little as possible from
. _" the maximum value.
Brakmg Frlctlon Measurements are taken at the same
The braking friction of a tire is charac speed and in a similar manner as when
terised by the peak friction value for the braking but steering the wheel instead of
rolling tire and that of a locked wheel. braking. The 5° side slip angle is reached
The test speed is normally 30kph, after one second and 20° after two
sec-Frictlon coef cients My
uyx . . ux * ..0.8- o.s- x 0.4 0.4 ' l ly o . . . . e slip o0 1 2 3 _a time4 ts] o 20 40 60 so 100 t %] uy : Lateral friction ux : Braking friction
Figure 8: Example of result from measurements of combined lateral and braking friction at 4.5° side slip
angle with a 3l 5/80 R 22.5 truck tire on the high friction test track steel surface at 40kN wheel load and
onds. The results are documented in tab ular form specifying speed, wheel load,
maximum lateral friction, and the associ
ated slip angle and lateral friction at a 20° side slip angle. The results are also shown graphically in the form of lateral friction and side slip angle as a function of time and in the form of lateral friction as a function of side slip angle (Figure 7).
Friction Measurement During
Simultaneous Steering and
Braking
This type of measurement is used to study the interaction between lateral and longi-tudinal friction. Each test is run at a con stant side slip angle and the braking force is gradually applied so as to reach the maximum longitudinal friction in about 0.5-1 second. By increasing the side slip angle in phases, the lateral friction can be described both as a function of longitudi-nal slip at different side slip angles and as a function of side slip angle at different levels of braking friction.
The results are presented in a similar way as in the case of braking friction, but with the addition of data on lateral
fric-tion. An example of graphic presentation
is shown in Figure 8.
Results on Ice
Measurements with truck tires have been made on smooth ice and ice roughened with a ne toothed scraper. Tires of a standard type with the dimension 315/80 R 22.5 tested with a wheel load of 40kN on smooth ice polished by locked wheels at 6°C have produced maximum values for braking friction down to 0.05 and
locked wheel friction down close to 0.02,
i.e. extremely low values. In these cases a minor roughening of the ice with the
Test facility data:
Maximum test speed 11m/s
Test wheel load O-100kN
Braking force O 70kN
Lateral force O-70kN
Side slip angle O 90°
Camber angle 10°
Side slip angular velocity O 30°/s
Ice temperature range 0 to -20°C
Maximum wheel
size approx. 1.3m diameter
Ice coating
capacity approx. 6mm/h at
-10°C track temp
Effective measuring
time at max speed about 4 sec
ne toothed scraper increases the maxi mum friction to about 0.2 and the locked wheel value to about 0.05. More typical maximum friction for standard tires on ice is 0.12 and for locked wheel 0.04. Good winter tires have substantially high er values especially for locked wheel with 0.07 as a typical value on smooth
ice at 5°C.
On ice, the repeatability
of locked wheel braking
friction is regarded as
good. The repeatability at
the maximum values is
more variable depending
on temperature and the
type of tire"
Lateral friction measurements have shown similar results. On smooth ice, maximum lateral friction down to 0.08
and 20° side slip angle friction down to 004 have been obtained. Roughening of
the ice in this case increased the lateral
friction to 0.25 and 0.1 respectively.
Extensive studies of passenger car tires have also been carried out and most of the data are available.
High Friction Test Results
Tests have been carried out on the steel
surface of the moving track with truck
tires with dimensions of 315/80 R 22.5
and 275/70 R 22.5. Braking tests with
wheel loads between 10 and 40kN at
50kph showed a decrease in friction with increasing load. The maximum braking
friction decreased from 0.9 to 0.7 and locked wheel friction from 0.7 to 0.4. Lateral friction was measured in the load
range from 10 to 80kN. The maximum lateral friction decreased with increasing wheel load from 1.0 at 10kN to 0.56 at
80kN. At 40kN the maximum value had
already been reduced to 0.6.
Reliability and Validity
On ice, the repeatability of locked wheel braking friction is regarded as good. The repeatability of the maximum values is more variable depending on temperature and the type of tire.
Repeatability on the steel surface was good in all cases despite tangible tire
wear and rubber deposits on the track. Concerning validity, the results of the tests with truck tires on lightly roughened ice agree well with the results from the full-scale eld tests with trucks carried out by VTI. In these tests the maximum value for braking friction was between 0.09 and 0.25 and the friction at locked wheel between 0.07 and 0.09. The maxi-mum lateral friction obtained in full-scale experiments is between 0.12 and 0.52 on smooth ice. The highest outdoor values were obtained at -20°C.
The results from measurements on the steel track are about equal to the average of what has been reported from measure-ments on dry asphalt and concrete roads.
The results from extensive car tire testing also show good correlation with
outdoor vehicle test results (Nordström,
Samuelsson 1990). References
' Nordström, O., Samuelsson E.(1990)
Road grip of winter tires on ice. VYY Report No 354 (in Swedish with extensive English summary) Linköping, Sweden, VYY
' Nordström, 0. (1993) The VYYflat
hed tire testfacility A new toolfor testing commercial tire characteris-tics. SAE technicalpaper series 933006. Reprintedfrom: The influ-ence of Tire, Axle and Bra/ee Characteristics on tmc/e braking and steeringperformance.(SP 1003).
Warrendale, USA, SAE
Olle Nordström was barn in 1935. and graduated as Master of Mechanical Engineering in 1960. Since 1961, he has been active in research, dealing with vehicle dynamics, brakes and tires at the Swedish Road Research Institute (recr-ganzised in 1971 as the Swedish Road and Traf c Research institute - VTI). From 1969, he has been chief engineer and head of the Mechanical Engineering Division and, from 1971, the Road Vehicle Engineering Research Unit since
1970. He has been responsible for heavy
vehicle dynamics research,. including the development of the VTI tire test facility and has also been active in ISO regular tion work on tires, brakes, and steering since 1969. He is a member of SAE, ASTM and a honourary member of iAV'SD (lnt. Assoc. for Vehicle System Dynamics). US NHTSA Award for Safety Engineering Excellence 1991.