ANALYSIS OF VELOCITY VARIATION WITH AZIMUTH (VVAZ) FOR NATURAL FRACTURE AND STRESS CHARACTERIZATION, VACA MUERTA FORMATION,
NEUQUÉN BASIN, ARGENTINA
by
© Copyright by Pablo E. Benitez, 2019
ii
A thesis submitted to the Faculty and the Board of Trustees of the Colorado School of Mines in partial fulfillment of the requirements for the degree of Master of Science (Geology).
Golden, Colorado Date: ________________________ Signed: ________________________ Pablo E. Benitez Signed: ________________________ Dr. Stephen A. Sonnenberg Thesis Advisor Signed: ________________________ Dr. Ali Tura Thesis Advisor Golden, Colorado Date: ________________________ Signed: _______________________ Dr. Stephen Enders Professor and Head Department of Geology and Geological Engineering
iii ABSTRACT
The upper Tithonian – lower Valanginian Vaca Muerta Formation, located in the
Neuquén Basin, Argentina, is one of the most prolific unconventional shale plays in the world. It spans an area of around 30,000 km2, covering four different provinces, Neuquén, Mendoza, La
Pampa, and Rio Negro. Because the unit requires multistage horizontal wells in order to produce commercially, detailed analysis of the regional stress and natural fractures of the area is needed.
Previous studies have shown that both the Neuquén Basin and the Vaca Muerta
Formation are highly affected by stress due to their proximity to the Andes chain, and also that the unit may present a high density of natural fractures. This study is located in a block operated by Wintershall Holding GmbH, where previous research projects focused on natural fractures analysis from well images, seismic inversions for mechanical parameters prediction, and well based anisotropic geomechanical models.
Using well log and wide-azimuth seismic data, analysis for natural fractures and stress characterization was performed. Well based anisotropic geomechanical models were built for the three wells in the area using well logs, laboratory measurements and completion data. Stresses were calculated and calibrated with fracture data. For the studied block, the stress regime in the Vaca Muerta Formation is mainly strike-slip (SH>SV>Sh), with local areas showing normal
(SV>SH>Sh) and thrust (SH>Sh>SV) regimes. In this thesis, the Lower Vaca Muerta section is
recommended as a possible landing zone based on stress and fracability analysis, and considering previous studies and current practices in the basin.
Anisotropy and azimuthal analysis from wide-azimuth seismic data showed that
maximum horizontal stress is oriented between 105º and 120º. It also proved the presence of two sets of extensional fractures oriented at 50º and 150º, formed at different stages during the
iv
development of the basin. All these observations show a reasonable calibration with log and microseismic data.
Finally, following the azimuthal analysis and results from the geomechanical models, new drilling areas and landing points are suggested for the studied block.
v
TABLE OF CONTENTS
ABSTRACT………... iii
LIST OF FIGURES………... vii
LIST OF TABLES………... xiii
ACKNOWLEDGMENTS………. xiv CHAPTER 1 INTRODUCTION………. 1 1.1 Study Objectives……… 1 1.2 Scope of Work...………...……….…… 2 1.3 Dataset………....………...4 1.4 Methodology……….. 8
CHAPTER 2 GEOLOGY BACKGROUND……….……….. 10
2.1 Neuquén Basin………... 10
2.2 Basin Development and Evolution……… 11
2.3 Stratigraphy……….……….….. 13
2.4 Mendoza Group………. 17
2.4.1 Vaca Muerta Formation……….… 18
2.4.2 Quintuco Formation………... 23
2.5 Structure………. 26
2.6 Summary of the Vaca Muerta Project……….………... 27
CHAPTER 3 THE VACA MUERTA PETROLEUM SYSTEM………….…….……... 30
3.1 Vaca Muerta – Quintuco Sequence……….... 30
3.2 Petrophysics………... 31
vi
CHAPTER 4 WELL BASED GEOMECHANICAL MODELS………... 38
4.1 Introduction……… 38
4.2 Stress Logs Calculation………..45
4.3 Summary……… 56
CHAPTER 5 WIDE-AZIMUTH SEISMIC ANALYSIS……… 58
5.1 Overview of VVAZ………... 58
5.2 Seismic Description…....………... 60
5.3 RMS Anisotropy Analysis………. 65
5.4 Interval Anisotropy Analysis………. 69
5.5 Summary………...………. 83
CHAPTER 6 DISCUSSION……….………... 85
6.1 Fracture Formation Theories………. 85
6.1.1 Extensional Fractures………. 85
6.1.2 Shear Fractures………...87
6.1.3 Fractures Due to Hydrocarbon Expulsion……….. 89
6.2 New Well Drilling Locations………. 90
6.3 Summary……… 94
CHAPTER 7 CONCLUSIONS AND SUGGESTIONS…...……….. 96
7.1 Conclusions……….... 96
7.2 Recommendations……….. 96
vii
LIST OF FIGURES
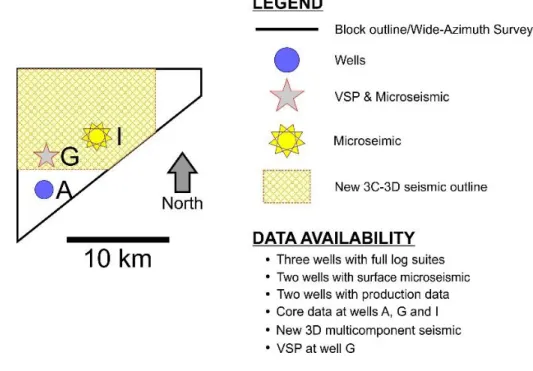
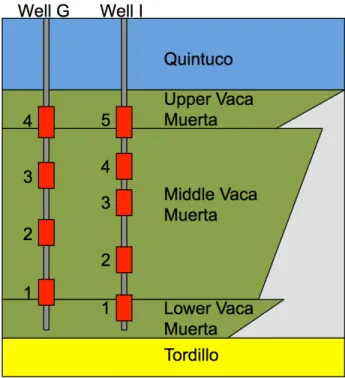
Figure 1.1 Geographical layout of the research area and data available.……….. 4 Figure 1.2 Approximate locations of the stages for both Well’s G and I
(taken from Johnson, 2017)……….. 5 Figure 1.3 Full-fold diagram and offset and azimuth distribution ……… 6 Figure 1.4 Acquisition layout of the survey: east-west lines are sources and
north-south lines are receivers. The color map is the PS fold at 1500 ms (calculated using asymptotic binning with gamma = 2)
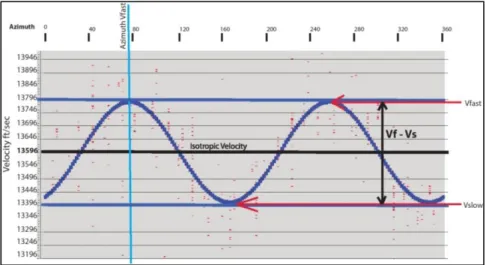
(taken from processing report)………... 7 Figure 1.5 Example of the estimation of Vfast, Vslow, Vfast Azimuth, and Vfast – Vslow
(δalpha≈ HTI anisotropy) (modified from Inks et al., 2014)………. 8
Figure 1.6 Model relating fracture orientation (left) and maximum horizontal stress direction (right) with Vfast azimuth (Curia et al., 2018c)……….. 9
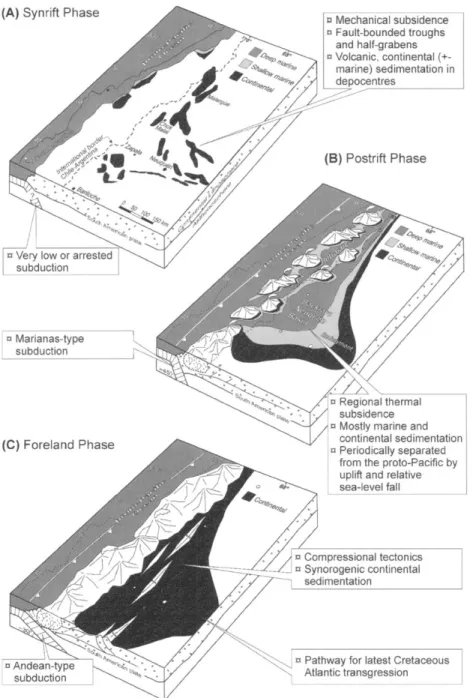
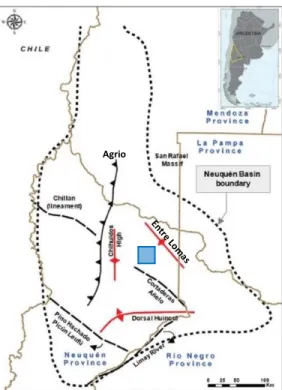
Figure 2.1 Geographic location, geometry and limits of the Neuquén Basin (modified from Sagasti et al., 2014). The square represents the study area ……… 10 Figure 2.2 Tectonic phases of the Neuquén Basin (taken from Howell et al., 2005).
A) Synrift phase (Late Triassic – Early Jurassic), characterized by a rifting previous to the subduction. B) Postrift phase (Jurassic – Early Cretaceous), when a subduction complex is developed west of the South American continent which forms the Andes mountains. This uplift produces
periodic disconnections of the basin from the Pacific Ocean. C) Foreland phase (Late Cretaceous). Uplifting of the Andes belt and development of a fold and thrust belt. Complete disconnection from the Pacific Ocean and periodicAtlantic transgressions.…………...…...…...12 Figure 2.3 Stratigraphy from the Neuquén Basin and sequences for the Lower
Mendoza Mesosequence (modified from Kietzmann et al., 2016). A) Stratigraphic chart for the Neuquén Basin (after Legarreta and Gulisano, 1989). Lithostratigraphic subdivision and environmental interpretations of the Mendoza mesosequence in Neuquén Province. B) Depositional sequences identified by Mitchum and Uliana (1985) and Legarreta and Gulisano (1989) through seismic stratigraphic studies. C) Depositional sequences Identified by Kietzmann et al. (2014) in
viii
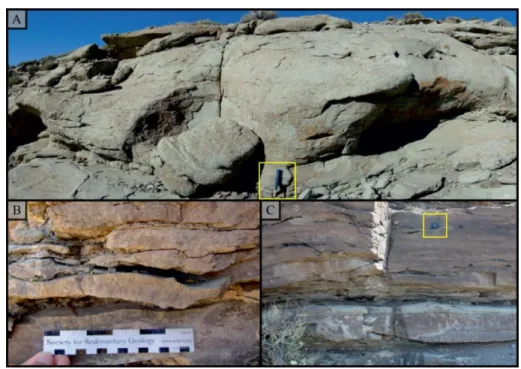
Figure 2.4 Vaca Muerta Formation outcrops. A) Outcrops from Las Loicas, Mendoza province (taken from Benitez, 2015). B) Outcrops from
Yesera del Tromen, Neuquén province………...……... 22 Figure 2.5 Quintuco Formation outcrops from the Sierra de la Vaca Muerta area
(taken and modified from Olivo et al., 2016). A) Sand channel deposits. B) Wave ripples in sandstones. C) Cross-stratified sandstones (Yellow
squares show reference scales)………...……... 25 Figure 2.6 Structural framework in the surrounding area (blue square)
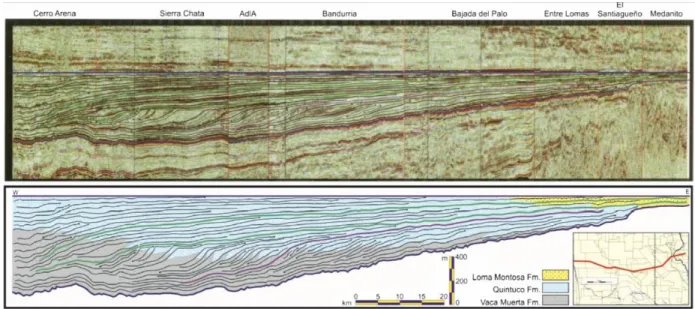
(modified from Curia et al., 2018a)……….. 26 Figure 3.1 Sketched E-W cross section based on a 2D seismic montage covering
approximately 150 km (taken from Sylwan, 2014 and modified after
Leanza et al., 2011)……….. 30
Figure 3.2 Depositional sequences identified by Mitchum and Uliana (1985) and Legarreta and Gulisano (1989) through seismic stratigraphy studies, and depositional sequences identified by Kietzmann et al. (2014) in outcrops from the southern Mendoza area of the Neuquén Basin……….. 31 Figure 3.3 Thermal maturity of the Vaca Muerta Formation. A) Vitrinite reflectance
equivalent (VRE%) map. B) Gas-oil ratio (GOR) map made out of values taken from well initial production (unit: m3/m3). C) Transformation ratio
(TR%) (modified from Sylwan 2014)……….. 34 Figure 3.4 Stress data from Garcia et al. (2013). A) Basin map with reference points.
B) Stress values and regimes for different blocks. C) Stress orientations
for the blocks……… 36 Figure 4.1 Stress components acting on the 3-planes, where e is the strain and σ is
the applied stress……….. 39 Figure 4.2 Anisotropic mechanical models. Vertical Transverse Isotropy (VTI)
model and Horizontal Transverse Isotropy (HTI) model. In the case of VTI, properties in the horizontal plane (X1 – X2) are isotropic, while
they are anisotropic in the vertical plane (X2 – X3). In the case of HTI,
properties are isotropic in the vertical plane (X2– X3), while they are
anisotropic in the horizontal plane (X1 – X2) (taken from
ix
Figure 4.3 Correlations between C11, C33, C44, C66, C13 and C12 from linear
regressions (with interception in “0”)……….. 42 Figure 4.4 Mechanical parameters for Well G. Dots represent calibration points
measured in laboratory. Track 1: Vaca Muerta Formation divisions; Track 2: Lithology from gamma ray spectroscopy tool; Track 3: Dynamic stiffness coefficients in MPSI; Track 4: Static stiffness coefficients in MPSI; Track 5: Dynamic horizontal and vertical Young’s modulus in MPSI; Track 6: Static horizontal and vertical Young’s modulus in MPSI; Track 7: Dynamic horizontal and vertical Poisson ratio; Track 8: Static
horizontal and vertical Poisson ratio……… 45 Figure 4.5 Correlations between Poisson’s ratio (PR) and Young’s modulus (YM).
Left: Expected correlation, with high PR and low YM showing ductile behavior, and low PR and high YM showing brittle behavior (taken from Grazulis, 2016). Right: PR and YM relation seen in the Vaca Muerta Formation in the study area (taken from Convers-Gomez, 2017).
No direct correlation can be seen between the two……….. 47 Figure 4.6 Stress fields and their relative magnitudes (Fox et al., 2013)……….. 49 Figure 4.7 Schematic plots showing sonic transit time (Δt) measured in shale,
the normal compaction trend of the transit time in the normal pressure condition (Δtn), and the pore pressure response to the transit time (Δt)
(taken from Zhang, 2011)………. 50 Figure 4.8 Different fracture geometries created by hydraulic stimulation and their
relation with differential horizontal stress ratio (DHSR) (modified from
Warpinski et al., 2009)………. 51 Figure 4.9 Stress logs for Well A, Well G, and Well I. Dots represent calibration
points from DFIT. Track 1: Vaca Muerta Formation divisions; Track 2: Pore pressure (PPRS - blue), minimum horizontal stress (Sigh - gray), maximum horizontal stress (SigH - orange),
vertical stress (SigV - black), all in PSI; Track 3: Differential horizontal
stress ratio (DHSR) in percentage……… 52 Figure 4.10 Comparison of P50 type curves discriminated by landing zone
(modified from Johanis, 2018)………. 56 Figure 5.1 Full-azimuth reflection angle gathers, showing subtle azimuthal RMO
in the VMF (taken from the processing report). Red box shows a
x
Figure 5.2 Section showing the three wells in the block with markers and horizon
correlation……….……… 61 Figure 5.3 Different structure maps extracted within the Cocina section and
interpreted faults (yellow circles). Left: Variance. Middle: Maximum
curvature. Right: Minimum curvature……….. 62 Figure 5.4 Different structure maps extracted within the middle MVM and
interpreted faults (yellow circles). Left: Variance. Middle: Maximum curvature. Right: Minimum curvature. Maps show less amount of
structures and features……….. 63 Figure 5.5 Different structure maps extracted from the UVM horizon and faults
interpreted (yellow circles). Left: variance. Middle: maximum curvature. Right: minimum curvature………... 63 Figure 5.6 Seismic section showing en echelon normal faults located to the NE
of the block………... 64
Figure 5.7 Well G showing GR log and different markers. To the right windows
used are shown………. 66 Figure 5.8 Histogram of RMS HTI anisotropy magnitudes extracted from various
surfaces……….67 Figure 5.9 Seismic section showing RMS HTI anisotropy magnitudes. It can be seen
that anisotropy values are higher in the VMF, with values as high as 4%, while Quintuco Formation shows values around 1% and 2%……….. 67 Figure 5.10 Seismic section showing RMS Vfast Azimuth. Azimuths remain relatively
constant in the overburden and below the reservoir, the former showing NE directions, while the latter shows SW orientations. Between Quintuco and Tordillo both NE and SE directions are observed, with some areas
showing an E-W azimuth.……… 68 Figure 5.11 Seismic section showing interval HTI anisotropy magnitude. Anomalous
patches of high anisotropy values (50%) and vertical striping can be seen. All these features are physically and geologically unreasonable.……… 70 Figure 5.12 Seismic section showing interval Vfast Azimuth. Azimuths look unstable,
xi
Figure 5.13 Seismic section showing filtered interval HTI anisotropy magnitude. 2D median filter removed most of the vertical striping and reduced patches of anomalous anisotropy values ……….. 72 Figure 5.14 Histogram of interval HTI anisotropic magnitudes extracted from various
surfaces……… 73 Figure 5.15 Seismic section showing filtered interval Vfast Azimuth. 2D median
filter removed most of the vertical stripping and smoothed the
azimuthal variation………... 74 Figure 5.16 HTI anisotropy magnitude and Vfast Azimuth attribute maps extracted in
different sections of the VMF. Background color represents interval HTI anisotropy values, going from the cut-off value of 15% to a maximum
of 50%. Arrows represent interval Vfast Azimuth. Arrow length is constant... 75
Figure 5.17 Rose diagrams of Vfast Azimuth. It is possible to see the main trends in
directions for all the different sections…... 77 Figure 5.18 Directions observed from microseismic in Well G and Well I, depicting a
maximum horizontal stress direction between 100º and 110º. Also, from Guzman et al. (2007) stress directions around the block are close to ESE….. 78 Figure 5.19 Directions observed from FMI and seismic in Well G. Left: Fracture
intensity log from Bishop (2015) and Middle MVM window used for attribute extraction. Middle: Bishop (2015) open natural fractures interpretation from FMI in Well G. Right: Azimuths observed around Well G from seismic. Bars were changed to orange to match open natural fractures directions interpreted by Bishop (2015)……… 79 Figure 5.20 Comparison between microseismic maximum horizontal stress and
fracture directions (orange) observed from horizontal wells landed within the MVM (Curia et al., 2018b) and directions extracted from seismic……… 79 Figure 5.21 Directions observed around Well A and Well I. Orange bars represents a
set of fractures……….. 80 Figure 5.22 Correlation between ant-tracking and directions observed from FMI and
seismic around Well G. Left: Ant-tracking extracted around Well G. Middle: Bishop (2015) fracture interpretation from FMI. Right: Vfast
directions interpreted from seismic. Orange bars represent interpreted open fractures from seismic……….………. 81
xii
Figure 5.23 Ant-tracking map and section around Well G showing a fracture corridor cutting through the Middle MVM section. To the right is Bishop (2015)
fracture intensity log……… 82 Figure 5.24 Ant-tracking maps extracted from in different sections of the VMF………... 83
Figure 6.1 Relationships between stress fields and fracture planes. Extensional
fractures B align parallel to maximum stress vector σ1 (SH). Shear fractures
A and C propagate at an approximate angle of 30º from the maximum
stress vector σ1 (SH) (taken from Hardage et al., 2011)………... 85
Figure 6.2 Relationship between maximum horizontal stress direction through the basin history and fractures interpreted from seismic. Left: Stratigraphic column and tectonic evolution (yellow square indicates VMF – Quintuco deposition times), showing incidence angle of tectonic plates in the Pacific margin (modified from Mosquera and Ramos, 2005).
Right above: Diagram showing convergence angle between Nazca and South American plates for the last 70 My (Paleocene - Quaternary) (modified from Guzman et al., 2011). Right bottom: Rose diagram of Vfast Azimuth extracted from seismic in the Middle MVM around Well G.
The two sets of fractures interpreted from seismic are highlighted…………. 86 Figure 6.3 Shear fractures and their relationship with maximum horizontal stress
direction in a strike-slip regime (σ1>σ2> σ3 = SH>SV>Sh). Left:
Picture taken from Hardage et al. (2011). Right: Picture taken
from Rosello (2018)………. 87
Figure 6.4 Relationship between fractures and maximum horizontal stress, considering shear fractures and strike-slip regimes. Left above and bottom: Diagram modified from Hardage et al. (2011), rotated to match maximum horizontal stress directions from rose diagrams. Right above: Directions interpreted in Middle MVM around Well G from seismic. Right bottom: Directions interpreted from horizontal microseismic within the MVM by
Curia et al. (2018b)………... 88 Figure 6.5 Cocina and Lower MVM maps showing anisotropy and Vfast Azimuths in
areas with magnitudes above 15% (above), and ant-tracking (below). New drilling areas (wells 1, 2, 3 and 4) and horizontal wells are recommended. Wells 1 and 2 are located in areas with possible open fractures, and wells 3 and 4 are located in less fractured zones
xiii
LIST OF TABLES
Table 1.1 Data available for Well A, Well G, and Well I……….. 5 Table 3.1 Comparison between the Vaca Muerta Formation and the main US shale
plays (taken from Askenazi et al., 2013)………... 32 Table 3.2 Petrophysical information of the Vaca Muerta Formation (taken from
Herrero et al., 2014)………... 35 Table 6.1 Parameters calculated in this thesis and public information from the
Vaca Muerta Formation. Main parameters used to define the landing
xiv
ACKNOWLEDGMENTS
First of all, I would like to thank the Colorado School of Mines and the RCP for giving me the huge opportunity to study in this renowned school. The knowledge that I gained during my stay here will be very valuable during my future career. All the people that I have known, all my friends and faculty, will be in my heart forever.
I would like to thank Dr. Stephen Sonnenberg and Dr. Ali Tura for taking me under their wings. Their support and recommendations were always helpful, especially during some of those hard times. Also, the technical discussions that we had during this years were very valuable for my development.
I would like to thank all my friends from the RCP and also from the geology department. We had really good and funny moments, and their insights were always supportive.
Finally, I would like to thank to all my family for their unconditional support. Their love was always a strong motivation for me to keep moving forward. But this could never have happened without the strong support and love from my darling wife. Her company and kindness always comforted me during the hardest times.
1 CHAPTER 1 INTRODUCTION
In 2013, the Reservoir Characterization Project (RCP) at the Colorado School of Mines began a project with the operator Wintershall Holding GmbH: Exploration and development of the Vaca Muerta Formation in the Neuquén Basin, Argentina. This unconventional shale play requires horizontal drilling and massive hydraulic fracturing to produce commercially. Thus a complete reservoir characterization based on well log, core, seismic and completion data, is required. The main focus of the project is to understand the factors that control commercial production, and also to maximize hydrocarbon recovery from the Vaca Muerta Formation through an integrated analysis of geological, geophysical, and engineering data.
1.1 Study Objectives
An extensive reservoir characterization comprising geology, geophysics and
geomechanics is important to improve hydrocarbon recovery of an unconventional play. For this reason, previous research completed by the RCP’s Vaca Muerta Team students has emphasized these studies. In particular, mapping geomechanical parameters, natural fractures, and stresses may significantly improve well placement, horizontal landing points, and hydrocarbon recovery.
Using well log data and wide-azimuth seismic data, the main objective of this study is to identify possible fractured areas and also to understand the regional and local stress conditions in Wintershall’s block by building well based geomechanical models and performing azimuthal analysis. These results will help to improve future well completions and hydrocarbon production.
2
1.2 Scope of Work
To understand the main objectives of this thesis and the processes applied for the
analysis, this chapter begins describing the data set available. Seismic acquisition and processing methods are described. Also, it explains the methodology used for calculation and interpretation of the different parameters employed during this study.
To set the stage for the studies presented in this thesis, Chapter 2 begins by describing the geology of the basin and the area of interest. The Neuquén Basin and the Vaca Muerta Formation are extensively documented in the literature, and analyzing this body of work is the starting point to understand the characteristics and the petroleum potential of the play. Basin development and stratigraphy is described in detail. Also, a structural framework of the basin and the surroundings of the study is given. Finally, a summary of previous research completed by RCP students (Bishop, 2015; Fernandez-Concheso, 2015; Barbosa-Murillo, 2017; Convers-Gomez, 2017; Johnson, 2017) are reviewed to illustrate the progress of the RCP’s Vaca Muerta Project, and also to understand how these can be applied to the present study
Chapter 3 gives background information about Vaca Muerta properties such as maturation, type of oils, geomechanics, stresses, natural fractures, and other parameters. Comparing to US unconventional plays, the Vaca Muerta Formation presents some
characteristics that makes it unique, such as its large areal extension and pay thickness, but also its mechanical characteristics and stress regimes. All these characteristics are explained in detail in this chapter.
Chapter 4 provides an overview on how mechanical parameters and stresses are
calculated from well logs. Shale reservoirs tend to present a strong Vertical Transverse Isotropy (VTI) anisotropy because of their intense horizontal layering, while naturally fractured reservoirs
3
often show Horizontal Transverse Isotropy (HTI) anisotropy due to vertical fractures. Thus, a description of the different types of anisotropy types is presented. Mechanical parameters and stresses are described and calculated considering a VTI medium. Results from the well log analysis such as mechanical paremeters and stresses are shown and interpreted.
Chapter 5 introduces observations from the wide-azimuth seismic data. Azimuthal seismic data analysis can provide valuable information such as the presence of open fractures and the direction of them. But also, it gives information on horizontal stress anisotropy and the direction of the maximum horizontal stress. First, seismic interpretations such as horizons and structures are shown. Then, anisotropy and azimuth attributes are presented. These were extracted from the main stratigraphic surfaces to observe their variation in the area and in the vertical section. Interpretation of results is given.
Chapter 6 discusses the possible origins for the different sets of fractures observed in the data. Fractures may form as extensional fractures parallel to the maximum horizontal stress, or they may form as two sets of shear fractures located at around 30º from it. Another possibility is that fractures might form as microfractures due to the explusion of hydrocarbons. These three different theories are presented and discussed based on the observations from well log and seismic data. Also, new well locations and landing points are suggested based on well log and seismic interpretations.
Chapter 7 summarizes key findings and contributions of this research to the exploration and development of the Vaca Muerta Formation in the studied block. Future suggestions for the Vaca Muerta Project are also given.
4
1.3 Dataset
The data for this project were provided by Wintershall Holding GmbH, as part of an agreement with the Reservoir Characterization Project Consortium (RCP). The data set available is from a block operated by Wintershall, and consist of three vertical wells with full suite of logs, a narrow and wide-azimuth 3D seismic surveys that cover all the block, and a new
multicomponent seismic survey covering an area of 80 km2 (Fig. 1.1). Due to privacy
agreements, information such as depths, well and block names are not given in this thesis.
Figure 1.1: Geographical layout of the research area and data available.
All the wells are located within the wide-azimuth seismic survey, while only two (G and I) are inside the 3C-3D seismic survey. They all present a full suite of logs, while Wells G and I include core data, well images, litho-scanner, sonic-scanner, surface vertical microseismic data, and completion data (Table 1.1). Well G also includes production data, geomechanical
laboratory tests, fracture tests, and a walkaround, walkaway, and zero offset Vertical Seismic Profiling (VSP).
5
Table 1.1: Data available for Well A, Well G, and Well I.
Vertical microseismic on Well G is composed of 4 stages, 3 located within the Middle Vaca Muerta (MVM) and one within the Upper Vaca Muerta (UVM), while microseismic on Well I comprises 5 stages, 1 within the Lower Vaca Muerta (LVM), 3 located in the MVM, and one in the UVM (Fig. 1.2).
Figure 1.2: Approximate locations of the stages for both Well’s G and I (taken from Johnson, 2017).
Well A Well G Well I
Gamma Ray X X X P-sonic X X X S-Sonic X X X Sonic Scanner X X Bulk Density X X X FMI X Petrophysics X X DFIT X X X Laboratory Tests X Microseismic X X Production Data X X X Well Reports X X X Logs Engineering
6
The wide-azimuth seismic survey was acquired in 2016 by UGA Seismic, and time and depth imaging were processed out by Seiscenter. The survey covers almost the entire block. The data is formed of high fold, dense sampling, long offsets and wide azimuth coverage (Fig. 1.3), which allows the analysis of the rock physics and anisotropy behavior of the Vaca Muerta Formation (Curia et al., 2018c).
Figure 1.3: Full-fold diagram (left), and number of traces, offset and azimuth distribution (right) from the processing report.
From the wide-azimuth seismic data, final volumes were given to RCP both in time and depth by Wintershall. These consist of Root Square Mean (RMS) αslow, δalpha, and Vfast Azimuth,
and interval αslow, αfast, δalpha, Vfast, Vslow, and Vfast Azimuth volumes. All these attributes were
calculated as follows: 𝛼𝑠𝑙𝑜𝑤 =𝑉𝑠𝑙𝑜𝑤𝑉−𝑉𝑉𝑇𝐼 𝑉𝑇𝐼 1.1 𝛼𝑓𝑎𝑠𝑡 = 𝑉𝑓𝑎𝑠𝑡𝑉𝑉𝑇𝐼−𝑉𝑉𝑇𝐼 1.2 𝛿𝑎𝑙𝑝ℎ𝑎 =𝑉𝑓𝑎𝑠𝑡𝑉𝑉𝑇𝐼−𝑉𝑠𝑙𝑜𝑤 ≈ 𝐻𝑇𝐼 𝐴𝑛𝑖𝑠𝑜𝑡𝑟𝑜𝑝𝑦 𝑀𝑎𝑔𝑛𝑖𝑡𝑢𝑑𝑒 1.3 Fold - 144 - 20 Traces
7
VVTI represents Vertical Transverse Isotropy (VTI) velocities (refer to Chapter 4 for
definitions) that were used as background for calculation of the other seismic attributes. Vfast and
Vslow are fast and slow seismic velocities for a Horizontal Transverse Isotropy (HTI) medium
(refer to Chapter 4 for definitions), respectively. δalpha is calculated as the difference between
Vfast and Vslow, and could be considered proportional to the anisotropy magnitude for an HTI
medium. In thesis, δalpha will be refered as HTI anisotropy magnitude.
The 3D-3C seismic survey was acquired in 2016 by UGA Seismic and processed in 2017 by Unified Geosystems LLC. In the acquisition, 600 3C receivers were used and set at 120 m apart. The distance between sources was 60 m, and the separation between source lines and receiver lines was 300 and 600 m, respectively (Fig. 1.4). Because of battery and other operational issues, several sources in the southern part of the survey were not acquired.
However, the final azimuthal coverage was sufficient for seismic anisotropy characterization of the Vaca Muerta Formation (Curia et al., 2018a).
Figure 1.4: Acquisition layout of the survey: east-west lines are sources and north-south lines are receivers. The color map is the PS fold at 1500 ms (calculated using asymptotic binning with gamma = 2) (taken from processing report).
8
During the processing, all three components of the data were processed simultaneously in order to treat the data set as a full vector wavefield. Processing concluded with 5D regularization that allowed the filling of gaps in the seismic survey and a regular output more suitable for anisotropy analysis. Using regularized common offset-common azimuth (COCA) gathers, fast shear (Vfast), slow shear (Vslow), and the azimuth of the fast shear were calculated (Fig. 1.5)
(processing report; Curia et al., 2018a).
Figure 1.5: Example of the estimation of Vfast, Vslow, Vfast Azimuth, and Vfast– Vslow (δalpha≈ HTI
anisotropy) (modified from Inks et al., 2014).
This thesis will study the wide-azimuth seismic data. The multicomponent seismic data will be analyzed in detail in another student’s thesis.
1.4 Methodology
The first step in this project was to calculate mechanical properties such as Young’s Modulus (YM) and Poisson’s Ratio (PR), and also the stresses for the three wells in the block. To do that, correlations obtained using laboratory measurements in Well G were used to estimate both dynamic and static YM and PR. Then, stresses where calculated using the static parameters.
9
Since no laboratory measurements were available for Well A and Well I, the same correlations from Well G were used to calculate the mechanical parameters. Finally, dynamic and static properties were calibrated using laboratory measurements, while stresses were adjusted using instantaneous shut in pressure (ISIP) and pore pressure (Pp) values obtained from diagnostic
fracture injection test (DFIT).
On the other hand, as mentioned before, from both the wide-azimuth and 3D-3C seismic data, the Vfast, Vslow, and the azimuth of Vfast attributes can be calculated. The azimuth of the Vfast
tends to be aligned parallel to fracture planes, while if the rock is not fractured it tends to be aligned to the maximum horizontal stress (Hardage et al., 2011) (Fig. 1.6). While the amount of azimuthal anisotropy (Vfast – Vslow) is proportional to either the fracture density or the difference
in horizontal stresses (Liu and Martinez, 2013; Curia et al., 2018a).
Figure 1.6: Model relating fracture orientation (left) and maximum horizontal stress direction (right) with Vfast azimuth (Curia et al., 2018c).
All these attributes can be used to characterize the stress and the presence of natural fractures in an area, which helps to optimize well placement, landing points, and orientation of the horizontal wells within the target (Curia et al., 2018a).
10 CHAPTER 2
GEOLOGY BACKGROUND
2.1 Neuquén Basin
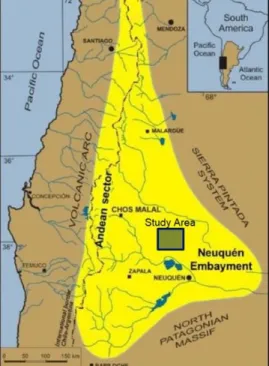
The Neuquén Basin is located on the east side of the Argentinian Andes and in central Chile, between 32° - 40°S latitude and 67° - 70°W longitude. It covers an area of 120,000 km2,
including Mendoza, Neuquén, La Pampa, and Rio Negro provinces (Legarreta and Uliana, 1991, 1996; Yrigoyen, 1991; Leanza et al., 2000; Howell et al., 2005).
The basin limits to the northeast and southeast with the Sierra Pintada system and the Northpatagonic massif, respectively, both of cratonic nature. It is also limited on the west by the volcanic arc with a NNW-SSE orientation which, on the north Chilean locality of Curepto, separates the basin from the “surco de Curepto”. Finally, south of Curepto, the volcanic arc lies on a dorsal emerged during the Jurassic and Neocomian, called Tierras de Conepcion (Cecioni, 1970) or Chubut Dorsal (Aubouín et al., 1973; Chotin, 1977; Digregorio et al., 1984) (Fig. 2.1).
Figure 2.1: Geographic location, geometry and limits of the Neuquén Basin (modified from Sagasti et al., 2014). The square represents the study area.
11
The basin presents a triangular geometry, with two easily recognizable regions: the Neuquén Andes to the west, and the Neuquén Embayment to the east and southeast (Howell et al., 2005).
2.2 Basin Development and Evolution
The Neuquén Basin development began during Permo – Triassic times. Initially, during the Early Permian, an active margin was installed in west Gondwana associated with this supercontinent breakup, acting as a compressive phase called the San Rafael orogenic phase by Azcuy and Caminos (1987). This initial phase was followed by a relaxation period, spanning to the Early Triassic (Llambías et al., 2007). During this stage the Choiyoi Group was developed, composed of andesites, dacites and rhyolites (Kleiman and Japas, 2009). This unit acts as the Neuquén Basin basement from south Neuquén (Turner and Cazau, 1978), to central-west San Juan province (Marín and Nullo, 1988; Nullo and Marín, 1990).
Legarreta and Gulisano (1989), Legarreta and Uliana (1991, 1996) and Vergani et al. (1995) analyzed the evolution of the Neuquén Basin from Late Triassic to the Tertiary and defined three important tectonic phases for its formation: a synrift initial stage (Late Triassic – Early Jurassic), a postrift stage (Early Jurassic – Early Cretaceous), and a final foreland stage (Late Cretaceous – Paleocene) (Fig. 2.2).
The synrift phase initiated because of the regional extension that the Gondwana continent suffered during the Triassic – Early Jurassic lithosphere weakening. This extension produced several retroarc and intracratonic basins along the pacific margin (Legarreta, 2002). During this initial phase, the basin filled with continental and volcanic sediments, generated by the intense extensive volcanism (Riccardi and Gulisano, 1990).
12
Figure 2.2: Tectonic phases of the Neuquén Basin (taken from Howell et al., 2005). A) Synrift phase (Late Triassic – Early Jurassic), characterized by a rifting previous to the subduction. B) Postrift phase (Jurassic – Early Cretaceous), when a subduction complex is developed west of the South American continent which forms the Andes mountains. This uplift produces periodic disconnections of the basin from the Pacific Ocean. C) Foreland phase (Late Cretaceous). Uplifting of the Andes belt and development of a fold and thrust belt. Complete disconnection from the Pacific Ocean and periodic Atlantic transgressions.
13
Later, the opening of the South Atlantic during the Middle Jurassic produced a positive convergence along the South American pacific margin, and a magmatic arc was formed. In this manner, during the Jurassic and Cretaceous (postrift phase) the basin behaved as a retroarc basin, with episodical marine transgressions from the Pacific Ocean (Legarreta and Uliana, 1991; Legarreta, 2002).
Finally, during Late Cretaceous, an increase in the plate’s convergence formed a fold and thrust belt that progrades towards the east, shaping the Andes Cordillera. This way, the basin stayed completely disconnected from the Pacific Ocean, and behaved as a foreland basin (Howell et al., 2005; Ramos and Folguera, 2005).
Finally, Ramos and Kay (2006) described three Cenozoic tectonic phases, all related with variations in the subducted slab inclination: extensive phase (Oligocene – Early Miocene), compressive phase (Middle – Late Miocene), extensive phase (Pliocene – Quaternary), and a final compressive phase (Late Quaternary – today).
The extensive phases are associated with the slope increase in the subducted slab. They are commonly characterized by the presence of a basaltic magmatism as seen in Payenia area, originated during the second extensive phase (Pliocene – Quaternary).
The compressive phases are related to the slope decrease of the subducted slab. This causes the deformation and magmatism to move towards the foreland, plus it causes the inversion of previous structures.
2.3 Stratigraphy
Initially, Groeber (1929, 1946), who studied the Jurassic – Cretaceous successions in the Neuquén Basin, defined three Mesozoic sedimentary cycles: Jurásico, Ándico, and Riográndico
14
cycles (Fig. 2.3). Meanwhile, the first cycle was subdivided in three well differentiated
subcycles, based on the fauna and on the regional facies distribution. Thereby, the Jurásico cycle was divided in Cuyano, Loteniano, and Chacayano subcycles. This cycle spans from the
Hettangian to the middle – upper Bajocian. Furthermore, the Andico cycle, which goes from Tithonian to Coniacian, was also subdivided between the Mendocino, Huitriniano, and
Diamantino subcyles. Finally, the Riograndico cycle was subdivided between the Neuqueniano, Malalhueyano, and Pircaliano subcycles, covering an age from the Pichipicuense to the
Rocanense.
Later, Groeber et al. (1953), considering the zonations and stratigraphic subdivisions previously established (Groeber, 1946, 1947a, b, c), proposed a new chronostratigraphic scheme still in use today. In the Jurasico cycle, the Cuyano subcycle remained unchanged; however, the Loteniano subcycle included the Calovian. On the other side, the Chacayano subcycle was subdivided in Bayense, Manguense, Auquilcoense, and Tordillense, spanning an age that goes from the Oxfordian to the early Tithonian.
This last chronostratigraphic scheme was then modified by Stipanicic (1969), who adapted it to the lithostratigraphic classification system. Thus, the Cuyo Group, the Lotena Formation, and the Chacayense Group were defined. Moreover, this last author divided the Cuyano subcycle, previously defined by Groeber (1946), into a lower and upper sector, both limited by an intraliasic discordance. Ultimately, he put an intermalmic discordance on top of the Jurassic sequence.
Gulisano (1981), who studied the sedimentary sequences in south Mendoza province, redefined the Cuyano cycle used by Groeber et al. (1953). This author also identified a new
15
sedimentary cycle within the Jurassic named Precuyano cycle. This last cycle underlies the Cuyano cycle, and is characterized for including continental deposits.
The Upper Jurassic – Lower Cretaceous sequence stratigraphic framework has been interpreted from low-resolution seismic data. Mitchum and Uliana (1985) defined nine depositional sequences (A to I) for the lower Tithonian – lower Valanginian interval and correlated them to third-order depositional sequences. Legarreta and Gulisano (1989), who studied the sedimentary filling of the basin by the use of sequence stratigraphy, included this set of depositional sequences (Mi1 to Mi9) within the lower Mendoza mesosequence. Mi1 includes
the Tordillo Formation and the basal section of the Vaca Muerta Formation, while the last sequence from the Vaca Muerta – Quintuco system is separated from the Mulichinco Formation by the Intra-Valanginian unconformity or its correlative conformity. These last authors also subdivided the sedimentary filling in depositional sequences, mesosequences and
supersequences. They defined three supersequences: lower, middle, and upper. Each of these supersequences corresponds to the Jurasico, Andico and Riograndico cycles, respectively, previously defined by Groeber (1946). Furthermore, these authors also subdivided each supersequence in several mesosequences. The lower supersequence was subdivided into the Precuyo, Cuyo and Lotena mesosequences. The middle supersequence was divided into the Lower Mendoza, Middle Mendoza, Upper Mendoza, Huitrin, and Rayoso mesosequences. Finally, the upper supersequence comprises the Neuquén and Malargüe mesosequences (Fig. 2.3).
More recently, Kietzmann et al. (2014) defined five composite depositional sequences (CS-1 – CS-5) in outcrops from the southern Mendoza area of the Neuquén Basin based on
16
sequence stratigraphy. Kietzmann et al. (2016) also defined five composite depositional sequences from outcrops in the Chos Malal fold and thrust area, in Neuquén province.
Figure 2.3: Stratigraphy from the Neuquén Basin and sequences for the Lower Mendoza Mesosequence (modified from Kietzmann et al., 2016). A) Stratigraphic chart for the Neuquén Basin (after Legarreta and Gulisano, 1989). B) Lithostratigraphic subdivision and environmental interpretations of the Mendoza mesosequence in Neuquén Province. C) Depositional sequences identified by Mitchum and Uliana (1985) and Legarreta and Gulisano (1989) through seismic stratigraphic studies. D) Depositional sequences identified by Kietzmann et al. (2014) in outcrops from the southern Mendoza area of the Neuquén Basin.
The stratigraphy and evolution of the Neuquén Basin was studied by several authors, some of them are Legarreta et al. (1981, 1993), Legarreta and Uliana (1991, 1996, 1999), Vergani et al. (1995), Uliana et al. (1999), Spalletti et al. (2000), Palma et al. (2009, 2012), Bressan (2011), Kietzmann et al. (2011, 2014), among others.
17
The following stratigraphic characterization comprises only the Vaca Muerta – Quintuco system. Both of them are included in the Andico cycle of Groeber (1946), and in the Lower Mendoza Mesosequence of Legarreta and Gulisano (1989).
2.4 Mendoza Group (Stipanicic et al., 1968)
This unit was defined by Groeber (1946) as Mendociano, a term that was modified by Stipanicic (1969), who named it Mendoza Group. Legarreta and Gulisano (1989) include this unit within the Mendoza Mesosequence. Furthermore, these last authors divided the Mendoza Mesosequence in three shallowing – upward cycles: Lower Mendoza (upper Kimmeridgian – lower Valanginian), Middle Mendoza (lower Valanginian), and Upper Mendoza mesosequences (lower Valanginian – lower Barremian).
The Mendoza Group is limited on the base by the Intramalmic discordance (Gulisano et al., 1984b) or Araucanic (Stipanicic and Rodrigo, 1970a, b), of Kimmeridgian age. Meanwhile, the top is limited by the Pampatrilic discordance (Leanza, 2009), described first by Stipanicic and Rodrigo (1970b).
In central Neuquén Basin, the lower Mendoza mesosequence starts with the continental deposits of the Tordillo Formation (Kimmeridgian – lowermost lower Tithonian), which underlay marine basinal deposits of the Vaca Muerta Formation (uppermost lower Tithonian – upper Berriasian to lower Valanginian). To the east, the basinal facies change to shoreface deposits of the Quintuco Formation (upper Tithonian – lower Valanginian), to the sabkha deposits of the Loma Montosa Formation (lower Valanginian) and to the continental deposits of the Puesto Gonzalez Formation (lower Valanginian), forming a mixed carbonate – siliciclastic depositional system (Mitchum and Uliana, 1985; Carozzi et al., 1993) (Kietzmann et al., 2016).
18
This unit is characterized by a large fossil record, described by various authors like Leanza (1945), Leanza and Hugo (1977), Riccardi (1983, 1984, 2008a, b), Riccardi et al. (1990a, b, 1993, 1999, 2000, 2011), Agirre-Urreta et al. (1999, 2005, 2007, 2011), and Zeiss and Leanza (2008, 2010), among others.
2.4.1 Vaca Muerta Formation Background
This unit was initially defined by Weaver (1931) to describe a group of Tithonian age beds, composed by dark shales and limestones, and characterized by a large fauna of ammonites. Later, based on the recommendation of Fosa Mancini et al. (1938) to use the denomination “Formacion (de la) Vaca Muerta”, the term was widely used in the geological literature by YPF geologists in the 40s decade (Leanza et al., 2011). Then, Groeber (1946) named it
Vacamuertense, including it in the Andico cycle, and assigning it an early – middle Tithonian age.
Some authors like Marchese (1971) and Digregorio (1972) divided the unit into two different formations: the Vaca Muerta Formation (Tithonian) and the Quintuco Formation (Berriasian - lower Valanginian). These formations are easily distinguisheable in the Sierra de la Vaca Muerta area, but are difficult to differentiate them when moving away from this locality. Lately, Leanza (1973) extends the Vaca Muerta Formation to the base of the Mulichinco Formation in Neuquén province, or to the base of the Chachao Formation in south Mendoza province (Leanza et al., 1977; Leanza 1993).
For the Rio Salado area, Leanza et al. (1977) suggested the use of Formacion Mendoza, term initially proposed by Dessanti (1973). In this manner, they took the Vaca Muerta and
19
Chachao formations to the categories of members, and stablished a new member, Cieneguitas, as a lateral equivalent of the Agrio Formation in the Neuquén province. These definitions have not been widely used in the literature, thus the Leanza (1973) definition was kept in use by following geologists.
Areal Distribution
The Vaca Muerta Formation is widely distributed in the Neuquén Basin, and extends from the Piedra del Aguila region (south of Neuquén province), through the Picun Leufu and Chacaico areas (east and west of Neuquén, respectively) (Leanza et al., 2011), reaching the north of Mendoza province (Legarreta et al., 1993), and in subsurface to the Rio Negro province (Gonzalez Tomassini et al., 2015).
Lithology characteristics and sedimentary environment
The Vaca Muerta Formation is composed of decimeter-scale rhythmic alternations of marls, bituminous shales and limestones (Scasso et al., 2002, 2005; Kietzmann et al., 2011, 2014, 2015), the latter described as bioclastic mudstones, wackestones, packstones and floatstones (Kietzmann et al., 2008; Kietzmann and Palma, 2009) (Fig. 2.4).
The Vaca Muerta Formation deposits generated from the inundation of the basin, when distal platform shales deposited under restricted and anoxic waters, favoring the preservation of organic matter (Legarreta and Uliana, 1991, 1996).
The sedimentary environment of this unit was traditionally interpreted as basin and slope deposits by various authors like Leanza (1973), Mitchum and Uliana (1985) and Legarreta and Uliana (1991, 1996) for the Embayment area. For the Chos Malal area, Kietzmann et al. (2016)
20
described the Vaca Muerta Formation as a distal low-gradient carbonate ramp. In Mendoza province, Kietzmann et al. (2008, 2011, 2014), Kietzman and Palma (2009a) and Kietzmann (2011), defined the unit as a homoclinal carbonate ramp system, showing basin, outer and middle ramp deposits.
The deposition depth of the Vaca Muerta Formation was estimated by Mitchum and Uliana (1985) based on seismic clinoforms, getting a bathimetric range of 250 m for the
Embayment area. A similar value was obtained by Leanza et al. (2011) based on the fauna. For the south Mendoza province area, Kietzmann et al. (2008) estimated a depth less than 200 m, based on the radiolarian ratio proposed by Kiessling (1996), while Kietzmann and Palma (2009a) estimated a range between 30 and 120 m based on fauna analysis.
The Vaca Muerta Formation is characterized for a high organic matter content that makes it very interesting, since it acts as the most important source rock for conventional and
unconventional hydrocarbon reservoirs of the Neuquén Basin (Legarreta et al., 1993). The high organic matter content (2% - 12%) might suggest dysaerobic – anaerobic sea-bottom conditions as a result of a stratified water column and positive hydrological balance in the Neuquén
Embayment (Legarreta and Uliana, 1996). According to Spalletti et al. (2000) these conditions may be associated to an interchange of anoxic waters with the Pacific Ocean, where an oceanic upwelling was produced and thus, an important minimum oxygen layer was formed, which helped to preserve the organic matter. The Pacific upwelling could have affected the Neuquén Embayment with secondary gyres detached from the main oceanic current (Scasso et al., 2002, 2005).
The Vaca Muerta Formation presents a marked rhythmicity, formed by shale-limestone or marl-limestone rhyhtmites. The origin of this rhyhtmites is associated with carbonate material
21
transport from shallow areas, and its periodicity lies within the Milankovitch cycle frequencies band (Scasso et al., 2005; Kietmann et al., 2011, 2015).
Stratigraphic relations and thickness
To the north of the Huincul Dorsal, the base of the Vaca Muerta Formation shows a sharp contact with the continental deposits of the Tordillo Formation. On the south, the unit overlies the Quebrada del Sapo Formation, while around the Huincul Dorsal area it can be found on top of the Lotena and Lajas formation. In some areas, like Estancia Santa Isabel, the unit lies directly on Precuyo deposits (Cucchi and Leanza, 2005; Leanza et al., 2011).
The Vaca Muerta Formation underlies the Carrin Cura Formation near Catalan Lil river, and the Picun Leufu Formation near the Picun Leufu anticline area. In the Sierra de la Vaca Muerta area it changes to shoreface deposits of the Quintuco Formation. Meanwhile, in northern Neuquén it has a discordant contact (Intravalanginian unconformity) with the Mulichinco
Formation (Leanza et al., 2011).
The thickness of the unit varies across the basin. At the depocenter it can reach a maxim of more than 600 m. In the Picun Leufu depocenter it attains thickness of more than 150 m. Meanwhile, in the Chiuidos and Huincul uplifts the unit shows local minimums (Sylwan, 2014). North of the Neuquén Basin, in Mendoza Province, several sections studied by Kietzmann et al. (2014) reached thickness from 130 to 350 m.
Fossil content and age
The Vaca Muerta Formation is characterized by a large fossil record, composed by ammonites, bivalves, radiolarians, foraminifers, and marine vertebrates (Spalleti et al., 1999).
22
Various Upper Jurassic – Lower Cretaceous ammonites biozones schemes were
proposed. The first attempt was performed by Gerth (1925). It was then followed by numerous schemes, like the ones proposed by Burckhardt (1930), Windhausen (1931), and Weaver (1931). Finally, Leanza (1945), who performed a detailed study of the Upper Jurassic – Lower
Cretaceous ammonite fauna in the Sierra Azul, Mendoza province, proposed a biostratigraphic scheme that is widely used today. This scheme was later adopted and improved by Leanza (1981a, 1981b, 1996). Thus, the ammonite biozonation scheme for the Tithonian – Valanginian in the Andean sector includes the Virgatosphinctes mendozanus, Pseudolissoceras zitteli,
Aulacosphinctes proximus, Windhauseniceras internispinosum, Corongoceras alternans and
Substeuroceras koeneni biozones for the Thitonian, the Argentiniceras noduliferum, and
Spiticeras damesi for the Berriasian, and finally, the Neocomites wichimanni, Lissonia riveroi,
Olcostephanus (O.) atherstoni, and Pseudofavrella angulatiformis biozones for the Valanginian.
Figure 2.4: Vaca Muerta Formation outcrops. A) Outcrops from Las Loicas, Mendoza province (taken from Benítez, 2015). B) Outcrops from Yesera del Tromen, Neuquén province.
Based in the large biostratigraphic information of the Vaca Muerta Formation, the unit was defined as early Tithonian – early Valanginian in the Neuquén province (Leanza, 1973,
23
1981a; Leanza and Hugo, 1977; Leanza and Wiedmann, 1989; Aguirre-Urreta and Rawson, 1999). In Yesera del Tromen, Puerta Curaco, and Cerro Caicayen, Kietzmann et al. (2016) defined the unit as early Tithonian (Virgatosphinctes mendozanus zone) – early Valanginian (lowermost part of the Neocomites wichimanni zone). In south Mendoza province, Kietzmann and Palma (2009a, 2009b, 2011, 2014) and Kietzmann et al. (2014) dated the unit as early Tithonian (Virgatosphinctes mendozanus zone) – early Valanginian (lower portion of the
Olcostephanus (O.) atherstoni zone).
2.4.2 Quintuco Formation Background
The Quintuco Formation was originally defined by Weaver (1931) to characterize Early Cretaceous dark shales and limestones, which is enriched in sandstones at the top. The Quintuco shales and the limestones and carbonaceous shales described by Weaver (1931) in the Neuquén Basin depocenter and in the Lotena and Picun Leufu areas, respectively, were difficult to
differentiate from the lower Vaca Muerta Formation for mapping purposes (Leanza et al., 2011). This situation was advertised by Leanza (1973) who grouped the latter in the Picun Leufu Formation, which spans from Middle Tithonian to Early Berriasian, and extends through the southeast of the Neuquén Basin. Furthermore, Leanza (1973) proposed to extend the Vaca Muerta Formation to the base of the Mulichinco Formation in depocenter areas (Leanza et al., 2011).
The term “Quintuco” has been used for different meanings, both for surface and subsurface descriptions. Quintuco sensu stricto (s.s.) is a term used to describe nearshore siliciclastic outcrops covering the black shales of the Vaca Muerta Formation along the basin.
24
While, on subsurface, the name Quintuco Formation is employed to describe all the sediments that go from the top of the Vaca Muerta Formation to the base of the Centenario Formation (Leanza et al., 2011).
Areal distribution
The new definition of this unit proposed by Leanza et al. (2011) reduced its geographic distribution only to central Neuquén province expositions, where outcrops in the Sierra de la Vaca Muerta highlight.
Lithology characteristics and sedimentary environment
The Quintuco Formation was described by Weaver (1931) as being composed of dark shales and limestones, with gradual sandstone enrichment towards the top. Later, Leanza et al. (2011) proposed a new lithological characterization. These authors analyzed the unit in the Sierra de la Vaca Muerta, where it was described as a upward-shallowing succession consisting of marine siliciclastic deposits with storm, tidal and wave influence. In the same area, Olivo et al. (2016) described prodelta, delta front, and delta plain facies, dominated by fluvial process and slightly influenced by waves (Fig. 2.5). Along the Chos Malal fold and thrust belts, Kietzmann et al. (2016) interpreted the Quintuco Formation as a mixed siliciclastic and carbonate shelf
depositional system.
Stratigraphic relations and thickness
The basal contact of the Quintuco Formation is gradual and regionally challenging to identify (Sylwan, 2014). In Sierra de la Vaca Muerta the Quintuco s.s. Formation lays
25
concordantly on top of the Vaca Muerta Formation, while the top of the unit is associated with a regional discontinuity (Intravalanginian unconformity) which separates the deltaic deposits of the Quintuco s.s. Formation from the continental deposits of the Mulichinco Formation.
To the east of the Mallin Quemado area, the unit shows a thickness of 350 m. In Puerta Quintuco it reaches less than 30 m, while in depocenter areas, the unit is absent.
Fossil content and age
Fossil content in the unit is scarce, formed mainly by bivalves, ammonites, and fossil traces associated with Skolithos, Repichnia, and Cruziana ichnofacies.
Based on their new lithological characterization, Leanza et al. (2011) proposed a late Berriasian – early Valanginian age for the Quintuco Formation. In the Chos Malal fold and thrust belts sections, based on ammonite biostratigraphic data, Kietzmann et al. (2016) dated the unit as early Valanginian (uppermost part of the Neocomites wichimani and Lissonia riveroi biozones).
Figure 2.5: Quintuco Formation outcrops from the Sierra de la Vaca Muerta area (taken and modified from Olivo et al., 2016). A) Sand channel deposits. B) Wave ripples in sandstones. C) Cross-stratified sandstones. (Yellow squares show reference scales).
26
2.5 Structure
The Neuquén Basin presents various structural features such as the Agrio fold and thrust belt, the Huincul Dorsal, and the Chihuidos and Entre Lomas highs, among others. These last two structures surround the study area (Fig. 2.6).
Figure 2.6: Structural framework in the are surrounding the study area (blue square) (modified from Curia et al., 2018a).
The Agrio fold and thrust belt is a strip of outcropping Jurassic and Lower Cretaceous rocks, some 50 km wide (Ramos, 1978). Across the belt, folds and reverse faults trend either north or northwest (Cobbold and Rossello, 2003). Early workers interpreted the structure as thin-skinned folding, due to detachment on evaporite or shale (Bracaccini, 1970a; Ramos, 1978; Allen et al., 1984). While recent research has proposed a thick-skinned deformation, due to reactivation of Mesozoic normal faults (Manceda and Figueroa, 1995; Zapata et al., 1999).
The Huincul Dorsal is a complex structure that presents a high angle trend to the orogen. It is formed by a northwest-dipping normal fault of Triassic to Jurassic age that was reversed in
27
the Late Cretaceous, separating the basin in two during Albian times (Cobbold and Rosello, 2003). The dorsal is a good candidate for a structural trap; in fact, several oil fields follow the crest (Cruz et al., 2000).
Los Chihuidos and Entre Lomas fault systems played a key role in the tectonic history of the Neuquén Embayment. Both were formed during the Jurassic and Early Cretaceous, but with different local stress and uplift histories. The Los Chihuidos High is a series of grabens and half-grabens formed by crustal attenuation during Late Triassic – Jurassic rifting (Vergani et al., 1995), which were inverted by transpression during the Jurassic and Early Cretaceous (Mosquera and Ramos, 2006). It is considered a good prospect with many oil fields found on its crest
(Cobbold and Rosello, 2003). The Entre Lomas system consists of a series of NW-trending symmetric anticlines and associated E-W-trending structures. This system extends 200 km from north to south and is 100 km across. During Jurassic times, the western flank of the Entre Lomas system was uplifted by inversion of half-grabens. In the Late Cretaceous and then during the Miocene, inversion of structures were more pronounced and anticlines formed (Mosquera and Ramos, 2006).
Even though the study area is surrounded by structural highs, it does not present a high degree of structural complexity. However, some normal and strike-slip faults can be identified, affecting different stratigraphic levels (Curia et al., 2018a).
2.6 Summary of the Vaca Muerta Project
As mentioned in the introduction chapter, RCP’s Vaca Muerta Project began in 2013 with the operator Wintershall as sponsor. For this project five Master’s of Science thesis have been written to date, four of them being on geophysics and one on geology. The general objective of
28
the project is the exploration and development of the Vaca Muerta Formation (VMF) using an interdisciplinary approach of geology, geophysics, and engineering. Core, logs, seismic and completion data has been widely used, and it is still being used, to characterize the VMF play with the objective of improving well placement, landing points, and also help to increase production.
The first two students were Jorge Concheso and Kyla Bishop. Fernandez-Concheso (2015) thesis was based on a narrow-azimuth, regional P-wave seismic volume. He performed post-stack and pre-stack inversions for geomechanical parameters estimation, in order to be able to analyze the variability of these and how they relate to lithology, stress state and TOC. He concluded that rock composition has a strong influence on the mechanical behavior of the VMF.
Bishop (2015) study was based on well log analysis. She worked with 5 wells, inside and outside of our study area. Composition analysis were performed to study the vertical variation of minerarology along the formation. Using borehole images such as Oil Based Micro Imager (OBMI) and Formation Micro Imager (FMI) tools, she interpreted pre-existing natural fractures, stress directions, and discontinuities. Her work concluded that clay content is fairly constant along the VMF, while silica, carbonate and TOC show metre scale variability. From image logs she observed that the Middle Vaca Muerta (MVM) is the most fractured section, with both conductive and resistive fractures being present. Conductive fractures described in Well G show N50º and N145º. Because of the hydrocarbon saturation, presence of open fractures, and its brittleness, Bishop suggested MVM as a highly prospective zone.
29
Barbosa-Murillo (2017) was based on well log analysis and laboratory tests. She built an anisotropic model for Well G and integrated it with previous natural fracture analysis done by Bishop (2015), microseismic and production data.
Convers-Gomez (2017) built different correlations between Young’s Modulus (YM), Poisson’s Ratio (PR), and TOC. He also predicted lateral and vertical heterogeneity of rock properties in the VMF using neural networks. The conclusion of his work is that there is a strong correlations between brittleness and YM, however, PR shows low correlation with brittleness and YM, thus for the VMF only YM is sufficient as a brittleness indicator. Also, mapping geomechanical parameters, he concluded that the most prospective zones are located in the MVM and in a thin section between Middle Vaca Muerta and Lower Vaca Muerta (LVM).
Johnson (2017) performed geostatistical analysis of well logs, seismic inversions, and microseismic. His thesis concluded that stimulation of the rock volume correlates with TOC, YM, bulk modulus, and shear modulus. He also assed the relationship between geomechanical parameters and microseismic events observed in Well G and Well I.
Current projects are based on seismic anisotropy using wide-azimuth and
multicomponent seismic analysis. This thesis’ goal, as mentioned in the introduction, is to build well based geomechanical models for all the wells in the block to better characterize the vertical variation of the reservoir. Also, perform anisotropy and azimuth analysis in relation to the presence of natural fractures and stresses using wide-azimuth seismic data. On the other hand, Corwin’s studies are focused on a joint PP-PS inversion using the newly acquired
30 CHAPTER 3
THE VACA MUERTA PETROLEUM SYSTEM
3.1 Vaca Muerta – Quintuco Sequence
The Vaca Muerta – Quintuco system has been studied in a sequential manner by several authors. Mitchum and Uliana (1985) defined nine depositional sequences (A to I) for the lower Tithonian to lower Valanginian interval (Kietzmann et al., 2016). These authors integrated available subsurface data and interpreted a progradation of the system from SE, near Neuquén city subsurface, to NW, near the Chiuidos Dorsal (Fig. 3.1). This set of sequences is composed by three main stages: an Early to Middle Tithonian ramp, a Late Tithonian to Berriasian slope interval, and finally, a platform interval for the Valanginian sequences (Leanza et al., 2011).
Figure 3.1: Sketched E-W cross section based on a 2D seismic montage covering approximately 150 km (taken from Sylwan, 2014 and modified after Leanza et al., 2011).
Legarreta and Gulisano (1989) included the previous set of sequences (Mi1 to Mi9) within
the lower Mendoza mesosequence (Fig. 3.2). The first sequence defined by these authors (Mi1)
31
top of the last depositional sequence of the system is marked by the Intravalanginian unconformity, which separates the Vaca Muerta – Quintuco system from the Mulichinco
Formation (Gulisano et al., 1984a; Leanza, 2009; Schwarz and Buatois, 2012) (Kietzmann et al., 2016).
More currently, Gonzalez Tomassini et al. (2015) who studied the subsurface of central Neuquén embayment, recognized 5 transgressive – regressive sequences for the Vaca Muerta – Quintuco interval. A similar number of sequences were recognized by Kietzmann et al. (2016), who defined 5 composite depositional sequences and 15 high-frequency depositional sequences in the Chos Malal fold and thrust belt area. For the southern Mendoza sector, Kietzmann et al. (2014) also identified 5 composite depositional sequences (CS-1 to CS-5) and 15 high-frequency depositional sequences (HFS-1 to HFS-15), which together show a regressive trend (Fig 3.2).
Figure 3.2: Depositional sequences identified by Mitchum and Uliana (1985) and Legarreta and Gulisano (1989) through seismic stratigraphy studies, and depositional sequences identified by Kietzmann et al. (2014) in outcrops from the southern Mendoza area of the Neuquén Basin.
3.2 Petrophysics
Argentina has large unconventional hydrocarbon resources estimated at 27 billion barrels of crude oil (BBO) for shale oil (EIA, 2013) and 800 trillion cubic feet (TCF) for shale and tight gas (Barredo and Stinco, 2014). It is estimated that the Vaca Muerta Formation has more than 16
32
BBO of risked technically recoverable oil (EIA, 2013) and 220 TCF of recoverable gas (Barredo and Stinco, 2014).
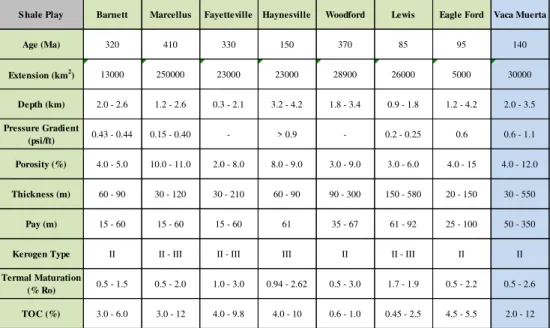
The Vaca Muerta Formation has exceptional characteristics that make it one of the most important shale oil/gas plays in the world. The areal distribution of the play reaches about 30,000 km2, with a variable thickness that goes from 30 m to more than 500 m in the West sector of the
basin (Table 3.1). Taking into account a total organic carbon (TOC) cut off of 2%, the play thickness reduces to 250 m. This last characteristic is one of the most remarkable features of the play since no other shale play in the world presents such value (Askenazi et al., 2013).
Table 3.1: Comparison between the Vaca Muerta Formation and the main US shale plays (taken from Askenazi et al., 2013).
Some authors have divided the Vaca Muerta Formation into two distinct sections: Lower Vaca Muerta (LVM) and Upper Vaca Muerta (UVM) (Askenazi et al., 2013; Cuervo et al., 2014; Lazzari et al., 2014; Sagasti et al., 2014; Sylwan, 2014). The first presents higher TOC (3 to 11%, media of 6.1%) and gamma ray (GR) values, with a thickess of 5 – 35 m; the latter shows
S hale Play Barnett Marcellus Fayetteville Haynesville Woodford Lewis Eagle Ford Vaca Muerta
Age (Ma) 320 410 330 150 370 85 95 140 Extension (km2) 13000 250000 23000 23000 28900 26000 5000 30000 Depth (km) 2.0 - 2.6 1.2 - 2.6 0.3 - 2.1 3.2 - 4.2 1.8 - 3.4 0.9 - 1.8 1.2 - 4.2 2.0 - 3.5 Pressure Gradient (psi/ft) 0.43 - 0.44 0.15 - 0.40 - > 0.9 - 0.2 - 0.25 0.6 0.6 - 1.1 Porosity (%) 4.0 - 5.0 10.0 - 11.0 2.0 - 8.0 8.0 - 9.0 3.0 - 9.0 3.0 - 6.0 4.0 - 15 4.0 - 12.0 Thickness (m) 60 - 90 30 - 120 30 - 210 60 - 90 90 - 300 150 - 580 20 - 150 30 - 550 Pay (m) 15 - 60 15 - 60 15 - 60 61 35 - 67 61 - 92 25 - 100 50 - 350
Kerogen Type II II - III II - III III II II - III II II
Termal Maturation
(% Ro) 0.5 - 1.5 0.5 - 2.0 1.0 - 3.0 0.94 - 2.62 0.5 - 3.0 1.7 - 1.9 0.5 - 2.2 0.5 - 2.6 TOC (%) 3.0 - 6.0 3.0 - 12 4.0 - 9.8 4.0 - 10 0.6 - 1.0 0.45 - 2.5 4.5 - 5.5 2.0 - 12
33
lower TOC (0.5 to 5%, media of 2.05%) and GR values, with thickness of up to 600 m (Sylwan, 2014).
Other authors have divided the unit into three sections: Lower Vaca Muerta (LVM), corresponding to an inner carbonate platform that consists mostly of marls, carbonates and limestones; a Middle Vaca Muerta (MVM), related to slope deposits, with higher siliciclastic content than the other two sections; and Upper Vaca Muerta (UVM), which returns to a
carbonate platform environment (Garcia et al., 2013; Ejofodomi et al., 2013, 2014; Badessich et al., 2016).
The kerogen type that constitutes the Vaca Muerta Formation is not homogeneous and it varies depending on the distance to the coast and depth of deposition. The unit is composed mainly by amorphous organic matter, associated with marine microplankton and scarse
participation of terrestrial material (Uliana et al., 1999). According to Pepper and Corvi (1995) organofacies classification, this kerogen may be considered of type B and A, respectively. These also can be equivalent to type II and II/II “S” kerogen from Tissot et al. (1974) classification, and later contribution of Orr (1986) (Sylwan, 2014).
Estimating the thermal maturity is complicated because it is problematic to find vitrinte particles, since the Vaca Muerta Formation was deposited in a deep marine environment (Sylwan, 2014). Other methods to obtain a vitrinite reflectance equivalent (VRE) may be used. One possible way is the VRE calculation based on Tmax values, established by Jarvie et al. (2001). Another possible method is the estimation of the gas-oil ratio (GOR). This value rises as source rock matures, thus giving an idea of the maturity of the rock. Yet, another way to estimate the maturity of the source rock is the transformation ratio (TR) developed by Jarvie et al. (2007), in which the percentage of generative organic matter that has been converted to hydrocarbon is