Institutional repository of
Jönköping University
http://www.publ.hj.se/diva
This is an author produced version of a conference paper presented at the The 7th
International Conference on Wireless Communications, Networking and Mobile
Computing. This paper has been peer-reviewed but does not include the final publisher
proof-corrections or journal pagination.
Citation for the published paper:
Johansson, Alf; Wei Shen; Youzhi Xu, ”
An ANT based Wireless Body Sensor
Biofeedback Network for Medical E-Health Care”
Proceeedings of the 7th International Conference on Wireless Communication
Networking and Mobile Computing, 2011
ISBN: 978-1-4244-6250-6
DOI: http//dx.doi.org/
10.1109/wicom.2011.6040656
Access to the published version may require subscription.
Published with permission from: IEEE
*
An ANT based Wireless Body Sensor Biofeedback
Network for Medical E-Health Care
Alf Johansson
Department of Electrical Engineering School of Engineering Jonkoping University, Sweden Email: alf.johansson@jth.hj.se
Wei Shen
Department of
Information Technology and Media Mid Sweden University, Sweden
Email: wei.shen@miun.se
Youzhi Xu
Department of Electrical Engineering School of Engineering Jonkoping University, Sweden
Email: youzhi.xu@jth.hj.se
Abstract—This paper presents an ultra low power wireless
insole sensor biofeedback and gait analysis system for rehabili-tation of balance control for post stroke patients and gait related rehabilitation. The system integrates ANT wireless protocol, a wireless home E-health care sensor network and open-source mobile device technology. The paper also presents methods to time synchronize the two sole sensors. The system has been evaluated and it shows good performance in power consumption, communication latency, coexistence with WiFi/BlueTooth/GSM.
I. INTRODUCTION
With advances in low-power and low-cost wireless sensor network (WSN) technologies and the growing needs in ap-plications based on these technologies, wireless body area network, WBAN becomes a hot research issue. A WBAN is a radio frequency based networking technology that in-terconnects tiny nodes with sensor or actuator capabilities in, on, or around a human body, in which the transmissions of these nodes typically cover a short range of about 2m [4]. There are many applications of WBANs, e.g. sports, entertainment, health care, etc. In the area of E-health care, WBANs play an important role in monitoring patients with chronic disease, monitoring hospital patients, monitoring el-derly patients, monitoring patients at disaster scenes and so on. Researchers interested in WBANs have been developing different kinds of platforms to establish health monitoring systems. The CodeBlue project [5] at Harvard is a hardware and software platform including a pulse oximeter, an EKG and a motion-activity sensor, and other medical sensors. Tekscan has developed the F-Scan system [2] that enables bipedal dynamic in-shoe pressure distribution analysis. It includes foot pressure sensor units, USB data cables, and analysis software. However, it is a wired system which limits users activity range; it is inconvenient while walking or running attached with these devices. According to World Health Organizations statistics, million people, especially the elderly, suffer from walking diseases every day. The proposed system can be used to provide a real-time biofeedback of pressure distribution on plantar surface during stance phases of gait, which is useful to diagnose and treat these diseases. It will also be possible to use this system as a biofeedback system for motion limitations after hip surgery and for balance control for post stroke patients. For balance control the Sole Integrated Gait
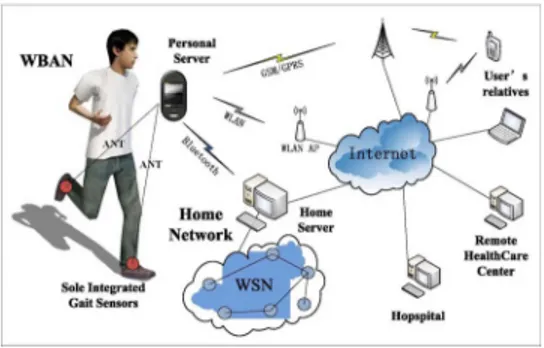
Fig. 1. Architecture of SIGS system
Sensors (SIGS), and two 3-axis accelerometers are used to predict body motions that indicate a risk of falling. Different types of biofeedback can be used e.g. audio signals to alert the patient.
This paper presents an ultra low-power wireless foot pres-sure sensor biofeedback system to help doctors and patients to analyze gaits for diagnosis and treatment of walking problems and for fall prevention. This system has the scalability to be in-tegrated with a WSN for E-Health Care. It has been evaluated through analysis of the power consumption, communication latency, coexistence with IEEE802.15.4 and WLAN devices, and the tolerance of signal fading from human body. The rest of this paper is structured as follows. Section II describes the system architecture. Design and implementation are discussed in Section III. Section IV presents the experiments and eval-uates the performance. Section V concludes the paper.
II. ARCHITECTURE
The system architecture is shown in Fig. 1. A star-topology WBAN is used, which includes a central node and two leaf nodes. A leaf node consists of a foot pressure sensor and a transceiver unit, which is located in shoes; a Personal Server together with a transceiver unit is the central node, which can be attached to users belt or hanged on his/her chest. The leaf nodes continuously transmit data when they are in active state i.e. triggered by the movement sensors. The Personal Server has the function of data analysis and generates biofeedback signals like an audio warning signal or a tactile signal. This
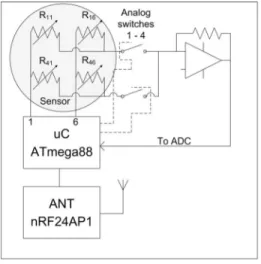
Fig. 2. Sole Integrated Gait Sensor
WBAN is connected via WiFi or Bluetooth to a Home Server. The Home Server, displaying and recording foot pressure distribution, coordinates these collected data from home to the remote health care center, users relatives, or hospitals.
III. DESIGN ANDIMPLEMENTATION
The central node and the pair of leaf nodes connected to-gether via wireless channel form a network in which the nodes may communicate with one another. The WBAN Gateway as a bridge builds communication between WBAN and Home Server or other networks. The implementations of various part will be discussed as below. In the SIGS system the Tekscan sensor is used together with a wireless sensor node designed especially for this project. Fig. 2 shows a block diagram of the sensor node and Fig. 3 shows a picture of the sensor node and the attached F-Scan insole sensor.
A. Tekscan-sensor
The F-Scan wired system from Tekscan company has been widely used both in the clinical and biomechanical studies due to its dynamic response towards pressure loading. The F-Scan sensor consists of two polyester films coated with printed conductive silver wires in a matrix. In the cross points between horizontal and vertical wires squares of pressure sensitive ink are printed. The conductance 1/R of an element is an almost linear function of the force F.
B. Sole Integrated Gait Sensor
In SIGS application the sensor elements are arranged in a matrix with six columns and four rows. Digital outputs of a micro-controller activate one column at a time. Analog switches (transmissions gates) select one of four rows to be connected to a current to voltage conversion circuit. An AD converter in the micro-controller is used to measure the voltage output for each group of sensors. Twenty four values are captured. The twelve values for the toe part and twelve values for the heal part are added and scaled to form two words of
Fig. 3. Sensor node with Tekscan sensor
data that are sent to the Personal Server via ANT network. The ANT transceiver and the micro-controller communicate over a synchronous serial interface. The SIGS sensor unit is powered by a coin cell, so power consumption must be minimized. Most of the time the processor and the radio chip are in sleep mode with just timers running. The scanning of the sole sensors is synchronized to the TDMA scheme. A movement detector is used to turn off the SIGS when it is not in use.
C. Wireless transceiver and ANT protocol
The nRF24AP1 is an ultra-low power single-chip radio transceiver with embedded ANT [1] protocol for personal area networks, which RF operating frequency range is within the 2.4-2.5GHz ISM band. In the SIGS application, the nRF24AP1 board is interconnected with a foot pressure sensor unit to form a leaf node (Fig. 3). ANT is an ultra-low power embedded RF protocol, with short range and low data rate (1Mb/s). It uses Gaussian Frequency Shift Keying (GFSK) modulation and TDMA-based communication, which will avoid collision and improve channel utilization and power efficiency. ANT is a good selection for such a small size network and periodic data collection. In our application, broadcast data type is used, which is one of data types supported by ANT protocol. On each dedicated channel time-slot, data from both foot pressure sensor units are sent to the central node that is attached to the Personal Server/WBAN Gateway. There are two independent ANT channels; one for each sole sensor. The DLL and PHY characteristics for each channel are programmed into the ANT chip. The radio frequency and the message rate is the same for the two channels i.e. the channels share the TDMA cycle. ANT uses an adaptive isochronous scheme which implies that any free time slot can be used. In the data payload two bytes are reserved for time stamping (or sequence number) and the remaining four bytes are used for sole load data.
D. Time Synchronization of Sensors
The ANT protocol uses a rather high bit rate (1 Mbit/s) but rather low message rate (4, 8, 16 .. messages/s). The low message rate gives a low power consumption but there is a trade-off between power consumption and dynamic response. The ANT protocol uses an adaptive isochronous co-existence
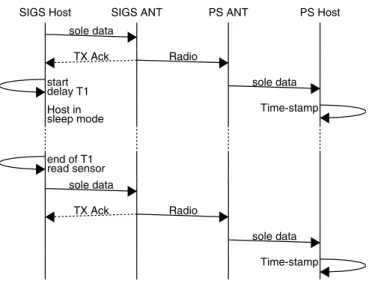
SIGS Host SIGS ANT PS ANT PS Host sole data Radio TX Ack sole data start delay T1 Host in sleep mode Time-stamp end of T1 read sensor sole data Radio TX Ack sole data Time-stamp
Fig. 4. MSC for receiver time-stamping
scheduling scheme. This means that an ANT transmitter peri-odically sends in a time slot as long as there is no interference with other radio activities in that time slot. Depending on the isochronous scheduling scheme the skew between the sampling points for the two sensors can be up to TT DMA×2−1
where TT DMA is the period of the TDMA cycle. If for example the message rate of the sole sensors is 8 Hz the maximum skew is around 60 ms.
SIGS Host SIGS ANT PS ANT PS Host sole data Radio TX Ack sole data Calculate Sampling point Trig info T2 Radio Reverse Ch Trig info T2 start delay T2 Host in sleep mode
common sampling point end of T2 read sensor delay T3 sole data Radio TX Ack sole data Time-stamp
Fig. 5. MSC for Triggered Sampling
To reduce the power consumption a Broadcast data type is used and there are no retransmissions. Loss of data packets will result in asynchronous data streams for left and right sole sensor.
1) Sequence Numbers: If the sole sensors add sequence numbers to the data packets, the receiver can synchronize the two data streams in case of lost packets. Missing data packets will be filled with mean estimatednt data. There is no improvement in synchronization time skew with this method. 2) Time-stamping at receiver: To reduce latency and jitter sampling of the sole sensors can be done just before the data is transmitted. When the ANT-chip sends a message on the radio channel it also sends an Ack back to the host which after a fixed delay T1 makes a new sampling of the sensor. T1 is chosen so the slack before next transmission is as short as possible (Fig. 4). The SIGS Host micro-controller is in sleep mode during T1. By time-stamping as early as possible at the receiver it is possible to estimate when a sensor was sampled. In a SIGS system where there are no external disturbances the used time-slots is not changed until there is a clash between the two channels. Depending on clock oscillator drift the slots for the two channels can interfere after a while. A time-slot with guard-band is in the order of millisecond. A rough estimation of how often there is a need of re-scheduling with 50 ppm oscillator crystals and a maximum time-skew of 1 ms:Tre−sch≥ 10−3/(2 × 50 × 10−6) = 10, i.e expected
re-scheduling is in the order of seconds
As the delay between the signals from left and right foot can be calculated it is possible to estimate new signals with zero delay. The simplest way is to use one of the signals as reference and interpolate the other signal for matching sampling-points. Assume the two sampled signals X[n] and Y[n] and that sampling of Y[n] is delayed dTs compared
to X[n]. dTs is from an Y-sample to the nearest X-sample, dTs = Tsy[n] − Tsx[n]. A new corrected signal Z[n] is
calculated.
Z[n] = Y [n]+dTs×TT DMA−1 ×(Y [n+1]−Y [n−1])×2−1 (1)
There is a linear interpolation and the slope of the line segment is the mean value of the segment before and after the sampling point.
3) Triggered Sampling: When time-stamping at the re-ceiver is performed the samplings are synchronized with the corresponding time-slot in the ANT-communication and the isochronous scheduling gives a varying delay between the two sensors. In order to synchronize the samplings of the two sole sensors without delays a global sample command is needed. In the ANT-protocol Broadcast data can be combined with a Reverse Channel. If the Reverse Channel is used for every message, the power consumption is doubled. But from above it is seen that new trig information needs to be updated not more often than every 10 seconds. If, for example, the reverse channel is used once per second then the increase in power consumption is 18.
The Personal Server Host micro-controller time-stamps the data messages from the two sole sensors (Fig. 5) and from
Fig. 6. Personal Server with ANT
these time-stamps calculates a sampling point that has a min-imum distance to the two time-slots used. The sampling point relative the time-slot is the delay T2. The Reverse Channel is used to send T2 (T 2left andT 2right) to the two sensors. T2
is the SIGS Host micro-controller sleep time before sampling the sensor and T3 after sampling the sensor.
E. Sole sensor node power estimation
The ANT protocol has a low power consumption depending on rather high bit rate and rather low message rate. In appli-cations where low power is required it is important to have the lowest possible message rate. The SIGS Host controller is only in active mode when it scans the sensors and when it communicates with the ANT chip. The host controller mean current is therefore low compared to the ANT mean current. With the broadcast data type and a message rate of 8 Hz, the esimated mean current is less than 500 µA. If the Reverse Channel is used to control the sampling of the sensors and if the update rate is 1 Hz; the mean current is increased less than 50 µA. Please refer to the power estimator [1].
F. Personal Server
In this application, Neo FreeRunner [3] from First In-ternational Computer, Inc. (FIC) is chosen to act as a Personal Server in the WBAN network. Neo Freerunner is an open smart mobile phone platform which utilizes GNU/Linux/Android. It also features a 2.8 480*640 VGA touch screen, WiFi, GPRS 2.5G, Bluetooth 2.0, two built-in tri-axis accelerometers, and more. The Personal Server can store sole data in different formats like binary files and XML-files. The ANT Radio is external to the Smart-phone and interfaced through USB and therefore any Smart-phone with USB can be used as Personal Server in the SIGS system.
1) ANT to Smartphone Interface: In this project a special ANT dongle has been developed ( Fig. 6). The dongle contains an ANT chip, nRF24AP1, from Nordic Semi and a Host controller, ARM Cortex M3. The interface between the Host
controller and the Smart-phone is USB, which is integrated in the ARM-processor. Besides being an USB communication in-terface the Host controller handles the receiver time-stamping and receiver triggered sampling. A picture of the smart-phone and the ANT dongle is shown in Fig. 7.
2) Smartphones with ANT and Android: Manufacturers of communication chips for Smart-phones have started to include the ANT protocol [1], [6] and no special hardware will be required to implement the Personal Server in (at least some) Smart-phones.
IV. EXPERIMENTS ANDPERFORMANCEANALYSIS
A. Functional tests
The SIGS system has been tested under different conditions. The main focus has been on synchronization of data streams from two sole sensor nodes, but the system functionality in general is also tested. The ANT protocol is robust and can coexist with WiFi/BlueTooth/GSM/3G. The Message Error Rate is low enough for the application.
B. Performance tests
The proposed methods for time synchronization of the sensor nodes (left and right foot) have been evaluated. In the test setup the two sole sensors are stacked so that they both measure the same load.
1) Sequence Numbers and Time-stamping at Receiver: Fig. 8 shows a short sequence of a varying load. The left sensor is the reference and the right sensor values are just paired with the left sensor values when they are received. Sequence numbers detect lost frames. From the raw data file it was seen that the right sensor was sampled 55 ms before the left one and therefore the right values are lower on a rising signal and higher on a falling signal. When the right sensor is compensated for a small difference in gain and Equation (1) is used to estimate the values of the right sensor when the sampling points are advanced 55 ms; the
Fig. 8. Receiver time-stamping
Fig. 9. Receiver Triggered Sampling
Right(corr) graph is found. It can be seen from the Fig. 8 that the correlation is rather good and calculated values for Root Mean Square Errors, RMSE, are presented in Table I. The RMSE for uncorrected right sensor compared to left sensor is 9.5% but for the corrected right sensor it is 3%.
2) Receiver Triggered Sampling: In this setup the receiver is programmed to calculate and send (on Reverse Channel) T 2left and T 2right to the two sole nodes to get concurrent
sampling of the sensors. The right sensor values Right(corr) are only compensated for a small difference in gain. Fig. 9 shows the good correlation and the RMSE is 2.5%. (Table I).
V. CONCLUSION
In this paper an ANT based wearable gait analysis and biofeedback system has been presented. The ANT protocol has been shown to be a suitable WBAN for health-care featuring low power, low latency and good reliability. Because
TABLE I
MATCHING LEFT AND RIGHT SENSORS
Synch. method RMSE %
Transmitter Sequence number 9.5 Receiver Time-stamping 3.0 Receiver Triggered Sampling 2.5
of the high transmission rate compared to the message rate; the sensor node is only active for a small portion of time which has major impact on low power consumption. The TDMA access method gives little time jitter for the data sampling but it must be complemented with time stamping to take care of lost data frames and time-synchronization skew. Receiver Triggered Sampling gives the best matching between the sensors but time-stamping at receiver and re-sampling of one of the sensors also gives good matching. A high message rate gives best matching but the drawback is increased power consumption. It has also been shown that open-source mobile devices are suitable platforms to construct Personal Servers for WBAN in a biofeedback gait analyzing system. The system has good performance in power consumption, communication latency, coexistence with both GSM/WiFi and BlueTooth. The constructed SIGS is intended to be used in a research project where gait and body motion analysis shall be used to predict falling for post stroke patients and the biofeedback capability shall be used to help the patients to avoid falling.
ACKNOWLEDGMENT
This work has been supported by Assistant Professor Nerrolyn Ramstrand at Department of Rehabilitation, School of Health Sciences, Jonkoping University, Sweden
REFERENCES
[1] ANT Wireless, Dynastream Innovations Inc. http://www.thisisant.com [2] http://www.tekscan.com/medical/system-fscan1.html
[3] http://wiki.openmoko.org/wiki/Neo FreeRunner
[4] Huasong Cao; Leung, V.; Chow, C.; Chan, H.Enabling technologies for wireless body area networks: A survey and outlook ,Communications Magazine, IEEE Volume 47, Issue 12, Dec. 2009 Page(s):84 - 93. [5] V. Shnayder et al., Sensor Networks for Medical Care, Harvard Univ.
tech. rep. TR-08-05, Apr. 2005.