Master Thesis within Business Administration
Authors: Amanda Ekström
Niclas Gustafsson
Tutor: Tomas Müllern
Jönköping 2012
CONSUMERS’ ATTITUDES TOWARDS
PRINTED GREEN ADVERTISING
Master Thesis in Business Administration
Title: Consumers’ attitudes towards printed green advertising - A study of attitudes among Swedish consumers
Authors: Amanda Ekström, Niclas Gustafsson
Tutor: Tomas Müllern
Date: 2012-05-14
Subject terms: Advertising-in-general, Green advertising, Attitude, The Ducoffe
Ex-tended Model, Swedish Consumers
Abstract
Introduction
With the increased interest and awareness toward environmental issues among Swedish consumers, their demands on what constitutes value in advertisements have also changed. Advertising-in-general is often regarded as a rather unwelcomed intrusion and a source of irritation by consumers and a common reason is that many advertisers have overdrama-tized or even spread false claims about products, causing great skepticism among consum-ers. With the increase of environmentally minded consumers, it is of great importance for advertisers to understand the particular differences between advertising-in-general and green advertising and how to approach the two differently for desired effect. Are there cer-tain factors perceived to be more important in green advertising than in advertising-in-general and how could it affect current techniques used by advertisers?
Purpose
The purpose of the thesis is to examine and compare Swedish consumers’ attitudes toward advertising-in-general and green advertising found in printed media.
Method
To fulfill the purpose of the study, a quantitative research approach was selected. A questionnaire was distributed electronically to measure the attitude toward advertis-ing-in-general and green advertising among Swedish consumers. Several statistical analyses were applied to the data to test the generated hypotheses to enable findings and a discussion on the research questions of the study.
Findings and Conclusion
The study suggested that there are perceived differences in certain factors among Swedish consumers, when comparing advertising-in-general to green advertising. New groupings of already-existing factors were also discovered, indicating a need for a development of the existing model with a focus on green advertising. Managerial implications concerned the continued development and focus upon providing a high level of informativeness and credibility, in advertisements with environmental claims.
Acknowledgements
We would like to state a special thank-you to our tutor Tomas Müllern for guidance, sup-port and knowledgeable feedback during the different stages of the research process. The enthusiastic support and guidance by Adele Berndt, through dark moments of statisti-cal analysis, made it possible for us to reach our goal.
Furthermore, a big thank-you to our fellow-students who during the spring-term of 2012 provided feedback and comments on the developing stages of the thesis.
Finally, dear family and friends, a warm thank you for your encouragement and inspiration during the most stressful moments of completing our Master Thesis.
Amanda Ekström Niclas Gustafsson
i
Table of Contents
1
Introduction ... 1
Background ... 1 1.1 Problem discussion ... 2 1.2 Purpose ... 3 1.3 Research questions ... 3 1.4 Delimitations ... 3 1.5 Definitions ... 3 1.6 Methodology ... 4 1.7 Disposition ... 4 1.8 Introduction... 4 1.8.1 Method ... 4 1.8.2 Theoretical Framework ... 4 1.8.3 Empirical Findings ... 4 1.8.4 Analysis ... 4 1.8.5 Conclusion ... 4 1.8.62
Method... 6
Deductive and inductive research orientations ... 6 2.1
Research approaches ... 6 2.2
Quantitative and Qualitative research ... 7 2.3 Collection of data... 8 2.4 Primary data ... 8 2.4.1 Questionnaire ... 8 2.4.2 Questionnaire design ... 9 2.4.3 Formulation of statements ...10 2.4.4
Scales and statements used ...10 2.4.5 Coding of statements ...11 2.4.6 Codebook ...11 2.4.7 Sampling ...11 2.4.8 Pilot study ...12 2.4.9 Data analysis ...12 2.5 Standard deviation ...12 2.5.1 Normal distribution ...12 2.5.2
Null hypothesis and alternative hypothesis...13 2.5.3
Two Sample t-test ...13 2.5.4 Factor analysis ...13 2.5.5 Correlation analysis ...14 2.5.6 Validity of data ...14 2.6
Construct and criterion validity ...15 2.6.1
Removing risks ...15 2.6.2
Reliability of data ...16 2.7
ii
3
Theoretical Framework ... 18
Advertising ...18 3.1
How does advertising work? ...18 3.1.1
Motives and appeals in advertising...19 3.1.2
Emotional and rational appeals in advertising ...20 3.1.3
Green advertising ...20 3.2
Attitudes toward the ad ...21 3.3
The Ducoffe Extended Model (DEM) ...22 3.4 Entertainment ...23 3.4.1 Informativeness...24 3.4.2 Irritation ...25 3.4.3 Credibility ...25 3.4.4 Advertising value ...26 3.5
The role of demographics in attitude ...27 3.6
4
Empirical findings ... 29
Descriptives ...29 4.1
Mean values of factors ...29 4.2
Normal distribution ...30 4.3
Result of Paired sample tests ...31 4.4 Result of demographics ...31 4.5 Testing of hypotheses ...32 4.6 Entertainment ...33 4.6.1 Informativeness...33 4.6.2 Irritation ...33 4.6.3 Credibility ...34 4.6.4 Advertising value ...34 4.6.5 Demographics ...35 4.6.6 Correlations ...36 4.7
Important factors in green advertising ...37 4.8
Factor analysis ...37 4.9
“New” factors in green advertising ...37 4.9.1
5
Data Analysis ... 39
Entertainment ...39 5.1 Informativeness ...41 5.2 Irritation ...43 5.3 Credibility ...43 5.4 Advertising value ...45 5.5 Demographics ...47 5.6 Income ...48 5.6.1 Age ...48 5.6.2 Additional findings ...48 5.76
CONCLUSION... 49
iii
Managerial implications ...50 6.1
Suggestions for further research ...50 6.2
iv
List of Table and Figures
Table 2-1 Factors of the Questionnaire ...10
Table 2-2 Codebook ...11
Table 2-3 Cronbach Alpha Values for Factors ...16
Figure 3-1 The Ducoffe Extended Model (DEM), 2001 ...23
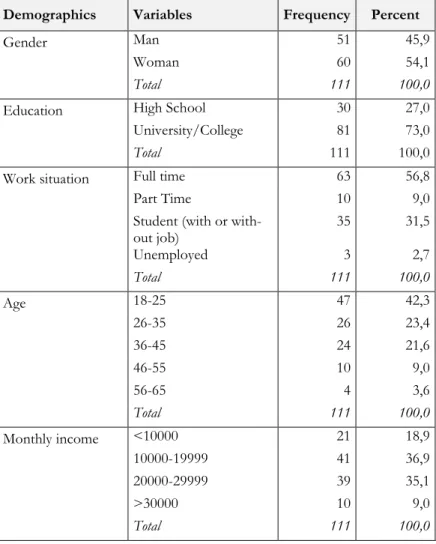
Table 4-1 Demographic Profile of Population ...29
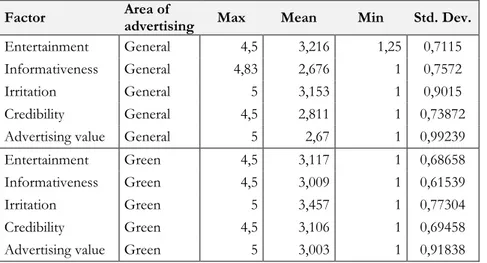
Table 4-2 Mean Values of Factors ...30
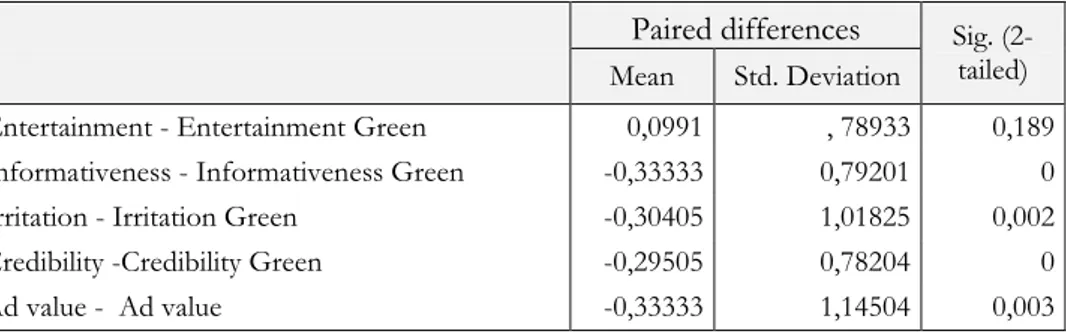
Table 4-3 Paired Sample T-test ...31
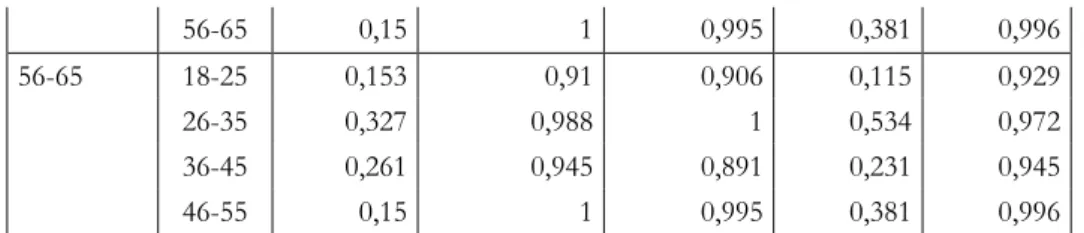
Table 4-4 TUKEY - Age ...32
Table 4-5 TUKEY - Income ...32
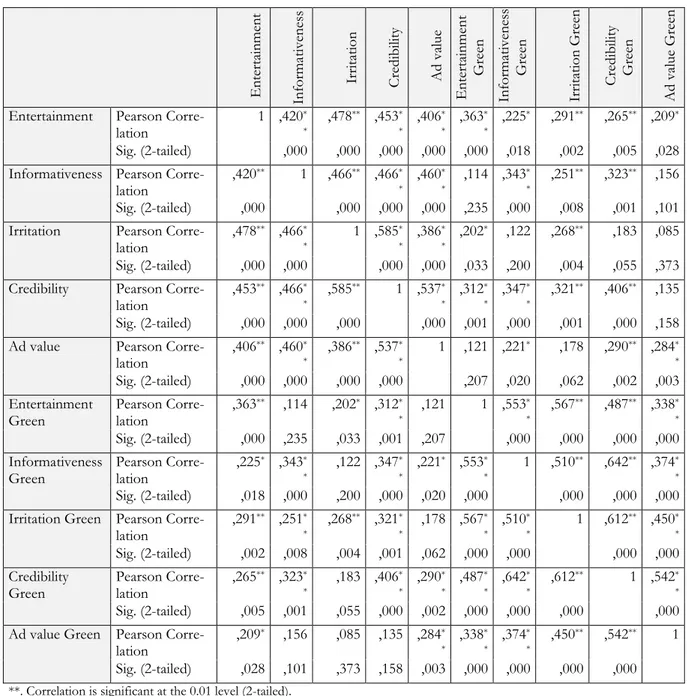
Table 4-6 Correlations ...36
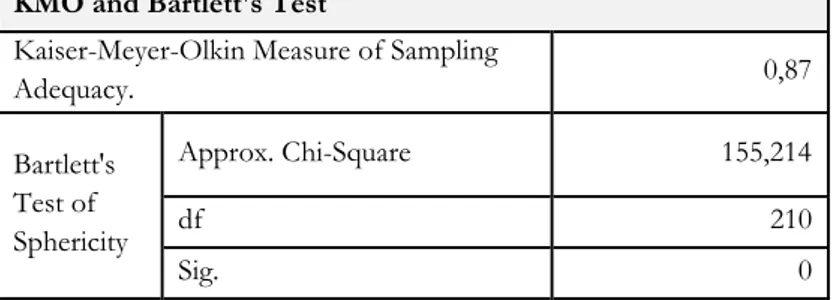
Table 4-7 KMO New Factors ...37
Table 4-8 Eigenvalues for New Factors ...37
Table 4-9 "New" Factors in Green Advertising ...38
Appendix 1 ...57
Appendix 2 ...62
Appendix 3 ...67
Consumer attitude toward green advertising - 1
1 INTRODUCTION
In this chapter the reader will be presented with the purpose of the thesis and how the subject of choice is relevant. A background and problem discussion will aid the reader understanding the problem surrounding the subject.
Background
1.1
Advertisers in Sweden are facing a constant battle to break through the clutter and reach the con-sumers’ attention with their advertising. Ads appear daily and everywhere in a concon-sumers’ life; in newspapers and magazines, online, on the TV, in the cinema and even in mobile phones. The competition for attention has become massive and companies are using all means necessary to reach the attention of the consumers (Kotler, Armstrong, Wong & Saunders, 2008).
Environmental messages and cues came to appear more frequently in advertising and communi-cation efforts during the 1980s, but had in fact its starting point in the 1970s when environmental movements came to existence. These movements consisting of concerned members of society, aimed to raise issues regarding local pollution and consumption waste. The green movement was not completely spread across the whole of a society, but was predominantly fronted by revolu-tionaries who desired to create an increased awareness of environmental issues among the socie-ty. This was done through pointing out the effects modern consumption may cause the environ-ment (Peattie & Charter, 2003). There was a noticeable upswing of production efforts toward en-vironmentally friendly products taking place in modern societies during the 1990s and previous research has shown that consumers’ awareness and interest for green products strongly increased during these years (Vandermerwe & Oliff, 1990). The changes have as a result led consumers to become more willing to pay for what was considered to be new and green, which would cause less pollution and waste. In other words, consumers were becoming prepared to start paying for a better environment (Vandermerwe & Oliff, 1990).
The green movement was as well establishing itself in Sweden where the demand among Swedish consumers for environmentally friendly services and products consequently increased. Changes taking place in consumer demand and perception caused companies present on the Swedish mar-ket to adapt and become more environmentally friendly in their production and execution of ac-tivities in order to not be left behind and run over by their competitors. Additionally, the green movement not only caused changes in production activities, the changes also began to appear in companies’ marketing communication efforts, introducing what one could call green advertising and marketing.
In Sweden today, consumers are exposed to a myriad of green messages in various forms of ad-vertising, influencing the change in consumer attitude and perception toward what constitutes more sustainable and environmentally friendly consumption in modern societies. With the in-creased interest and awareness toward environmental issues and changes in consumption shared among consumers, marketers soon discovered the advantages that could come about if they adapted their strategies and met the consumers half-way. The environmentally friendly products were considered to be something new and almost exotic by consumers. Alert players on the
mar-Consumer attitude toward green advertising - 2 kets realized this particular window of opportunity and saw the possibility of launching new, en-vironmentally friendly products and services that were charged for at a higher price (Peattie & Crane, 2005). Companies have realized that becoming environmentally friendly may be a profita-ble way to differentiate themselves from their competitors as well as to create a better company image. In turn, this could lead to an even more appreciative attitude toward their advertising ef-forts (Davis, 1993). As of today, 73 % more products are claimed to be environmentally friendly, than in 2009 (Sins of Green Washing, 2012).
Many consumers believe that a company’s real environmental engagement correlates with the en-vironmental message that is being presented within their marketing communications efforts (Shrum & McCarty, 1995). However, companies have used environmental claims in order to be profiled as green even though they are not. This activity goes under the name of Green Washing. Green Washing takes place when companies exploit the use of green marketing to hide the fact that they are not as environmentally friendly as they appear to be through their marketing com-munication efforts. In an attempt to increase the value of a brand, companies can use green washing to make their environmentally damaging business less detectable (Laufer, 2003), which in turn affects the attitude toward green advertising held by consumers.
Problem discussion
1.2
Advertising-in-general is often viewed as an unwelcomed intrusion by consumers and is often considered to be a source of irritation (Prendergast, Liu & Poon, 2009; Ahmad, Shah & Ahmad, 2010). A reason for experienced irritation can be that an advertiser claims something that is con-sidered too unbelievable and overdramatized by the consumer (Prendergast, Liu & Poon, 2009). It is therefore crucial that the consumer likes the particular advertisement and that it is regarded as interesting, appealing and credible (Shavitt, Lowrey & Haefner, 1998).
To create effective advertising it is important for advertisers to be aware of the general attitude towards advertising held by consumers. During the last decades, the interest for the environment has grown among consumers, leading advertisers to use green claims in their advertising. Green claims can often seem vague or misleading and can easily fall into a grey area, where the consum-er finds it hard to undconsum-erstand the source of the message and whethconsum-er it is reliable (Miljörappor-ten, 2010). This is a common risk for advertisers and can cause skepticism among consumer to-wards the message and its sender (Ahmad, Shah & Ahmad, 2010).
It is a common finding that consumers want claims to be product specific and provide detailed information regarding their true benefits, especially when dealing with green advertising (Davis, 1993). Swedish law states that consumers should not be misled and that advertising should be credible and truthful. All claims made by advertisers are to be documented and one should be able to control the source and understand who is behind the facts (Konsumentverket, 2012). Since consumers of today are becoming more environmentally minded, it is important for the advertiser to understand the differences between advertising-in-general and green advertising and what challenges they may bring. Do consumers perceive certain factors more important in green
Consumer attitude toward green advertising - 3 advertising than in advertising-in-general? If so, what could be the reason for this and how does it affect the advertising activity?
Purpose
1.3
The purpose of the thesis is to examine and compare Swedish consumers’ attitudes toward adver-tising-in-general and green advertising found in printed media.
Research questions
1.4
1. What are the differences among attitudes toward printed advertising-in-general and printed green advertising?
2. How are attitudes toward printed green advertising influenced by age and income?
Delimitations
1.5
A study within the area of attitudes toward advertising can be designed differently and take place in varying contexts hence the establishment of delimitations are necessary to properly pinpoint the boundaries of the study at hand.
This particular research focuses on the examination of attitudes among Swedish consumers to-ward printed green advertising. The reason behind the choice of focusing on Swedish consumers was to exclude the issue and discussion on cultural differences, to enable a pure investigation and dis-cussion of attitudes. The authors of the thesis chose to only focus on advertisements found in printed media, to enable a better understanding of the attitudes toward this particular type. To examine other types of media on top of printed media, the authors of the thesis would have to extend their theoretical framework substantially.
Definitions
1.6
Attitude - A person’s enduring, favorable or unfavorable evaluations, emotional feelings and ac-tions towards some object or idea (Kotler & Keller, 2006)
Consumer - This relates to the end user of a product or service. It is of importance to realize that the consumer does not have to be the actual buying customer (A Dictionary of Marketing, 2012a)
Advertising (-in-general) - The goal of advertising is the promotion of ideas, goods or services and any kind of combination of these. Advertising is one of the most expensive, visible and con-troversial elements of marketing communications (A Dictionary of Marketing, 2012b)
Green marketing (green advertising) - This is another type of advertising, where the promo-tion of the product focuses on the improvement the product or service can bring to the envi-ronment. The advertising industry has been attracted toward the niche, since it brings public at-tention and is an important issue in the society today (A Dictionary of Marketing, 2012c).
Consumer attitude toward green advertising - 4
Methodology
1.7
With the purpose of the research in mind, the study has taken on a combination of a descriptive and explanatory approach. The research is of a quantitative nature, with the aim to measure the attitudes and to explore the differences held among consumers. Existing advertising theories have been put into the new context of green advertising. The authors also present potential caus-es for the findings, making the study take on a slight interpretivistic approach as well.
Disposition
1.8
Introduction 1.8.1
This chapter introduces the reader to the subject at hand, providing a thorough background and problem discussion, leading the reader to the purpose and the research questions of the study. Delimitations of the study have been added to provide a better understanding of the scope of the study, as well as a list of definitions, a short methodology section and lastly the disposition is pre-sented.
Method 1.8.2
The choices of method and approaches are presented to the reader, providing a discussion upon its suitability to the study and reasons for choosing particular research techniques and settings are discussed.
Theoretical Framework 1.8.3
The theoretical framework introduces the reader to the context of the study, providing a thor-ough and well-described overview. This further leads the reader toward the specific theoretical choices made for the study, displaying a deeper knowledge within the chosen area of research.
Empirical Findings 1.8.4
Key findings from the study are displayed to the reader, focusing only upon what is of main im-portance for testing the hypotheses as well as answering the research question and the purpose of the study.
Analysis 1.8.5
The analysis follows the order of how the empirical findings were presented, combining analysis with what previous theory suggests, the particular findings from this study and whether any new results were discovered.
Conclusion 1.8.6
Lastly, this chapter aims to provide an overall view of the conducted study, relating it back to the purpose and the research questions established in chapter 1. Further, the final conclusion based
Consumer attitude toward green advertising - 5 on the findings of the result will be presented to the reader. Additionally, suggestions for further research and managerial implications are discussed.
Consumer attitude toward green advertising - 6
2 METHOD
In this chapter the methodology used for the empirical study is found. It introduces the context of research and also the specific methods used for the particular study.
Deductive and inductive research orientations
2.1
With the purpose of the thesis, to create an understanding of consumers’ attitudes toward green advertising in printed media, the chosen research approach is a combination of a deductive and an inductive approach. The deductive aspects relate to a structured approach where one collects quantitative data and where the researcher is not in any way related to the area of research. The authors of the thesis have carefully designed and developed a quantitative study in the form of a questionnaire, where closed statements were used as a mean to collect the data. Further, Saun-ders, Lewis and Thornhill (2009) suggest that the data must be able to explain causal relationships between different variables and to be able to generalize a final conclusion. The goal with the study was not only create an understanding, but also to test hypotheses relating to attitudes to-ward green advertising to be able to explain any existing or nonexistent relations between differ-ent factors. Hypotheses’ testing is a common approach in a deductive research method (Saunders et al., 2009).
The alternative and second part of the chosen research orientation for the thesis is the inductive approach, commonly used when the researcher acquires an understanding within the research subject and where the researcher is actually a part of the study (Saunders et al., 2009). Since the authors of the thesis have been inspired by previous studies within the field, but in different re-search contexts, an inductive approach is suitable. Ghauri and Gronhaug (2010) suggest that with the use of the inductive approach, a researcher can make final assumptions and conclusions on previously made investigations. The authors are testing hypotheses inspired by previous research, that have been put into the new research context particularly suitable for this study.
To conclude, the researchers of the thesis have decided upon using a combination of two re-search orientations. The authors possess a certain amount of previous knowledge and experience on the studied subject and an understanding of the old, and new research context, which is often considered to relate to the deductive research approach. In addition, the two authors are affected by the study since the two fit the profile of the targeted group. In other words, an influence of an inductive approach can also be spotted, since the authors are not fully detached from the study, which is normally the case for a clean deductive research orientation (Saunders et al., 2009).
Research approaches
2.2
There are several research approaches to choose from depending upon the nature of the study (Ghauri & Gronhaug, 2005). An exploratory approach is often used when the problem may be tricky to pinpoint or fully comprehend and where the researcher lacks information on the subject. Saunders et al., (2009) explain this type of research rather simply by saying that it is a type of study that tries to find out “what is going on” and that it involves the seeking of information
re-Consumer attitude toward green advertising - 7 lating to a certain problem. Ghauri and Gronhaug (2005) also suggest that this type of approach combines various methods of data collection, for instance observations, gathering of information and trying to find reasons for, or explanations to, findings within the studied area. When looking upon what an actual situation is like and when the researcher already has some knowledge and in-formation about the chosen area, the research is often addressed as a descriptive research. During this type of research, data collection can take the form of surveys or interviews where structured questions are used to collect the necessary data (Ghauri & Gronhaug, 2005). Lastly, there is a third approach that can be used, namely the explanatory approach. Williamson (2002) suggests that this approach is often used to explain the underlying question of why something is the way it is and includes the study of possible correlations between variables, often done by running statis-tical tests (Williamson, 2002; Saunders et al., 2009).
This particular research includes a descriptive- and exploratory research approach, with the main data-collection taking place through an electronically distributed questionnaire. The goal of the study was not only to create an understanding of consumers’ view towards green advertising in printed media, but also to test hypotheses generated from results by previous studies and to find possible correlations between the examined factors, namely entertainment, irritation, credibility, informativeness and advertising value. This was done by creating hypotheses based on previous results, to test whether or not they can be related to the new research context of this particular study. With this in mind, the authors of the thesis believe that a descriptive approach, relating to the authors’ goal of examining the attitude held by Swedish consumers, and the exploratory ap-proach, focusing on explaining possible correlations between findings, gaining an idea of what is going on, would prove to be a suitable combination of approaches to fulfill the purpose of the study.
Quantitative and Qualitative research
2.3
Saunders et al., (2009) suggest that there are two types of methods that can be used to collect da-ta, namely quantitative and qualitative methods. Data that is collected and which can be analyzed by statistical tests and calculations not involving any in-depth analyses is related to what is known as a quantitative research method (Williamson, 2002). On the other hand, there is the other type of research called qualitative research that often takes place through interviews and types of in-depth focus groups. Data received through qualitative research will be subject to interpretation, where the goal of the researcher is to find useful patterns to explain a certain issue or phenome-non, (Saunders et al., 2009; Auberbach & Silverstein, 2003). When looking upon the purpose of the particular study, the authors regarded the quantitative research approach to be most fitting. When aiming to find out what a situation is like, and not digging into the underlying explanations or ideas of why something is the way it is, a quantitative research approach is preferable, which also could provide the research with enough data to make a generalization regarding the findings (Malhotra & Birks, 2007). The data collection technique is further discussed in the following sec-tions.
Consumer attitude toward green advertising - 8
Collection of data
2.4
Primary data 2.4.1
There are two types of data that can be collected for a study; primary data and secondary data (Adams, Khan, Raeside & White, 2007). Primary data is collected for the particular problem re-lated to the current research at hand, whereas secondary data relates to data that has been collect-ed for other purposes (Malhotra & Birks, 2007; Adams et al., 2007).
For a quantitative data collection, structured questionnaires distributed to a sample of a popula-tion can provide useful informapopula-tion regarding the respondents’ behavior, intenpopula-tions, attitudes, awareness, motivations and demographic and lifestyle characteristics (Malhotra & Birks, 2007). For this study, the authors decided to electronically distribute a questionnaire to the targeted population, as this seemed most appropriate to fulfill the purpose of the thesis. Additionally, the use of a questionnaire is not only time and cost efficient, but can also be easily distributed to a large amount of respondents, where the respondents can manage the activity of answering ques-tions without assistance (Williamson, 2002). This was also one of the reasons that influenced the decision upon which data collection technique to use since the authors experienced particular time limitations. With the purpose of the study and its research objectives in mind, the quantita-tive technique was regarded as suitable. Not only were the authors able to receive a comprehen-sion of Swedish consumer’s attitudes, but the technique also provided data, which enabled the possibility to test hypotheses relating to the studied area. The hypotheses can be found in the theoretical framework chapter.
Questionnaire 2.4.2
The targeted population for the questionnaire consisted of Swedish consumers. The question-naire was made public on the 13th of April 2012 and was closed down on 27th of April 2012. The authors of the thesis distributed the questionnaire electronically, through the use of their personal email- and Facebook accounts. The participants were asked to spread the link of the question-naire further, to increase the number of responses. Coolridge (2000) suggests that the higher the number of respondents in a quantitative study can affect whether the sample is representative for the overall population, and this was a goal for the study at hand.
The respondents activated a total of 143 questionnaires. Two respondents were filtered out, since they did not fit the profile of respondent being above the age of 18. 30 responses were not com-pleted and were hence excluded from the total number. The questionnaire therefore reached a to-tal amount of 111 valid responses, which were subject to analyses. This number may come across as a fairly small size of the studied population, however Coolridge (2000) and Pallant (2005) state that there has to be a minimum of data collected from 30 respondents from the over-all study. In other words, a total number of 111 respondents were considered to fulfill the requirements of a valid quantitative study (Coolridge, 2000; Pallant 2005).
The goal was to keep track off how many respondents the link was spread to, to enable an exam-ination of the response rate. Unfortunately, this idea put a constraint on the collection of
re-Consumer attitude toward green advertising - 9 sponses and therefore a decision was made to make the link public instead of sending out private messages to increase the amount of respondents. Consequently, a response rate has not been possible to calculate since the authors of the thesis do not have a number of how many respond-ents the link to the questionnaire actually reached. The authors argue however that it would be impossible without the use of an email database or similar to gather enough responses and to be able to calculate a response-rate. Instead, a decision was made to make the link public to ensure as many responses as possible were collected.
Questionnaire design 2.4.3
The chosen model for this particular study, The Ducoffe Extended Model (DEM) by Brackett and Carr (2001), influenced the design of the questionnaire. The perspectives of the factors relat-ing to entertainment, credibility, informativeness and irritation, as well as the dimension of adver-tising value, were incorporated into the questionnaire to enable an examination of the chosen fac-tors.
The statements found in the questionnaire were posed in Swedish to ensure comprehension among the respondents and eliminate any potential errors due to misunderstanding. Further, the questionnaire was, to a certain degree, influenced by similar questions used in previous studies by Ducoffe (1996), Ling, Piew and Chai (2010), Saadeghvaziri and Seyedjavadain (2011) and lastly, Brackett and Carr (2001). The mentioned researchers have all previously conducted research up-on attitudes toward advertising, but with different research purposes and within varying cup-ontexts. Since the authors of the thesis aimed to investigate the attitudes of consumers toward printed ad-vertising-in-general and green advertising, the final design of the questionnaire covered factors considered necessary for analyses of attitudes toward advertisements.
The questionnaire consisted of three different sections. The first section concerned the demo-graphical characteristics of the respondent, where statements relating to age, gender, educational background, current work-situation and level of income were covered (Q1, Q2, Q3, Q4, Q5, Q24). The idea behind these questions was to examine whether there are any underlying differ-ences between demographical groups and their attitudes, as has been suggested in previous re-search.
The second section of the questionnaire, covered statements relating to the respondents’ attitude toward printed advertising-in-general, where statements relating to their overall attitude and five factors of advertising attitudes were presented. The factors covered attitudes toward the informa-tiveness-, entertainment-, irritation-, credibility- and advertising value- characteristics of advertis-ing-in-general (Q6, Q7, Q8, Q9, Q10, Q11, Q12, Q13, Q14). The final section of the question-naire asked the respondents to do the same thing as in section two, however this time the state-ments were measuring the respondents’ attitude toward printed environmental advertising, cover-ing the exact same factors as previously stated (Q15, Q16, Q17, Q18, Q19, Q20, Q21, Q22, Q23).
The questionnaire consisted of statements where the respondent was to indicate his or her level of agreement or disagreement to the particular statement. This was done on a 5-point Likert
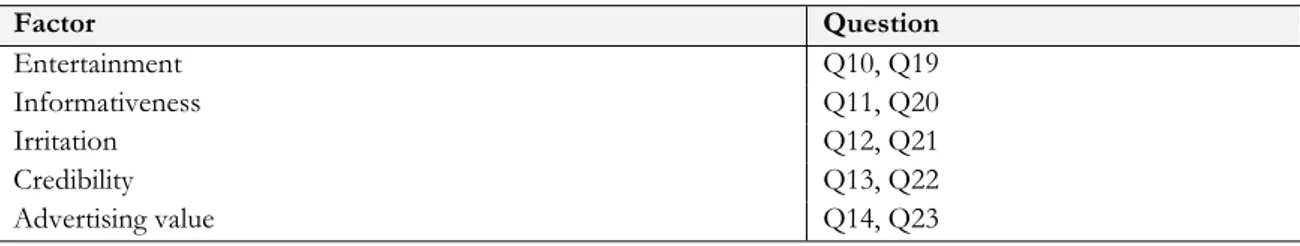
Consumer attitude toward green advertising - 10 Scale, as this is a suitable scale to apply when aiming for an understanding of attitudes among re-spondents (Williamson, 2002). The scale measured 1 Totally disagree, 2 Disagree, 3 Neither Agree nor Disagree, 4 Agree and 5 Totally disagree from left to right and the respondent was forced to leave a response in order to proceed to the next question. The factors found below are also found in the Ducoffe’s Extended Model (DEM), presented in the theoretical chapter.
Factor Question Entertainment Q10, Q19 Informativeness Q11, Q20 Irritation Q12, Q21 Credibility Q13, Q22 Advertising value Q14, Q23
Table 2-1 Factors of the Questionnaire
Formulation of statements 2.4.4
There are different kinds of variables that can be measured and examined through the use of a questionnaire; opinion-, behavior- and attribute variables (Saunders et al., 2009). The variables are able to examine and investigate different areas, where opinion variables aim at understanding the feelings the respondent has towards something, for instance whether the studied phenomenon causes irritation, or perhaps happiness through the use of entertainment appeals within the ad-vert. Secondly, the behavioral variables concern what the respondent has done, or think he or she will do, in the future. The name of the variable is quite self-explanatory, since it examines the be-havior of the respondent by for instance asking whether or not the respondent has purchased products after being exposed to an environmental advert, or whether this is something he or she would consider. Finally, the attribute variables examine the demographics of the respondent, with statements aiming to find out the respondents age and gender, for instance (Saunders et al., 2009).
With the research objectives in mind, the authors of the thesis decided upon only including opin-ion-related, as well as attribute variables in the questionnaire. The reason was due to the purpose of the study, to examine and compare Swedish consumers’ attitudes toward advertising-in-general and green ad-vertising, as well as associating any findings toward the different demographics, to find possible underlying patterns.
Scales and statements used 2.4.5
Since the underlying idea behind the use of a quantitative research approach and the use of a questionnaire was to enable statistical analyses to test hypotheses, the choice of scales and state-ments were important. The authors applied a 5-point Likert Scale, as it is a suitable scale for measuring attitudes among a population (Williamson, 2002).
To receive data on the respondents’ demographic attributes, closed, single-response questions were used, where alternatives were provided in a list, also known as list question.
Consumer attitude toward green advertising - 11 Further, with the goal of measuring attitudes among the respondents, the opinion variables were presented. By adapting scales and measurements that have been used in previous attitudinal stud-ies within similar contexts, the authors of the thesis believed it would increase the validity and certainty of the scales.
Coding of statements 2.4.6
The questionnaire was electronically distributed. The Qualtrics and SPSS program automatically coded the opinion-related statements. This means that the different responses were coded 1- 5 on the Likert Scale, depending on the response. For certain attribute statements, the authors had to code the different statements manually. An explanation of the coding can be found in table 2.2. The recoded statements can be found in Appendix 3.
Codebook 2.4.7
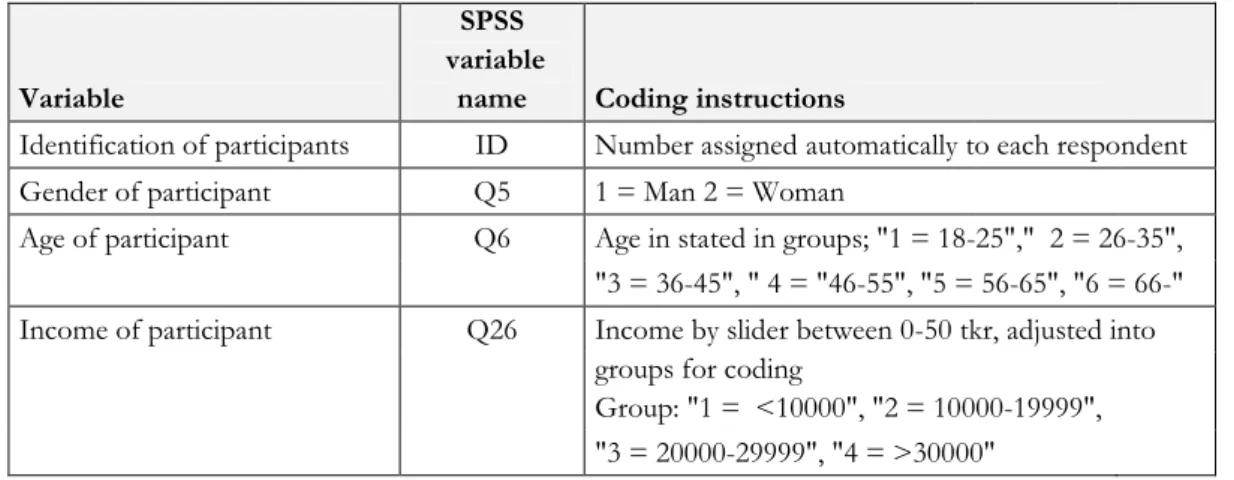
Certain statements were not coded automatically by SPSS, hence the authors had to do this man-ually. The questions concerned gender, age and income.
Variable
SPSS variable
name Coding instructions
Identification of participants ID Number assigned automatically to each respondent
Gender of participant Q5 1 = Man 2 = Woman
Age of participant Q6 Age in stated in groups; "1 = 18-25"," 2 = 26-35", "3 = 36-45", " 4 = "46-55", "5 = 56-65", "6 = 66-" Income of participant Q26 Income by slider between 0-50 tkr, adjusted into
groups for coding
Group: "1 = <10000", "2 = 10000-19999",
"3 = 20000-29999", "4 = >30000"
Table 2-2 Codebook
Sampling 2.4.8
Saunders et al., (2009) propose probability and non-probability sampling as two possible tech-niques when selecting the targeted respondent group. The non-probability sampling technique has been applied to this particular study. Malhotra and Birks (2007) state that non-probability samples may provide a good overview of the studied population’s characteristics, however, it does not enable an objective evaluation and can therefore not be statistically projectable to the overall population. The authors recognize this disadvantage, however, there was no possibility to use a probability sample due to a lack of resources. The non-probability sampling technique was consequently chosen for the study, involving a convenience and purposive sampling. Conven-ience sampling saves both time and costs and it is often easy to access. There are however certain limitations one has to be aware of when applying this type of sampling technique. Malhotra and Birks (2007) present issues of selection bias and that the samples are not representative to the over-all population. The second sampling technique used is the purposive, also known as judgmental
Consumer attitude toward green advertising - 12 sampling, where the purposive sample represents Swedish consumers, since the purpose of the study was to examine Swedish consumers. In judgmental sampling, a particular population is targeted because of its suitability to the study. In addition, when using convenience sampling, it is regret-tably not possible to calculate a response-rate. The authors have either way decided upon these sampling techniques, as they were considered most suitable for the purpose of the thesis, keeping in mind the time- and resource constraints.
Pilot study 2.4.9
With the questionnaire being ready, it was important to test it, prior to send-out to minimize the risk for misinterpretations and errors, which in fact could effect the reliability and validity of the data (Saunders et al., 2009). The number of pilot-testers can depend upon matters of time and size of the project. Generally, one should always aim for a pre-testing session no matter how big or small the study is, since this can help reach validity of the data (Saunders et al., 2009). Before the authors made the link to the questionnaire public and began the data collection, a pilot-study was conducted where a draft of the questionnaire, already put in the Qualtrics-program with the intended design and logic of questions, was sent out to 6 suitable respondents. The testers com-pleted the questionnaire, where positive and negative feedback and comments were received through Skype, email and Facebook. Certain questions proved to be hard to comprehend by the pilot-testers. Changes were made to the questionnaire to enable the final respondents with a bet-ter understanding of what the statement meant and asked for, which in turn would provide the authors of the thesis with data reaching a higher reliability.
Data analysis
2.5
The analysis of the collected data will be done through running descriptive statistical tests to re-ceive an overview of the divide between the chosen demographics used in the study. The authors have chosen to show the divide between age, gender and income. Before describing the chosen analyses for the study, the authors wish to inform the reader that certain statements from the questionnaire were deleted since they proved to not be suitable for the purpose of the study. The statements were: Q6, Q7, Q8, Q9, Q15, Q16, Q17 and Q18, all relating to the over-all attitude toward advertising-in-general and green advertising.
Standard deviation 2.5.1
The mean is the total sum of the variables, which is then dived by the number of variables, to in-dicate the average of a set of observations (Aczel & Sounderpandian, 2009). The standard devia-tion of data indicates the spread of the mean. If the deviadevia-tion is low, it means that the observa-tions are close to the mean, whereas a higher deviation indicates a much larger spread across the values (Aczel, 2006; Aczel & Sounderpandian, 2009)
Normal distribution 2.5.2
This type of test shows the normality of the distribution of the scores and whether the data can be used for statistical tests, such as t-tests, analysis of variance and ANOVA test. A
non-Consumer attitude toward green advertising - 13 significant result indicates normality, with a Sig. value higher than 0.05 (Pallant, 2005). When data reaches normal distribution, one can apply parametric tests. The skewness of the test shows the symmetry of the data distribution, whereas the Kurtosis shows what Pallant (2005) refers to as the “peakedness” of the data. Data that is normally distributed, reaches values of 0 on both the symmetry and peakedness, however this is not common within the social sciences (Pallant, 2005). The authors of the thesis have run a normal distribution test on their data, to gain a picture of whether their data reached a normal distribution and to prepare the data for further analyses.
Null hypothesis and alternative hypothesis 2.5.3
Hypothesis testing is a very common method for data analysis. The authors of the thesis have used null and alternative hypothesis to be able fulfill the purpose and answer the research questions of the study. The hypothesis test is: H0: μ = 0; H1: μ ≠0. For this study, the authors decided to use a significance level of 5%, hence α was set to 5%, which is a commonly used standard value. With the α set to 5%, the authors will reject the H0, whenever the probability value is below the sig. value of 0,05.
Paired Sample t-test 2.5.4
With the aim of comparing levels of attitude found in advertising-in-general and green advertis-ing, the authors of the thesis found paired sample t-test to be suitable. This type of analysis is useful when comparing values of different groups, as well as when wanting to compare results over time (Pallant, 2005). In addition, this type of test was considered most suitable since the au-thors aimed at testing hypotheses relating to the difference or similarity between the measured factors.
Factor analysis 2.5.5
This type of analysis can help reduce the amount of data, by identifying a smaller number of tors, and does so by intercorrelating a set of variables (Pallant, 2005). There are two types of fac-tor analysis, Principal Component Analysis (PCA), and Facfac-tor Analysis (FA). The authors of the thesis have chosen to apply the Factor Analysis (FA) since it estimates the factors by analyzing only the shared variance of the factors and presents a theoretical solution to the findings. The Principal Component Analysis (PCA) on the other hand provides more of an empirical summary of the data (Pallant, 2005).
Since the authors of the thesis aimed to examine whether the factors of advertising-in-general and green advertising share similarities or in fact differ, a factor analysis was applied to the data. Before deciding upon whether the data is suitable for factor analysis, issues of sample size and the strength of relationship among the variables needed to be considered (Pallant, 2005). In addi-tion, there are statistical measures found in SPSS that can be used when examining the suitability of the data, Bartlett’s test of sphericity and the Kaiser-Meyer-Olkin measure of sampling adequacy (Pallant, 2005). The KMO-test was chosen for this thesis, where if the score of the test is below 0.6, the data is not suitable for factor analysis (Pallant, 2005).
Consumer attitude toward green advertising - 14 Correlation analysis
2.5.6
To see whether any correlations move together, one has to examine the correlation coefficient, the ρ-value (RHO), which can have any value going from -1, through 0, to 1 (Aczel & Sounder-pandian, 2009).
When examining correlations, one has to look at the ρ-value to see whether there is a correlation or not between the factors.
1. When the ρ-value = zero, there is no correlation, and hence there is no degree of linear associations between the two chosen variables.
2. When the ρ-value = 1, it has reached a perfect positive linear relationship. This means that if either X or Y increases or decreases, the other variable will follow.
3. When the ρ-value = -1, indicates a perfect negative linear relationship. This is the oppo-site of p-value =1, where if either X or Y increases, or decreases, the other variable will do the opposite. So, if X increases, Y will decrease (Aczel & Sounderpandian, 2009).
The values from the Pearson Correlation test show the covariance, how much two random varia-bles change or move together. The value of the covariance shows the expected value of the product of the deviation of variable X from its mean, and the deviation of variable Y, from its mean (Aczel & Sounderpandian, 2009). When two variables move together in the same direction, the covariance is positive, and when they move in opposite directions, it is negative. The covari-ance can also show 0, which then indicates that there is no linear relation between the variables. (Aczel & Sounderpandian, 2009).
Validity of data
2.6
The issue of validity of a research is of high importance since it enables the researchers to make a statement that their findings are of actual value and could be of use for further research. There are however issues relating to the task of reaching validity and the views upon this matter differ among researchers. There are different categories of validity, depending on whether the research is of a qualitative or quantitative nature. Richards and Morse (2007) have, for instance, suggested that due to the nature of the qualitative data, with it being subjective and strongly connected to the specific context being studied, there is no such thing as what others call validity and reliability and one should instead use terms such as credibility, transferability and consistency. With the nature of this particular study in mind, the discussion of validity for a qualitative research is not necessary. Instead, the authors of the thesis have paid attention toward how to reach the highest validity on their quantitative research. Saunders et al., (2009) suggest that for any research to reach validity on its findings and conclusions, the credibility of the findings has to be verified so that one can en-sure that the data is in fact valid and true.
There are several types of validity that one should pay attention to and examine to ensure a pos-sibility of confirming validity of data. For instance, when designing the data collection,
research-Consumer attitude toward green advertising - 15 ers could investigate the validity of the scale that is being used to see that it actually measures ob-jects that can be found within the chosen area of research (Malhotra & Birks, 2007).
If a study reaches content validity, also called face validity, it would suggest that the scale used in the study has a good representation of the measurement being made. The authors of the thesis have, as previously mentioned, not only been influenced by previous similar studies within the advertis-ing field, but also pilot-tested the measures found in the questionnaire. This was not just done to confirm comprehension of statements and flow within the design, but also to assess whether the chosen scale and statements truly measure and provide the type of data needed to fulfill the pur-pose of the study. It should be mentioned however that due to the nature of this type of meas-urement being highly subjective, it does not provide a sufficient measure of the validity of the scale, but can instead be seen as a complement to other types of validity measures.
Construct and criterion validity 2.6.1
This type of validity can provide an indication of to what extent, the chosen questions or state-ments do in fact measure the constructs or characteristic, intended to be measured (Malhotra & Birks, 2007; Saunders et al., 2009).
As has already been explained, the opinion-related variables included in the questionnaire were influenced by previous studies, which then presented high levels of Cronbach’s Alpha values. Since the previously used statements were not directly copied to the new context, but instead adapted and adjusted to fit the purpose of the study, a new test of reliability was run to make sure that the statements reached satisfactory Cronbach’s Alpha values.
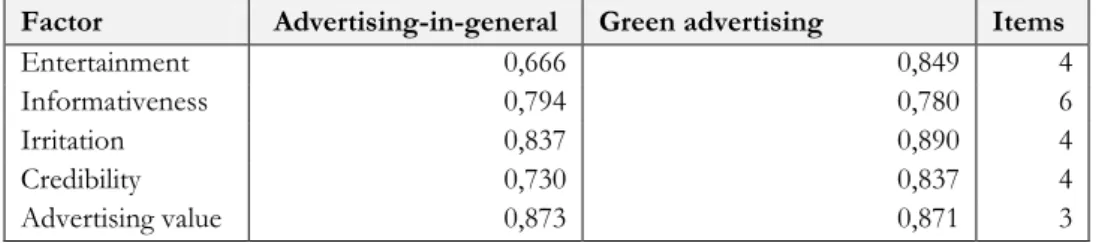
Saunders et al. (2009) refer to criterion validity as the measure’s ability to make accurate and pre-cise predictions. As can be seen in table 2-3, the adapted measures when put in their new context all score a Cronbach’s Alpha value of above 0,66, indicating reliable measures. A Cronbach’s Al-pha shows split co-efficients, and can range from 0-1. A value of below 0,6 usually indicates a disappointing internal-consistency validity (Malhotra & Birks, 2007).
Removing risks 2.6.2
It is further suggested that in the creation of a study, one should aim to remove as many risks of errors as possible, by creating a valid and strong research design. This can be done by considering the actual design of the questionnaire, but also by remembering that using respondents from the same type of group, who engage in similar situations, can increase the validity of the data (Williamson, 2002).
Another way of increasing the validity of the data is to complement the quantitative data with qualitative data (Saunders et al., 2009). For this particular study, the authors aimed to create a well-designed and ptested questionnaire, to limit the possibility of misinterpretations by re-viewing previously made research within similar areas, their chosen research design, question-naire-statements and scales. Time was spent researching previously made studies within similar fields, to scope the situation and see what had previously been done with successful results. The
Consumer attitude toward green advertising - 16 authors regarded this to be a good technique to find ideas toward designing a suitable and suc-cessful study.
Further methods that can increase the validity of the data and eliminate possible errors are by re-alizing that the findings may be affected and influenced by different factors. Ghauri and Gronhaug (2005) propose in their book on research methods that data can be affected by stable characteristics, transient personal factors and lastly situational factors. The first mentioned factor relates to the use of the scale by the respondent and that one has to keep in mind the different use of the values found on the scale. The authors decided upon applying one of the most famous scales, the 5-point Likert Scale to create as familiar a scale as possible, for the respondent. Further, tags were put out for each score on the scale, so that the respondent would know exactly what he or she could indicate depending on the chosen score.
The transient personal factor, which relates to the respondents’ mood is also important to keep in mind since it could have an effect on the responses collected. It has to be stated that the authors of the thesis had no possibility to assess or observe the respondents’ mood, since the survey was done anonymously, individually, and without the authors of thesis near-by.
Lastly, there is the situational- and mechanical factor, where Ghauri and Gronhaug (2005) explain it as an issue of for instance time pressure, and when a respondent marks his or her answer incor-rectly or when the response is coded wrongly (Ghauri & Gronhaug, 2005). A questionnaire that was activated by the respondent had no apparent time restraint and the respondent could go back to finish his or her questionnaire if they did not do so directly, until the questionnaire was taken offline by the authors.
Reliability of data
2.7
A simple definition of the reliability of data is when similar and consistent results are reached, when repeating the study at another point in time. To ensure the possibility of this, the selection of a suitable data collection technique is of high importance (Saunders et al., 2009). Since this study is of a quantitative nature, and with the data collection-taking place through the use of a questionnaire, the authors aimed to create as standardized and regular a questionnaire as possible. Further, it was put to test prior to send-out, to test how it was perceived in order to exclude any elements of misunderstanding, surprise or unfamiliarity.
Factor Advertising-in-general Green advertising Items
Entertainment 0,666 0,849 4
Informativeness 0,794 0,780 6
Irritation 0,837 0,890 4
Credibility 0,730 0,837 4
Advertising value 0,873 0,871 3
Table 2-3 Cronbach Alpha Values for Factors
The table above shows that all measures provided reliable measures, scoring above the level of 0,66. In addition, Saunders et al., (2009) suggest further issues that can occur when respondents
Consumer attitude toward green advertising - 17 for instance interpret the questionnaire statements differently or when there are language barriers, which was why the authors decided on creating the questionnaire in Swedish.
Consumer attitude toward green advertising - 18
3 THEORETICAL FRAMEWORK
This chapter should be regarded as the foundation of the study and provides a framework that will aid in the analysis of the findings. The chapter delivers an overview of chosen theories relating to the area of advertising and attitudes and a discussion upon why they are deemed suitable for this particular study.
Advertising
3.1
Advertising has from its earliest days, been regarded as a way to provide strictly factual infor-mation, so-called cognitive information. The first formal model of advertising was AIDA, which stands for Attention-Interest-Desire-Action, and is still one of the most commonly used advertis-ing models (Vakratsas & Ambler, 1999). Since then, advertisadvertis-ing has developed and is today an important part of an organization’s marketing communication in the means of communicating with current and potential customers.
The objectives of advertising are to create awareness, informing customers and to create a desired perception for the product or brand. The purpose of advertising is also to create a preference for the product or brand and to persuade consumers to purchase the product (Bendixen, 1993). Ad-vertising can also help to influence audiences to differentiate a product from others in the mar-ketplace and by that, reach large audiences through messages that help the consumers to under-stand the product, and make their final decision (Percy & Elliot, 2009; Fill, 2005).
Advertising should provide information or create a positive feeling that goes beyond just catching the consumer’s attention for the ad; it should be designed to provide information in order to cre-ate a positive brand attitude, formed by a favorable impression (Percy & Elliot, 2009). The con-tent and delivery of an advertising message is derived from an understanding of the context of where the ad is to be used (Fill, 2005).
How does advertising work? 3.1.1
The main objectives of advertising are to build awareness, induce engagement and to position brands by changing the customer’s perception or attitude and can create a competitive advantage for the advertiser (Fill, 2005). Creating the perfect advertisement is a complex task; the consumer must have the opportunity to pay attention to the advertisement and then gain an understanding of the presented message and finally take the decision to act upon it (Percy & Elliot, 2009). The complexity of producing the right message lies within the difficulty of understanding how hu-mans have different possibilities in their thinking, feeling and behaving towards products and services. Humans are capable of being logical, illogical, objective, subjective, obvious and subtle at the same time (Vaughn, 1980).
Based on the findings of 25 conclusions of previous research, Vakratsas and Amber (1999) creat-ed a theory suggesting how advertising works. The ad itself should work as an input for consum-ers and trigger an unconscious or conscious response. The ad should also aim for some kind of mental effect, for example awareness, memory or attitude, before it can have an effect on the be-havior of the consumer. Two major intermediate advertising effects of responses are responses
Consumer attitude toward green advertising - 19 that are affective (emotions) and cognitive (thinking). Further, the memory or experience also plays a major role in the consumers’ mind. Consumers often have conscious or unconscious memories of product purchasing or usage, which means that the memories affect the behavior of the consumer.
Individual responses to advertising are also affected by factors such as motivation and the ability to process information, which are factors that can have a big impact on the response. Factors that affect responses, can function as filters between the advertising input, the consumers and their behavior. Dahlén, Lange and Smith (2010) argue that advertising is the link between market-ing communications and consumer behavior and that the latter has changed to a more cognitive orientation. Forming attitudes is an important part of advertising and an effective marketing campaign has the ability to form or change an attitude towards a company or product in the mind of the consumers. Dahlén et al., (2010) suggest several examples of why companies use marketing communications where repositioning of the brand, building credibility, changing performance and attribute beliefs of a product as well as creating new attitudes about the company’s competi-tors’ products, are examples of why a company would create an effective and successful market-ing communications strategy.
Motives and appeals in advertising 3.1.2
As previously mentioned, advertising is constantly used by companies to create awareness, to in-form their customers about new products and can also be used when creating certain preferences for a brand and even as a means of persuading the customer to purchase a product (Bendixen, 1993). Advertising can create different emotions among its viewers, by containing certain appeals, in order to create a certain emotion among the customers. With the purpose of the thesis in mind, to examine consumers’ attitude toward advertising, an understanding of the actual adver-tisement is also needed.
A main goal of advertising is to persuade the consumer to purchase a particular product. There are however different motives behind customers’ purchasing choice and to enable an understand-ing of what attitudes customers may hold towards printed advertisunderstand-ing-in-general and printed green advertising, understanding the role of advertising is also of importance to create a holistic view of the studied subject.
Within advertising, there are different appeals that marketers use in order to attract customers and they are often initiated upon what motive is behind the customer’s decision to purchase a product, whether it is a hedonic or utilitarian motive (Percy & Rossiter, 1992). Further, they sug-gest that there is either a positive or negative motive behind buying a particular product. Negative motives relate to when the customer wishes to avoid a certain outcome, or remove a problem, whereas positive motives takes place when the customer wishes to reach social approval, sensory enjoyment or an intellectual stimulation (Percy & Rossiter, 1992).
Consumer attitude toward green advertising - 20 Emotional and rational appeals in advertising
3.1.3
Advertising is a one-way format that is impersonal; hence the ad must contain both rational and emotional claims to compensate for the impersonality (Vaughn, 1980
).
Advertisers can make use of different appeals to trigger a type of emotion among customers and is commonly used when the motive behind the purchase is caused by an emotion. The term emotion within advertising theory, relates to the affect program theory, which includes six main emotions: surprise, anger, fear, disgust, sadness and joy (Percy & Rossiter, 1992; Percy & Elliott, 2009). When advertising a product that belongs to more of a value-expressive range, with hedonic motives, emotional ap-peals are often more suitable (Albers-Miller & Stafford, 1999).Rational appeals relate to the technique where marketers wish the customer to process a certain amount of information found in the ad, and by this make a rational and logical decision (Albers-Miller & Stafford, 1999). An advertisement with rational appeals usually involves rational argu-ments and information that explains why a certain product would benefit the customer, and for instance the environment. Previous research has suggested that rational appeals within advertising creates a higher rate of credibility among the customers, and can in turn lead to a higher purchas-ing rate and a positive attitude toward the product. Rational appeals in advertispurchas-ing have been proven suitable for products with utilitarian characteristics (Albers-Miller & Stafford, 1999).
Green advertising
3.2
The interest for environmental issues in the society has led to more environmentally focused consumers. This has consequently led toward organizations displaying willingness to respond to the consumers’ interest of environmentally safe products. Due to the higher consumer awareness of environmental issues, companies have adopted a more green profile in order to gain an ad-vantage over competitors (Kangun, Carlson & Grove, 1991; Ahmad, Shah & Ahmad, 2010) and also to create a more favorable image of the brand.
Advertisers have adjusted their advertising to meet the “green customers” and are using envi-ronmental claims to show the benefits of a product or a service. These claims can influence the consumer’s preferences of a product or service, either in a positive or in a negative way. In other words, if an advertiser uses the environmental claims in the right way the product or image of the company can be enhanced, and if used in a wrong way, by making false claims, can damage the product and the company image (Davis, 1993).
It should be noted that advertisers can have a tendency to “push the boundaries” when it comes to promoting these kind of appeals, for example green appeals (Zinkham & Carlson, 1995). Claims can be confusing, misleading or trivial and the potential for abuse within environmental claims are high. Many organizations have used false or less true environmental claims in order to be profiled as more green than they are in reality (Kangun et al., 1991).
There are a number of reasons that environmental advertising can be confusing or misleading to the customer. Words like degradable, environmentally friendly or ozone-friendly have no clear meaning and companies can use the same terms to promote different benefits. Scientific
Consumer attitude toward green advertising - 21 knowledge may be required to understand certain environmental claims, since they can be com-plicated and difficult to understand (Kangun et al., 1991). It can also be questioned how consum-ers comprehend specific environmental claims, such as recycled or environmentally-friendly. Studies have shown that there can be great variations between different individuals in the inter-pretation of the same claims (Morris, Hastak & Mazis, 1995). Research has supported the view that consumers have formed skeptical attitudes towards green advertising, leading to avoidance in purchasing. The higher the level of perceived trickery and deception has been found connected with lower levels of perceived credibility (Ahmad, Shah & Ahmad, 2010).
Advertisers might use vague or unspecific environmental claims without any factual support to describe a product’s characteristics or benefits, where an example of vague wording could be “better for the environment” (Davis, 1993). Finally the environmental benefits uses are often lim-ited to one benefit, which can cause uncertainty in the consumers mind about the whole aspect of the environmental issues relating to a company (Kangun et al., 1991).
David (1993) suggests that environmental claims should satisfy three criteria:
1. “Specific environmental claims provide details” is the most important aspect. Environmental advertising claims should be informative and useful in helping the consumer to determine differences in products and to help them make a better decision. Consumers want to be in-formed in order to make product decisions and they expect green advertising to be specific, informative and detailed, and advertisers should avoid information that is considered vague. As a result, advertisers should provide information so the consumers can evaluate product attributes and make an appropriate decision.
2. “Specific environmental claims present real benefits”, useful information; a common advertising strategy is to imply superiority claims. An example of these claims is “ Nobody cleans better”. Consumers appear to reject these kinds of claims in the context of green advertising be-cause they claim it does not provide much information about how good they are and it could be interpreted as “our cleaning ability is at least as good as our competitors”.
3. “Specific environmental claims provide meaningful benefits”, the products of green advertising should contribute to a meaningful improvement of the environment. A consumer seems to reject advertising that only provides minimal environmental improvement. Green advertis-ing should present real environmental sensitivity and advertisers should focus on develop-ing products with real benefits and not hope that advertisdevelop-ing will convince the consumer otherwise.
Attitudes toward the ad
3.3
Attitudes towards the ad have been defined as “a learned preposition to respond in the consistently favorable or unfavorable manner to advertising in general” (Metha & Purvis, 1995). Kotler and Keller (2006) suggested that an attitude is a person’s enduring favorable or unfavorable evalua-tions, emotional feelings and action tendencies toward an object or an idea. Therefore, a positive attitude towards advertising is based on the favorable evaluations and willingness to it. Metha
Consumer attitude toward green advertising - 22 (2000) argues that the influence of attitudes is an important area to study because of its implica-tions on the industry. In order to be effective or successful in the context of the advertising land-scape today, an advertiser has to break through the clutter to get the needed attention (Metha & Purvis, 1995).
Attitudes exist because they serve as a function for a person and are driven by a person’s motives. People can have the same attitude towards an object but there can be different reason behind it (Solomon, Bamossy, Askegaard & Hogg, 2010). Attitude and attitude changes can influence how people feel about their world and can have a direct or indirect effect upon their behavior in sev-eral situations (Cacioppo, Claiborn, Petty & Heesacker, 1991). Understanding attitudes are im-portant for advertisers since it is the attitude they need to make more favorable, toward a brand or a product (Solomon et al., 2010). In other words, to create ads that result in a positive attitude from consumers, it is important to understand what factors affect the attitude as well as to be able to know what kind of appeals to use to achieve the desired result. It is also important to re-member that advertising is often an unwelcomed intrusion and is therefore considered to be a source of irritation. Advertisers must therefore consider using the ad message to differentiate themselves on the market, and at the same time be aware of the risk of skeptical consumers (Ahmad, Shah & Ahmad, 2010).
The Ducoffe Extended Model (DEM)
3.4
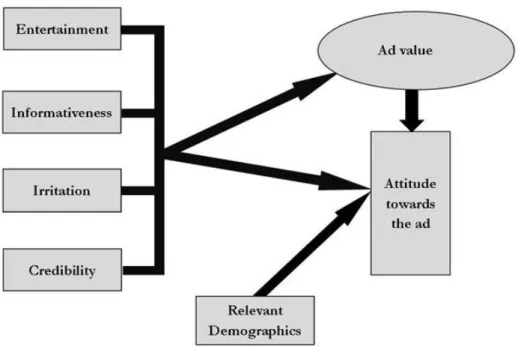
There is a vast array of models measuring advertising attitudes that have been developed throughout the years by researchers like Mackenzie and Lutz (1989), Ducoffe (1996) and Shavitt, Lowery and Haefner (1998). Based on the findings of the authors’ literature review conducted for this study, models and theories originally developed by Ducoffe (1995) for measuring attitude towards advertising on the web were selected. The initial model consisted of three different factors: Entertainment, informativeness and irritation, suggested by Ducoffe to build the foundation in the forming of attitudes towards an ad.
In the second stage the Ducoffe model was further developed with another factor. Mackenzie and Lutz (1989) and Shavitt et al., (1998) suggested adding the credibility factor, proposing the importance of a trust- and credibility factor in the forming of the attitudes towards the ad. Mackenzie and Lutz (1989) argued that it was important that the consumer perceived the ad as truthful and believable.
In the third stage, Shavitt et al., (1998) argued that relevant demographics play an important role on the attitude. Factors like income, gender, education and age affects the attitude toward advertising. For this particular study, gender, age and income have been chosen by the authors as relevant demographic factors.
Based on previous research, Brackett & Carr (2001) suggested a final stage of what the authors of this thesis will call the Ducoffe Extended Model (DEM). Bracket and Carr (2001) presented the edited and complete model in 2001. There have also been suggestions that demographics play an important role in attitudes, as previously mentioned (Shavitt et al., 1989).