THESIS
64CU-ATSM INTERNAL DOSIMETRY IN A COMPUTATIONAL TUMOR-BEARING MOUSE MODEL
Submitted by Paige Witter
Department of Environmental and Radiological Health Sciences
In partial fulfillment of the requirements For the Degree of Master of Science
Colorado State University Fort Collins, Colorado
Spring 2021
Master’s Committee:
Advisor: Alexander Brandl Del Leary
Copyright by Paige Witter 2021 All Rights Reserved
ABSTRACT
64CU-ATSM INTERNAL DOSIMETRY IN A COMPUTATIONAL TUMOR-BEARING MOUSE MODEL
The radiopharmaceutical Copper-64 diacetyl-bis(N4-methylthiosemicarbazones) (64 Cu-ATSM) has growing clinical interest as a theragnostic agent; that is, one that can be used as both a diagnostic tool and a treatment for certain tumors. The ATSM ligand selectively
distributes to hypoxic tissues, traditionally difficult targets for chemotherapy and radiotherapy cancer treatments. The copper radionuclide dissociates in the reducing environment, at which point the unique decay scheme of 64Cu offers multiple imaging and clinical pathways. Using an anatomically accurate voxelized phantom of a cancer-bearing mouse, a Monte Carlo N-Particle (MCNP) radiation transport code assessment of absorbed fractions and absorbed dose to major organs was carried out. In decay scenarios in which the organ of interest was the source organ, approximately 60% of the total energy transferred from a 64Cu decay came from the beta decay, approximately 30% from the positron decay, and approximately 1% from the Auger electrons.These results were used in conjunction with 64Cu-ATSM biodistribution data from two published studies to estimate organ and whole-body absorbed doses from administered
activities. The differences in organ absorbed doses between the studies shows the mouse model variances that can impact dose and lead to variability in dose-response curves down the line. An MCNP model allows for a better understanding of the organ-specific doses and should be considered in the development of future studies assessing the theragnostic properties of 64Cu-ATSM in translational models while sparing these models’ healthy organs and tissues.
ACKNOWLEDGEMENTS
I would like to thank all members of committee for their support during this wild year; most especially my advisor Dr. Alexander Brandl. Your guidance and endless patience have taught me invaluable lessons about how to approach a research problem, and how to pivot when unexpected events happen.
I would also like to thank the other professors in this department, Dr. Tom Johnson and Dr. Ralf Sudowe. When I joined the Health Physics team, I had no idea how broadly my horizons would be stretched, how many places I would go, and how interesting 20th century physicists and nuclear scientists could be.
A huge thank you goes to Justin Bell, who has mentored me through not only this Cu-ATSM project but walked me through a plethora of MCNP lessons and dosimetry techniques. Your focus, attention to detail, and commitment to your work is an inspiration. I’m excited to see where you go after this and hope to be half as knowledgeable as you when I leave.
Thank you to my mom, Roxana, who introduced me to the field of Health Physics in high school and made sure it was in the back of my mind through other plans and life experiences. A final thank you goes to my family, boyfriend, and friends who have kept me motivated through working from home, working through COVID, and going to classes remote.
Funding from the Nuclear Regulatory Commission, the Mountain and Plains Education and Research Center, the Health Physics Society, and CSU has allowed me to focus solely on my education through the last two years, and for that, I am truly thankful.
TABLE OF CONTENTS ABSTRACT ...ii ACKNOWLEDGEMENTS ... iii INTRODUCTION ... 1 Atoms ... 1 Radiation... 2 Half-Life ... 6 Activity ... 7
Interactions with Matter ... 7
64Copper... 11 Dosimetry ... 12 Internal Dosimetry... 14 64Copper- ATSM ... 15 MCNP6.2 ... 17 Voxel Models ... 19 VISED ... 20 Goals ... 20
MATERIALS AND METHODS ... 21
Mouse to Model ... 21
Dose Conversion ... 22
Dose Comparison ... 23
RESULTS... 24
Mouse Model ... 24
Absorbed Dose Fractions... 25
Organ Dose Estimates ... 28
DISCUSSION ... 32
Future Direction ... 35
INTRODUCTION
Atoms
The word atom is derived from atomos, a Greek word meaning “indivisible”. In 1913, two physicists in Ernest Rutherford’s British laboratory, Hans Geiger and Ernest Marsden, experimentally proved Rutherford’s hypothesis that atoms are divisible into a positively charged nucleus surrounded by negatively charged electrons. Later research found that the nucleus itself is made up of positively charged protons and electrically neutral neutrons, collectively called nucleons. While physicists have been able to prove that nucleons can be broken into even smaller parts, for the purposes of health physics and this research the proton, neutron, and electron are considered to be the fundamental particles that make up matter (Johnson, 2017, Chapter 3).
An atom’s element is determined by the number of protons in the nucleus, known as the atomic number (Z). Within an element, the number of neutrons within the nucleus is not constant and determines the isotope of the element. A particular atom characterized by a specific number of protons and neutrons is called a nuclide. The atomic mass number (A) is the sum of the protons and neutrons of the isotope. While most elements contain several isotopes, not all isotopes are equally abundant in nature. Therefore, the atomic weight is the weighted average of the masses of isotopes comprising that element. The number of electrons is equal to the number of protons in a neutral atom. Thus, isotopes of the same element have the same electron structures surrounding the nucleus and are difficult to be separated (ibid.)
The four fundamental forces of nature are the strong nuclear force, the weak nuclear force, the electromagnetic force, and the gravitational force. The strong nuclear force works on very small distances between nucleons, in opposition to the repulsive electromagnetic force that works between protons. Nuclear instability can exist if the neutron-to-proton ratio is too high or too low for a particular nuclide, contributing to available energy for a radioactive transformation (ibid.).
Radiation
Radioactive decay, or radioactive transformation, is the spontaneous transformation of the nucleus of an unstable atom. Of the 3,000+ known isotopes (and counting), only 254 are stable; that is, do not undergo radioactive decay (DOE Explains...Isotopes, 2021). Radiation is the emission of energy from a decaying or excited atom in the form of particles or
electromagnetic waves. Radioactive properties of atoms are independent of the physical and chemical state of the nuclide and cannot be changed or modified (Johnson, 2017).
There are three main mechanisms of radioactive transformations: alpha emission, fission, and isobaric transformations, along with isomeric transitions. Alpha emission, fission, and isobaric transitions are true nuclear transformations; that is, the structure of the nucleus changes after the decay. Isomeric transitions are instead the emission of energy from a nucleus in an excited state, but do not result in a different daughter nuclide (ibid.).
Alpha and fission decay change both the atomic number and atomic mass of the parent atom. Alpha decay occurs when the neutron-to-proton ratio in the nucleus is too low. In heavy nuclei, the nuclear instability is such that the Coulomb repulsion of the protons due to the
electromagnetic force increases more rapidly than the strong force cohesion of the neutrons and protons. An alpha particle is a helium (4He) nucleus: two protons and two neutrons with a collective +2 charge. Alpha particles are emitted almost monoenergentically- they only have the energy allowed from the nuclear transformation, but sometimes may not take all of it. In cases where the alpha particle does not take all the available decay energy, the daughter nucleus may be left in an excited state and undergo deexcitation by immediate emission of a gamma ray. Upon emission of the alpha particle, the neutron-to-proton ratio of the daughter atom is increased and stabilized compared to the parent (ibid.).
Fission occurs when a large, unstable nucleus splits into two or more smaller daughter nuclei. In some atoms, fission can be induced by a nucleus absorbing one or more neutrons, leading to an unstable atom that quickly breaks apart. It also occurs spontaneously in some very high-mass number isotopes. Fission decays often result in radioactive daughter fragments and releases of neutrons (ibid.).
Isobaric transformations change the atomic number of the parent nucleus, but the atomic mass stays the same. They involve the emission of a beta particle or an orbital electron capture. Beta-minus particles (e, often simply called beta particles) are indistinguishable from electrons, carrying a -1 charge. Beta-minus emissions occur when the neutron-to-proton ratio is too high for nuclear stability. A neutron transmutes to a proton, and an electron and anti-neutrino are emitted, as shown in the following equation:
𝑛 → 𝑝 + 𝑒 + 𝑣̅
The electron and neutrino share the available decay energy between them, and thus are emitted from the nucleus on a continuous energy distribution. “Pure” beta emitters involve a
nuclear transition to the ground state of the daughter nuclide. If the beta transformation does not use all the available energy and the daughter nucleus is left in an excited state, the
daughter nucleus may de-excite via an immediate gamma emission (ibid.).
Beta-plus particles, called positrons (e+), have the same mass as electrons but carry a +1
charge. Positron emissions occur in nuclei with low neutron-to-proton ratios. To improve the nucleon ratio, a proton transmutes to a neutron, and the atom emits a positron and neutrino as shown in the following equation:
𝑝 → 𝑛 + 𝑒++ 𝑣
Positrons are the antiparticle to electrons, and do not occur in nature. When a low-energy positron interacts with an atomic electron, the two particles annihilate, and their mass is converted to two 511 keV photons that are emitted 180∘ from each other. Positron decay only occurs if there is 1022 keV or greater energy available for the decay to occur. It competes with orbital electron capture (ibid.).
Orbital electron capture is another decay mechanism that can occur when the neutron-to-proton ratio in the nucleus of an atom is too low for stability. In it, an orbital electron, usually from the innermost electron shell (the K shell), is captured by a proton in the nucleus. The two particles are transformed into a neutron, and a neutrino is released as shown in the following equation:
𝑝 + 𝑒−→ 𝑛 + 𝑣
This is the only decay mechanism available for atoms with low neutron-to-proton ratios and less than 1022 keV available for the decay (two electron masses). If there is greater than 1022 keV available, electron capture competes with positron emission as a decay mechanism (ibid.).
Electron capture by the nucleus leaves a vacancy in the electron shell. This vacancy, usually starting in the lowest energy shell, is filled by an orbital electron from a higher-energy shell. The difference in energies between the electron shells can be emitted in two ways. It can be emitted as a photon with distinct energy, characteristic to the nucleus of the decay daughter atom. Thus, these photons are called characteristic X-rays. The energy can also be transmitted directly to another orbital electron in the same shell as the transiting electron, causing the former electron to be ejected from the atom. The ejected electron is called an Auger electron and behaves as any other beta particle would in matter. The initial vacancy can quickly become an Auger cascade, when further atomic transitions contribute to the ejection of more Auger electrons from higher orbitals. This can result in a highly positively charged ion, and many Auger electrons emitted into the surrounding matter (ibid.).
The final category of emissions from the atom are the isomeric transitions, in which the atomic number and atomic mass number of the daughter are the same as that of the parent atom. Isomeric transitions are not radioactive decay, but changes in the internal energy of the nucleus. This energy change can happen two ways: through the emission of a gamma ray, or via internal conversion (ibid.).
Gamma radiation is a form of electromagnetic radiation. It is indistinguishable from X-rays; the only difference being the production mechanism. X-rays are produced via energy transitions in the atomic shell, whereas gamma rays come from energy transitions in the nucleus. Both gamma and x-rays are photons: massless, chargeless electromagnetic radiation that is highly penetrating in matter (ibid.).
Gamma emissions occur via nuclear de-excitation following another decay or after energy is inserted into a nucleus, for example, after a neutron absorption. Gamma energies are characteristic to each radionuclide, and thus are often used to identify the element and
isotope. A radionuclide might have a simple decay scheme with a single characteristic gamma, or multiple decay paths, each with different transitions probabilities. The probability of any single gamma transition occurring is called the yield (ibid.).
Internal conversion (IC) competes with gamma emission as a mechanism for a nucleus to de-excite. During internal conversion, the energy from the excited nucleus is transferred directly to an electron close to the nucleus. The electron is ejected from the atom with kinetic energy equal to the nuclear excitation energy minus the binding energy of the electron. Thus, internal conversion electrons are monoenergetic, as opposed to having a continuous energy spectrum as is the case for beta particles (ibid.).
Half-Life
While radioactive decay is a stochastic (random) process on an atom-by-atom basis, a significant collection of identical radioactive atoms has a decay rate that can be expressed as a constant. The half-life is the time it takes for one-half of a given quantity of atoms to undergo radioactive decay, is characteristic to a particular isotope, and constant over the lifetime of the decaying quantity. The range of half-lives of radioactive atoms spans from nearly instantaneous to longer than the age of the universe (ibid., Ch.4). The transformation rate, or decay constant 𝜆, is related to the half-life (𝑇1
2
𝜆 =ln(2)𝑇 1 2
Activity
Due to differences in half-lives, the mass of radioactive materials is not representative of its radioactivity. The quantity of radioactivity must therefore be based on the number of
radioactive decays occurring within a specific timeframe, called the activity. The SI unit of activity is the Becquerel (Bq): the quantity of radioactive material in which one atom is transformed per second (1 Bq = 1 transition per second = 1 tps) (ibid.).
Since the half-life of an isotope is constant and immutable, a graph of activity versus time shows that activity follows an exponential decay process. The amount of activity left after a given time interval is given by:
𝐴(𝑡) = 𝐴0𝑒−𝜆𝑡
where A0is the initial activity, A(t) is the activity after a given time t has passed, and 𝜆 is the
decay constant (ibid.).
Interactions with Matter
As ionizing radiation moves through matter, energy is transferred from the radiation to the matter in the form of excitations and ionizations. Radiation can interact with the atomic nuclei or extranuclear electrons of the matter; most usually, it interacts with the electrons via the electromagnetic interaction. Charged particle radiation has an electrostatic filed, and the attractive and repulsive forces between that field and matter are the primary method of
interaction. The penetrating power of a particular radiation; that is, the depth the particle or wave travels in a certain material, depends on a number of factors. These include the type and energy of the radiation and the nature of the absorbing medium, all of which contribute to the amount of energy transfer from the radiation to the medium. Radiation interactions can be classified by the amount of energy that ionizing radiation transfers per unit length traveled in a specific material, known as the linear energy transfer (LET). LET depends on the type of
radiation, its energy, and the matter through which it is traveling. High LET radiation has a greater density of interactions at an atomic level than low LET radiation. Thus, high LET
radiation is attenuated, or stopped, more quickly, and more energy is transferred along a short path. Low LET indicates that radiation has higher penetration in a particular material, and energy is transferred more slowly along the path of the radiation (ibid.).
Alpha particles and heavy charged ions transfer energy to matter via excitations and ionizations, primarily though collisions with electrons in the matter. Due to the high charges and relatively slower speeds, successive collisions over very short distances lead to the loss of all of the initial kinetic energy of the particle. Alpha particles therefore have high LET, and in tissue only penetrate on the order of micrometers. Alpha particles cannot penetrate even the outer layer of dead skin, and so are not considered an external radiation risk. However,
radioactive materials that emit alpha particles are hazards if they decay inside the body, where alphas can transfer large amounts of energy directly to cells and DNA (Institute of Medicine, 1995; Johnson, 2017).
Beta particles mainly interact with matter through electromagnetic interactions with the orbital electrons of the absorbing medium. These interactions can generally be thought of as
inelastic collisions between particles of equal mass. The energy loss of the incident beta particle depends on its initial kinetic energy and the distance of approach to the collision. Low-energy beta particles are slower than high-energy betas, allowing for more time to electromagnetically interact with the medium they are moving through. Beta particles of increasing energy have lower LET, up to around 1-3 MeV. At that point, further increases in beta energy have small increases in LET. Beta particles typically penetrate around a centimeter in tissue, and so are not an external radiation hazard unless they are present in high concentrations. If radioactive nuclei decay by beta emission inside the body, they can deposit energy, although along a longer path than alpha particles (Johnson, 2017).
Positrons, or beta-plus particles, are of equal mass as electrons, but carry a positive charge (+1) and are by definition the antimatter complement to electrons. Due to the equal size, the electrostatic interaction and energy transfer between a positron or orbital electron and the atomic nuclei is approximately the same as a beta particle, regardless of the attractive or repulsive electrostatic force. Thus, positrons interact similarly with matter (or antimatter) when they are energetic, and have similar ranges and energy losses (ibid.). However, positrons differ significantly from electrons at the end of their path. When a positron interacts with an electron, it loses all its kinetic energy, resulting in the annihilation of both particles. Their rest mass is completely converted to electromagnetic energy in the form of two oppositely directed 0.511 MeV gamma rays (photons). Therefore, any positron decay also includes photons (ibid.).
Electromagnetic radiation (gamma and X-rays) differs from alpha and beta radiation in the mechanisms of interaction with matter. A photon can knock an orbital electron from an atom of the medium through which it travels in one of two ways. The first, called Compton
scattering, is a collision between the incident photon and an orbital electron, whose binding energy is much less than the energy of the photon. The electron is knocked loose, and the photon is scattered with lower energy. The newly freed electron is called a Compton electron. The second interaction, photoelectric absorption, occurs when all of the incident photon’s energy is transferred to an orbital electron, causing the photon to disappear and kicking the electron off the atom with kinetic energy equal to the energy of the photon minus the binding energy of the electron. Photons themselves have low LET compared to the particulate decays. It is the secondary photoelectrons, along with Compton electrons, that transfer energy to matter via excitations and ionizations. Compton scattering and photoelectric absorption are the main interaction mechanisms that transfer energy when a photon’s energy is lower than 1022 keV (ibid.).
In pair production interactions, a photon with energy exceeding 1022 keV passing by a nucleus may have all of its energy converted into mass via the production of an electron and a positron pair. Any energy that the photon had beyond the rest mass energy of the two particles (2 x 511 keV) is converted to kinetic energy. The secondary electron and positron then interact with the matter in the same manner as beta particles, leading to eventual positron annihilation. The likelihood of pair production increases as the atomic number of the medium through which the photon travels increases with increasing photon energy (ibid.).
Photonuclear absorption, the fourth photon interaction mechanism, occurs with high-energy photons and involves a nucleus capturing the photon and becoming excited. In most cases, the nucleus de-excites via the emission of a neutron. While photonuclear absorption does not occur with most decay-produced photons, the mechanism is important in accelerator
and reactor experiments in which high-energy ion accelerators produce high energy photons. The photonuclear interaction is often used as a source of neutrons, or in (𝛾,n) reactions to transmute one nuclide to another (ibid.).
64Copper
64Copper (64Cu) is a radionuclide with a 12.7-hour half-life. It decays via electron capture
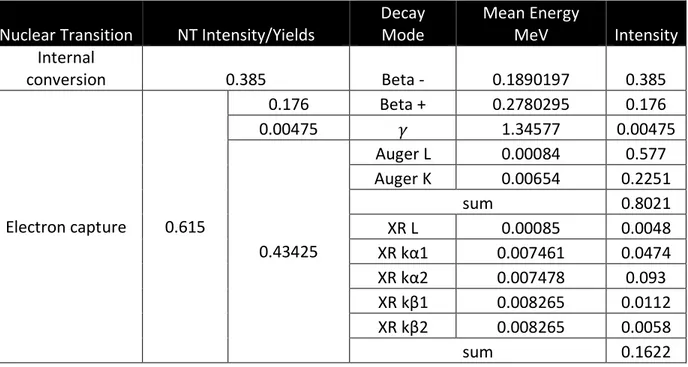
and competing positron emission to 64Ni, or via beta-minus emission to 64Zn. The following decay scheme (Table 1) was provided by the National Nuclear Data Center (B. Singh, 2007). Specific beta-minus and positron spectra were provided to this lab by Keith Eckerman (Eckerman et al., 1994); these spectra were used in the MCNP model of the decays. The weighted average of the emissions was calculated as the mean energy in MeV of the beta-minus and positron emissions.
Table 1. 64Cu decay scheme. The mean energies of the beta-minus and positron decays are the weighted average of the energy emission spectra.
Nuclear Transition NT Intensity/Yields
Decay Mode Mean Energy MeV Intensity Internal conversion 0.385 Beta - 0.1890197 0.385 Electron capture 0.615 0.176 Beta + 0.2780295 0.176 0.00475 𝛾 1.34577 0.00475 0.43425 Auger L 0.00084 0.577 Auger K 0.00654 0.2251 sum 0.8021 XR L 0.00085 0.0048 XR kα1 0.007461 0.0474 XR kα2 0.007478 0.093 XR kβ1 0.008265 0.0112 XR kβ2 0.008265 0.0058 sum 0.1622
64Cu is not naturally occurring and must be produced in a laboratory or reactor setting.
The most common production method is via the 64Ni (p, n) 64Cu reaction, in which a nickel target is bombarded with low energy protons from an accelerator or cyclotron (Kume et al., 2012; Xie et al., 2017). Other methods involve the thermal neutron 63Cu (n, 𝛾) 64Cu reaction (Chakravarty et al., 2020), and the fast neutron 64Zn (n, p) 64Cu reaction (Zinn et al., 1994)
Dosimetry
Radiation dose is defined as the amount of energy absorbed per unit mass from incident radiation (NRC, 2020). The SI unit of absorbed dose is the Gray (Gy), where 1 Gy is equal to 1 J/kg. The biological impact of the absorbed dose depends on a variety of factors, including the time over which the exposure was spread, the tissue or organ in question, the type of radiation transferring energy, and the organism itself. High doses of radiation over a short time can have quick-showing, deterministic effects of cell and tissue death, organ failure and potential death. Lower radiation doses, or those spread over a longer time, can result in stochastic effects, for example, an increase in the risk of developing cancer. The measure of the biological risk to living tissues as a result of radiation exposure is called the equivalent dose, with SI units of Sieverts (Sv) (Johnson, 2017).
If emitted inside a cell, high LET radiation such as alphas and low-energy betas can cause significant DNA damage in the form of double-strand DNA breaks. However, low LET radiation like gammas may not deposit all their energy in the cell where they are emitted, and so may not have the same biological effect (ibid.). Beta particles can penetrate tissue and matter to varying depths depending on their energy. High energy beta particles are fast, and interact less with the
atoms in the absorbing material, so are considered lower-LET radiation. However, when they are low energy, they travel slowly enough to increase the density of interactions with the surrounding material, thus LET increases as beta energy decreases. Additionally, due to the loss of energy as particle radiation penetrates matter, LET increases as the particle penetrates deeper. The highest energy transfer takes place at the end of the path. The radiation weighting factor, wR, takes into account the additional biological effect that high LET radiation can have
compared to low LET radiation of the same dose (ICRP 103, 2007).
Furthermore, some tissues are more radiosensitive than others; specifically, rapidly dividing cells such as the gastrointestinal tract, bone marrow and blood cells, and skin cells are more prone to DNA damage (Rubin & Casarett, 1968). The relative sensitivity to adverse biological effects is expressed in the tissue weighting factors, wT (ICRP 103, 2007). The effective
dose in Sv is then a measure of the risk of a stochastic radiation effect and is the absorbed dose in Gy modified by the radiation and tissue weighting factors (Johnson, 2017).
Radioactive particles may be either external or internal to the body. Internal radiation sources are often used in medicine for a variety of purposes. These include therapy, in which energy is targeted to a certain area of the body for a medicinal purpose, and diagnostics, in which radioactive particles or electromagnetic waves are used to investigate some aspect of the body. A strategy that serves both therapeutic and diagnostic purposes is called a theragnostic procedure (Anderson & Ferdani, 2009; Johnson, 2017; Ku et al., 2019).
Internal Dosimetry
The internal radiation dose is the dose from radiation released by radioactive materials deposited inside the body. While the range of particulate radiation in tissue is typically very short, electromagnetic radiation can travel great distances through a body and thus transfer energy to organs far away from the point of decay. The source organ (S) is the tissue in which a radionuclide decays, while the target (T) is the organ or organs that absorb energy from that decay (Johnson, 2017). The source and target organs may be the same or different organs, with various relationships shown in Fig. 1.
Figure 1. Possible source (S) and target (T) organ relationships. Reproduced from (Johnson, 2017, p. 245)
Typically, internal dose calculations of purposeful internal sources necessitate
knowledge of the radiological half-life, biological half-life, biodistribution properties, method of entry, and initial radioactivity level. Accurate values of absorbed dose are important in
investigating a dose-response relationship, especially for purposively administered radionuclide procedures (Gupta et al., 2019; Johnson, 2017). The Medical Internal Radiation Dose (MIRD) schema was conventionally used to calculated organ-level absorbed dose; however, this does
not take into account patient-specific activity distributions, heterogenous tissue compositions, or individual variability in anatomy. Recent research investigates the use of anatomically accurate computer models that simulate individual radiation particles and their interactions to more precisely calculate organ absorbed doses. Using patient-specific anatomy and
biodistribution of radioactive nuclei allows for individualized dosimetry and more accurate dose-response relationships (Gupta et al., 2019).
64Copper- ATSM
Diacetyl-bis (N4-methylthiosemicarbazone) (ATSM) labelled with the radioisotope 64Cu is a radiopharmaceutical that has shown promise in both cancer imaging and therapy uses (Anderson & Ferdani, 2009; Fujibayashi et al., 2020; Obata et al., 2005). 64Cu-ATSM has been found to accumulate in hypoxic tumor environments in vitro (Obata et al., 2005) and in vivo (Lewis et al., 1999) . Under highly reduced conditions (cells with abnormally high electron concentrations), Cu(II) is reduced to Cu(I) and divides easily from the ATSM molecule (Burgman et al., 2005; Fujibayashi et al., 1997; Obata et al., 2001). However, the Cu retention was also found to be cell line dependent (Burgman et al., 2005) . Tissue hypoxia may be induced by a lack of vascularity or an increased metabolic rate, both factors that may be present in some fast-growing tumors and contribute to tumor resistance to conventional radiotherapy and chemotherapy (Moulder & Rockwell, 1987; Peters et al., 1983).
In in vivo murine studies, 64Cu-ATSM uptake from the blood peaked at 5 min post- injection, with maximum 64Cu accumulation in hypoxic tumor tissue at 1-hour post-injection (Lewis et al., 1999). 24 hours after in vitro 64Cu-ATSM treatment of tumor cells, they showed
typical features of radiation-induced apoptosis, and the tumor cell rate of clonogenic survival was reduced in an injected dose-dependent manner (Obata et al., 2005).
Due to its unique decay scheme, many studies have looked at the use of 64Cu-ATSM as a theragnostic agent- one that can be used as both an imaging tool and a treatment against tumors. The low energy, high LET Auger electrons have been the subject of study for short-range, high dose radiotherapy treatments, in which they have been found to effectively kill cancer cells when emitted near and inside the cell nucleus (Ku et al., 2019; McMillan et al., 2015). The positron emissions have been used in positron-emission tomography (PET) for diagnostic purposes (Anderson & Ferdani, 2009; F. Li et al., 2015).
Radiolabeling, the tagging of a molecule with a specific isotope, can control the
biodistribution of the isotope in an organism. Cu-ATSM has been used for detection of hypoxia and sustained accumulation of Cu-ATSM has been seen in hypoxic, but not normoxic conditions (Fujibayashi et al., 1997; Liu et al., 2020; Obata et al., 2005). The accumulation of radioactivity in tissues can be expressed as the fraction of the injected activity. In clinical fields, this injected activity is called the injected dose (ID), not to be confused with radiation absorbed doses from the decay of the radionuclide. Generally, the distribution of the activity is reported as the fraction of the injected dose per gram: %ID/g or %ID per organ (%ID/organ). Standard mouse organ masses or organ masses calculated from the specific model used in the study can be used to calculate %ID/organ values from %ID/g values.
Multiple studies have investigated the distribution of Cu-ATSM in various tumor-free and tumor-bearing mouse models (Hueting et al., 2014; Yoshii et al., 2014). In these studies, a set activity was injected into the mouse, and positron-emission tomography (PET) whole-body
dynamic images were acquired. Then, the mice were sacrificed, and the activity of the organ, tissue and tumor samples were counted using a gamma counting system. Yoshii et al. used the biodistribution data of the mice (%ID/g values) to estimate the mean absorbed doses of 64 Cu-ATSM (mSv/MBq) in humans; however, they did not report the mean absorbed doses in the organs of the mice. Similarly, Hueting et al. did not report the organ absorbed doses from administration of the 64Cu-ATSM in mice. The lack of data around specific organ doses could lead to incorrect dose-response curves when looking at the biological effects of 64Cu-ATSM in specific organs. This study aims to show that the reported biodistribution data in conjunction with the modeled absorbed fractions can be used to calculate accurate organ absorbed doses to various mouse organs.
MCNP6.2
Monte-Carlo n-particle transport code (MCNP) is a collection of software packages developed and continuously updated by Los Alamos National Laboratory (LANL) and made available through the Radiation Safety Information Computational Center (RSICC). At its most basic, the software generates a particle at a location, sends it in a particular direction, has it interact with matter, and eventually terminates that particle. It simulates the transport based on defined probability density functions; with the runs of many particles (on the order of millions or billions) one obtains an average of the quantity of interest, often fluence, energy distributions, or energy depositions. MCNP has many applications, from shielding calculations, to dosimetry, to criticality calculations (Wener, 2017).
The MCNP input is broken into three sections: the cell, surface, and data cards. A 3-D geometry of the problem is built by combining surfaces (planes, infinite cylinder, etc.) to become bounded cells. All space in the structured universe of the MCNP problem must be uniquely defined by a cell and the material that fills it (ibid.).
Data cards define all parameters of the problem outside of the geometry, including the radiation source location, the types of particles started and tracked, the materials, and the tallies. Most data cards have an MCNP-defined default, allowing the user to only specify the parameters they need. The mode card specifies the type of particles the program should track, with the ability to track more than one type of particle (neutrons, photons, electrons, positrons, etc.). In contrast, a user is only able to start the problem with one type of particle, specified in the source definition card. This limitation requires multiple MCNP runs with different starting particles (i.e., different input files) if a decay scheme involves more than one decay mechanism (ibid.).
Material cards are a list of the matter used in the problem and its physical composition, including density, isotope makeup, and atomic or mass fractions of those isotopes. While complex materials can be defined specific to the problem, the Pacific Northwest National Laboratory (PNNL) has provided a large compendium of common materials and their densities and compositions. Conveniently, it also provides sample MCNP material card inputs. The PNNL materials list is frequently based on ICRP 110 or ICRU 46 (McConn et al., 2011).
The source definition (sdef) card is used to define the radiation source in terms of
energy, source location, spatial extension, direction, and particle type. These parameters can be modified using si and sp cards. The si card gives information about a particular variable- if it is
binned, discrete, or uses a particular distribution for example. The sp card is used to define the probability of choosing a particular value provided in the si card. The source location can be defined using Cartesian coordinates or one or more of the surfaces defined in the surface cards. The energy of the starting particle can be monoenergetic or sampled from a discrete spectrum, which can include enough bins to approximate a continuous spectrum (Schwarz et al., 2011; Wener, 2017).
The tally card is used to specify the quantity that a researcher wants MCNP to track. There are multiple quantities available, including the surface fluence (F2), fluence through the cell (F4), fluence at a point (F5), and energy deposition in a defined location (*F8). All values are scaled by the number of particles emitted by the source; thus, the MCNP output does not relate to the activity of a real source (ibid.). This study used the*F8 tally to obtain the energy
deposition per starting particle in the specified universe-defined organ in units of MeV.
Voxel Models
MCNP’s repeated structures capability extends the cell concept by allowing cells and surfaces that have the same material fill to only be defined once. The cell-parameter keyword U identifies the universe to which a cell belongs, while the FILL parameter specifies with which universe a cell is to be filled. A universe can be specified as a lattice (LAT), an infinite array of hexahedra (LAT=1) or hexagonal prisms (LAT=2). This research uses a hexahedral lattice. A cell can be filled by a collection of cells that are assigned to the same universe using a FILL card. The voxel models can be used to define an anatomical geometry, where organs defined by a
VISED
The Visual Editor (VISED) is a graphical user interphase for MCNP, released by the Radiation Safety Information Computation Center and created by Visual Editor Consultants (Richland, WA). It allows a user to upload a MCNP input file and visualize the geometry in 2-D and 3-D, along with boundary and material differences. It has some limited capabilities to plot particle tracks and source definition points, which are helpful to validate the input file (Schwarz et al., 2011).
Goals
This study used a MCNP voxel model of a mouse with a tumor to investigate the energy deposition in various organs by the five different radiation emissions of 64Cu. We predicted that the Auger electron decay would contribute significant energy deposition and absorbed dose to the organ in which it is emitted, helping to explain the clinical findings that Auger electrons contribute to cell death (Fujibayashi et al., 2020; McMillan et al., 2015). Additionally, we validated that it is possible to obtain estimates of organ and whole-body absorbed dose using the absorbed dose fractions from the MCNP model and reported radiopharmaceutical
biodistribution data. This procedure could be used in future in vivo studies to obtain more accurate dose-response relationships and improve the outcome of theragnostic procedures.
MATERIALS AND METHODS
Mouse to Model
The base MCNP mouse model used in this study was produced by our research group at Colorado State University (CSU), using the methodology described in Bell’s 2015 study (Bell, 2015), starting with the acquisition of a computed tomography (CT) scan of a prone mouse. The CT image was exported as a Digital Imaging and Communications in Medicine (DICOM) file. The DICOM file was used in the 3D-DOCTOR (Able Software Corp., Lexington, MA.) medical
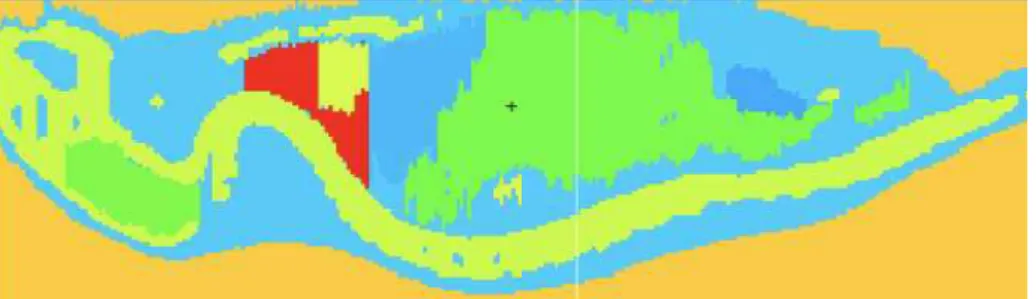
modeling software to create an anatomically accurate phantom from the mouse CT image. Regions of interest were identified through boundary editing tools, notably defining anatomical objects of the mice organs. A 3D image of the mouse’s specific tissues and organs was created and exported as a boundary file (.bnd). Another software tool, Voxelizer (Human Monitoring Laboratory, Ontario, Canada), was used to convert the .bnd files to a voxelized format compatible with MCNP (Fig. 2).
Figure 2. VISED representation of the MCNP mouse model, with colors indicating different organ materials.
The voxelized MCNP model was run for 7,000,000 histories of each of the five decay mechanisms of 64Cu discussed above, in each of the 13 defined organs, for a total of 65 MCNP runs. The organ universes were filled by the standard organ densities and atomic compositions
listed in the PNNL materials compendium (McConn et al., 2011). Each organ had a tally to collect data in every run, for a total of 845 data points collected from the modeling.
Dose Conversion
The *F8 tally was used to find the energy deposited per transformation in each organ of interest in units of MeV. The absorbed fraction of energy was calculated by dividing the energy deposited per transformation by the energy of the starting particle or weighted mean energy if the particle had an emission spectrum (the Auger electron, beta, positron, and x-ray models) (Table 1). A conversion factor of 1.60218e-13 J/MeV was used to convert the energy deposited per transformation to J. The volumes of each organ, given by the 3D-Doctor segmentation code, were multiplied by the tissue densities from the PNNL material compendium to obtain the model-specific organ masses. The resulting energy deposition was divided by the mass of the target organ to obtain the dose to each organ per nuclear decay mechanism, as shown in the following equation:
𝐸 ×(1.60218 × 10⁻¹³ J
MeV) 𝑉 × 𝜌 × 1kg1000g = 𝐷𝑠𝑝
where E is the energy deposited in the target organ (MeV) per starting particle, V is the volume of the target organ (cm2), 𝜌 is the standard tissue density (g/cm3), and D
sp is the absorbed dose
in the target organ per starting particle in the source organ (Gy).
Finally, the doses to the target organs from each emission type were weighted by the probability of the decay mechanism (Table 1) and summed to obtain the absorbed dose to each target organ from a single decay of 64Cu in the source organ.
Dose Comparison
Data from two in-vivo 64Cu-ATSM mouse studies were used to obtain the biodistribution of the radiopharmaceutical (Hueting et al., 2014; Yoshii et al., 2014). Using the injected dose and %ID/g from the studies, and the organ mass from our mouse model, the activity of the radiopharmaceutical within each organ was calculated. Then, the dose to each organ per 64Cu decay was multiplied by the activity per organ to obtain the organ dose. Finally, whole-body absorbed dose to the mouse was calculated by summing the organ doses.
RESULTS
Mouse Model
The mouse model was segmented into the following tissues: Brain, Left Kidney, Right Kidney, Lungs, Liver, Gastrointestinal tract (including the stomach, small intestine, and large intestine), Heart, Bladder, Tumor, Bone, and the Remainder of Body (RB, made up mainly of the muscle and skin). Both the left and right lenses of the eyes were initially included, but very small organ volumes (one voxel in width) led to very high relative errors and so they were excluded from the reported organs. The masses of each organ, shown in Table 2, were obtained by multiplying the organ volume from 3D-Doctor by the corresponding tissue density from the PNNL Compendium of Material Composition Data (McConn et al., 2011) and ICRP 145 (Kim et al., 2020).
Table 2. Mass of mouse model organs.
Organ Mass (g) Remainder of Body (RB) 26.194 Brain 0.267 Left kidney 0.189 Right kidney 0.149 Lungs 0.474 Liver 1.226 GI 3.752 Heart 0.122 Bladder 0.034 Tumor 0.089 Bone 3.753
Absorbed Dose Fractions
Each of the five decay mechanisms of 64Cu were run in MCNP, with the particle starting in each of the 11 source organs. The result of every tally was the energy deposited per starting particle in the target organ in MeV. The tally value was converted to Joules using a conversion factor of 1.60218 x 10⁻¹³ J/MeV. That value was multiplied by the decay yield of the radiation mechanism (Table 1) to obtain the Joules absorbed per radioactive decay of 64Cu due to that specific decay mechanism. The values of each type of decay mechanism were summed to calculate the average Joules absorbed per 64Cu decay, inclusive of all decay mechanisms.
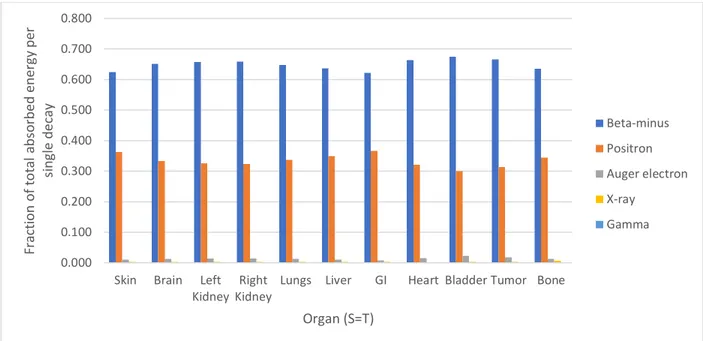
The contribution to the average total energy deposited in an organ from 64Cu decay in that organ by a specific decay product was calculated (Fig. 3). The beta-minus decay typically deposited above 60% of the total energy from a 64Cu decay in an organ, while the positron deposited above 30% of the energy. The Auger electrons only deposited about 1% of the total energy. It is important to note that these values do not show the energy deposited by every decay of 64Cu in that organ, but represent a hypothetical decay in which every decay
mechanism occurs and delivers a dose weighted by the probability that the specific decay mechanism occurs.
Figure 3. Fraction of the average total absorbed energy per 64Cu decay by radiation type, for decay situations in which the source organ of the decay is also the target organ measured.
Finally, the average absorbed dose in Gray in each target organ due to a 64Cu decay in a source organ was calculated by dividing the Joules absorbed by the mass of the target organ (Table 3). 0.000 0.100 0.200 0.300 0.400 0.500 0.600 0.700 0.800
Skin Brain Left Kidney
Right Kidney
Lungs Liver GI Heart Bladder Tumor Bone
F ra ct ion of t ot a l a bs orbed ene rg y per si ng le de cay Organ (S=T) Beta-minus Positron Auger electron X-ray Gamma
Table 3. Absorbed dose in Gray per decay of 64Cu, from source to target organ in the MCNP mouse model. Source Organs Target Organs RB Brain Left Kidney Right
Kidney Lungs Liver GI Heart Bladder Tumor Bone
Total to Organ RB 3.9E-13 1.2E-13 2.0E-13 2.0E-13 1.8E-13 1.3E-13 1.3E-13 1.5E-13 3.9E-13 2.0E-13 2.5E-13 2.3E-12 Brain 2.1E-13 3.0E-11 7.0E-16 8.2E-16 4.3E-15 1.3E-15 7.2E-16 4.6E-14 3.9E-16 1.8E-16 1.4E-12 3.2E-11 Left Kidney 3.5E-13 7.5E-16 3.9E-11 8.5E-13 1.7E-14 1.6E-13 1.2E-12 4.9E-14 3.8E-15 1.3E-15 1.3E-13 4.2E-11 Right Kidney 3.6E-13 8.8E-16 9.0E-13 4.7E-11 3.5E-14 1.1E-12 8.3E-13 2.1E-14 2.1E-15 1.2E-14 1.2E-13 5.1E-11 Lungs 3.1E-13 4.5E-15 1.6E-14 3.3E-14 1.7E-11 1.5E-12 5.8E-14 7.7E-12 7.6E-16 4.1E-16 6.5E-13 2.7E-11 Liver 2.2E-13 1.3E-15 1.5E-13 9.9E-13 1.5E-12 7.9E-12 6.9E-13 1.7E-12 1.2E-15 1.1E-15 1.6E-13 1.3E-11 GI 2.2E-13 6.1E-16 1.1E-12 8.0E-13 5.6E-14 6.9E-13 3.3E-12 3.9E-14 6.2E-13 2.2E-14 7.9E-14 6.9E-12 Heart 2.8E-13 2.4E-15 8.2E-15 9.4E-15 8.3E-12 1.8E-12 4.3E-14 5.3E-11 8.5E-16 5.0E-16 3.5E-13 6.4E-11 Bladder 7.8E-13 2.8E-16 5.0E-15 2.5E-15 6.5E-16 1.3E-15 8.2E-13 7.4E-16 1.3E-10 5.3E-14 2.7E-13 1.4E-10 Tumor 3.6E-13 3.6E-16 1.8E-15 1.3E-14 5.4E-16 1.6E-15 2.5E-14 6.6E-16 4.7E-14 6.5E-11 1.2E-13 6.6E-11 Bone 4.8E-13 1.5E-12 1.5E-13 1.2E-13 6.7E-13 1.8E-13 9.1E-14 3.6E-13 2.6E-13 1.2E-13 2.2E-12 6.1E-12
Organ Dose Estimates
Two published studies with 64Cu-ATSM biodistribution data in tumor-bearing and non-tumor bearing mouse models were used to estimate organ and whole-body absorbed doses from tracer and therapeutic injections of 64Cu-ATSM.
In the first study by Hueting et al. (2014), 10 MBq of 64Cu-ATSM were injected into the lateral tail vein of CBA mice bearing CaNT tumors over 1 second. The biodistribution of the radiopharmaceutical was reported at 15 minutes, 2 hours, and 16 hours in the blood, tumor, muscle, stomach, small intestine, large intestine, spleen, liver, kidneys, heart, and lungs. The amount of radioactivity in the organs and tissues was reported as the percentage of the injected dose per gram (%ID/g) (Hueting et al., 2014):
%ID g =
𝑎𝑐𝑡𝑖𝑣𝑖𝑡𝑦𝑖𝑛𝑡𝑖𝑠𝑠𝑢𝑒
(𝑤𝑒𝑖𝑔ℎ𝑡𝑜𝑓𝑡𝑖𝑠𝑠𝑢𝑒)× (𝑎𝑐𝑡𝑖𝑣𝑖𝑡𝑦𝑖𝑛𝑗𝑒𝑐𝑡𝑒𝑑) × 100
Radiation absorbed doses in the organs and whole-body absorbed dose to the mice were not reported. The biodistribution data for organs that matched those in the model were used. Since the study reported the stomach, small intestine, and large intestine as three separate organs, the %ID/g were summed to account for the GI tract in this study’s mouse model. Accordingly, the mass of the GI tract from this study’s mouse model was used. Similarly, the activity in both kidneys was reported as a single value. The %ID/g was divided by two to use the current study’s separate kidney masses and absorbed dose calculations. The spleen and muscle were not included in the MCNP model and were summed to use the data for the Remainder of Body.
For this study, the reported %ID/g was multiplied by the activity injected (10 MBq) and the mass of the organ from the mouse model to obtain the expected activity in each model
by plotting the three time points (15 minutes = 900 seconds, 2 hours = 7200 seconds, 16 hours = 57600 seconds) and associated activities (in Bq) and finding the area under the curve (AUC). Finally, the total number of decays in the source organ over the 16 hours was multiplied by the dose in Gray absorbed in each target organ per decay of 64Cu in the source organ (Table 4). The dose to each organ were summed to estimate the whole-body absorbed dose to the mouse: 6.02 Gy.
Table 4. Absorbed dose in Gray to the mouse model organs over 16 hours, using biodistribution data from Hueting et al., 10 MBq of 64Cu-ATSM injected.
Target Organs Dose (Gy)
Skin 0.21 Brain 0.08 Left Kidney 0.75 Right Kidney 0.66 Lungs 0.52 Liver 0.83 GI 1.45 Heart 0.45 Bladder 0.62 Tumor 0.20 Bone 0.24 Whole Body 6.02
Next, the organ and whole-body absorbed dose to the mouse model were estimated based on the biodistribution of 64Cu-ATSM reported by Yoshii, et al. (Yoshii et al., 2014). A tracer amount of 64Cu-ATSM (185 kBq) was injected into HT-29 tumor-bearing BALB/c male nude mice with or without penicillamine treatment. The penicillamine treatment was designed to reduce radiation exposure in non-target organs, particularly the liver. In the experiment with tumor-bearing mice, biodistribution data were reported at 2, 4, 6, 16, and 24 hours in the same organs, plus the tumor (Yoshii et al., 2014). The activity in the organs and tissues was again
reported as (%ID/g) in a bar graph (Yoshii et al., 2014), and were approximated for their use in this paper. Similar to Hueting et al.’s study, radiation absorbed doses in the organs and whole-body dose to the mice were not reported.
Yoshii et al. included the biodistribution data for the small intestine and the large intestine, which were summed to be compatible with the gastrointestinal (GI) data from this study’s mouse model. The activity in both kidneys was reported as one kidney; accordingly, the reported %ID/g was divided by two to use the current study’s separate kidney masses and absorbed dose calculations. The organ and whole-body absorbed doses in Table 5 were calculated as described above.
Table 5. Absorbed dose in Gray to the mouse model organs over 24 hours, using biodistribution data from Yoshii et al., 185 kBq of 64Cu-ATSM injected with no penicillamine.
Target Organs Dose (Gy)
Skin 0.00 Brain 0.00 Left Kidney 0.02 Right Kidney 0.02 Lungs 0.01 Liver 0.04 GI 0.04 Heart 0.01 Bladder 0.01 Tumor 0.00 Bone 0.00 Whole body 0.16
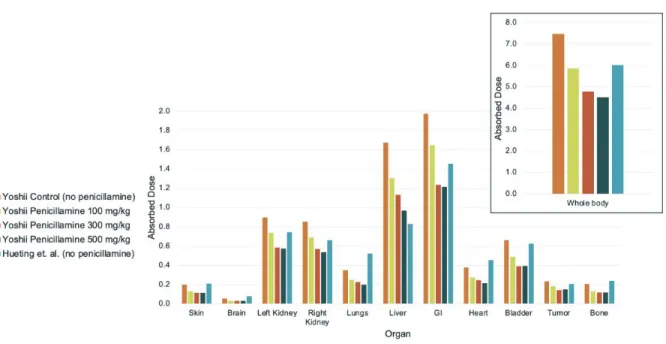
To compare absorbed doses between the Hueting et al. and Yoshii et al. studies, the biodistribution data from the Yoshii study were approximated for 10 MBq of 64Cu-ATSM injected dose and calculated over a 16-hour period. The whole-body absorbed doses did fall, along with the doses to the tumor and liver (Fig. 4).
Figure 4. Absorbed dose in Gray to the mouse model organs over 16 hours, using
biodistribution data from Yoshii et al., assuming 10 MBq of 64Cu-ATSM injected and varied penicillamine treatments, compared to biodistribution data from Hueting et al., assuming 10 MBq of 64Cu -ATSM injected.
DISCUSSION
64Cu-ATSM is a radiopharmaceutical that has been examined for its potential as a
theragnostic agent, particularly in regard to overreduced hypoxic tumor environments
(Fujibayashi et al., 1997, 2020; Hueting et al., 2014; Yoshii et al., 2014, 2018). Multiple studies in rodents have shown its use as a tracer for positron-emission tomography (Anderson & Ferdani, 2009; Fujibayashi et al., 1997) and have correlated injected dose to survival and tumor control (Yoshii et al., 2018). However, an analysis of the organ absorbed doses and whole-body
radiation absorbed dose in a mouse model does not appear to have been reported previously. To this end, a MNCP-compatible voxelized mouse model was examined in MCNP in order to determine the average absorbed dose in various target organs from a single 64Cu decay in a source organ in the mouse body. The total absorbed fraction in Gray per organ was used with published 64Cu-ATSM biodistribution data to estimate the organ absorbed doses and whole-body absorbed dose from a known injected activity.
From a purely physical perspective, it is unsurprising that even on the small scale of the mouse, the target organ absorbed the most energy when it was itself the source organ (Table 3). Additionally, the beta, Auger, and positron decays had generally higher energy absorbed fractions per particle decay than the gamma and X-ray decays when the source organ was the target organ (Fig. 2). The Auger electrons deposited approximately ¾ of their energy in the source organ per decay, supporting the hypothesis that the Auger electrons are contributors toward radiation dose. However, the average Auger electron decay energy (0.0024 MeV) was smaller than the positron average (0.2780 MeV) and beta average (0.1894 MeV) (Table 1).
Additionally, the decay yield of Auger electrons is low, such that the Auger contribution to energy absorbed in the (S=T) organ was small, around 1-2% of the total absorbed energy per 64Cu decay when the target organ was the source organ (Fig. 3). The energy deposited by the
gamma and X-ray decays was spread more throughout the body than just the source organ. Given the studies that have shown Auger electron effects (Adelstein et al., 2003; McMillan et al., 2015), it appears that Auger electrons contribute to biological outcomes via high linear energy transfer deposited over distances on the range of nanometers to
micrometers. However, this study shows that the outcomes are likely not due to the energy deposited by the Auger electrons, but rather from the fact that they are high-LET radiation that is very effective at inducing double-strand DNA breaks. Therefore, future research on ligands to deliver Auger electron emitting radiopharmaceuticals may want to focus on delivering the nuclide as close to the cell nucleus as possible.
This study made a number of assumptions to estimate organ and whole-body absorbed doses to the mice from the studies of Hueting et al. and Yoshii et al. First, the two studies used different strains of mice and different tumor types. Both tumor types are known to have hypoxic conditions, but the level of hypoxia was not reported and cannot be compared. The level of tumor hypoxia likely affected the biodistribution data of 64Cu-ATSM. Additionally,
different strains of mice have different radiation sensitivities; BALB/C mice, those used by Yoshii et al., are one of the most radiosensitive strains (LD50/30 = 6.4 Gy) (Plett et al., 2012; V. K. Singh et al., 2015) . Thus, simply based on the differences in mice themselves, the calculated organ doses for the two studies should not be directly compared.
Additionally, the locations of the tumors in the mice were not consistent. The MCNP mouse model used in this study had the tumor placed on the mouse flank, the Hueting study did not specify the location of the tumor, and the Yoshii study placed the tumor on the mouse shoulder. Since the MCNP absorbed dose fractions relied on the physical parameters of the mouse model, the dose calculations reported should not be retroactively applied to the mice from the studies. Rather, the reported organ doses are estimates of the doses if the model mouse was used as a standard.
Furthermore, the penicillamine administration in the Yoshii study affected the excretion rate of the mice, leading to higher activity excretion in the urine and feces. This study’s mouse model did not have dose data for excretions, and so additional dose to the bladder and colon may have occurred.
Many studies have investigated the therapeutic potential of 64Cu in the treatment of hypoxic cancer cells, both in vitro (Obata et al., 2005; Weeks et al., 2010) and in vivo (Lewis et al., 2001; Yoshii et al., 2011). However, a review of published studies shows that few report the organ absorbed doses, whole-body absorbed dose, or effective dose to the animal models used. If a dose-response relationship is reported, the injected dose is usually the value reported and used in the evaluation of biological effect. As demonstrated in the two published studies considered here, differences in animal strains and tumor types can impact the organ absorbed doses and whole-body absorbed doses, regardless of if the same injected dose is used (Fig. 4). Additionally, differences in anatomy can impact the energy deposition; for example, the location of a tumor contributes to the absorbed doses of adjacent organs and vice versa. Thus, biological endpoints such as tumor reduction or non-target organ toxicity may occur at very
different injected doses. An anatomically accurate MCNP model of a mouse/tumor strain paired with biodistribution data over time for that same mouse model may be a better method of obtaining accurate absorbed dose-responses relationships at an organ and organism level.
Future Direction
One of the most limiting steps in obtaining biodistribution data from small animal models is the restrictions associated with PET scans. They are typically expensive machines, with limitations on the number of animals able to be scanned at a time. Cerenkov
Luminescence Tomography (CLT) provides a possible method to image PET radiotracers with a common optical imaging system designed for bioluminescence and fluorescent studies. Cerenkov radiation are photons produced when a charged particle, such as a positron, passes through a dielectric medium faster than the speed of light traveling in that medium.
Pharmaceuticals such as the positron emitter 18F-fluorodeoxyglucose (FDG) and 64Cu emit radiation that are energetic enough to produce Cerenkov radiation in tissues. CLT can also be utilized to image pure beta emitters such as Y-90, which are used for therapeutic purposes and do not have sensitive imaging techniques. Ruggiero et al. found that Cerenkov luminescence imaging worked for a variety of radionuclides in mice, including 64Cu (Ruggiero et al., 2010). Li et al. (2010) found that the distribution of 18FDG in a live mouse as assessed by CLT agreed well with the distribution found in the same mouse by PET imaging. By fusing the CLT images with microCT images, the researchers were able to localize the radiopharmaceutical to specific organs (C. Li et al., 2010). This combination imaging could allow for quicker assessments of
biodistribution and mouse-specific anatomy, to be used with an MCNP model as in this study to determine organ and whole-body absorbed dose.
BIBLIOGRAPHY
Adelstein, S. J., Kassis, A. I., Bodei, L., & Mariani, G. (2003). Radiotoxicity of Iodine-125 and Other Auger-Electron-Emitting Radionuclides: Background to Therapy. Cancer Biotherapy
and Radiopharmaceuticals, 18(3). https://doi.org/10.1089/108497803322285062 Anderson, C. J., & Ferdani, R. (2009). Copper-64 Radiopharmaceuticals for PET Imaging of
Cancer: Advances in Preclinical and Clinical Research. Cancer Biotherapy and
Radiopharmaceuticals, 24(4). https://doi.org/10.1089/cbr.2009.0674
Bell, J. (2015). Internal Dosimetric Evaluation of Cu-64-ATSM in Canine Cancer Bearing
Patients.
Burgman, P., O’Donoghue, J. A., Lewis, J. S., Welch, M. J., Humm, J. L., & Ling, C. C. (2005). Cell line-dependent differences in uptake and retention of the hypoxia-selective nuclear imaging agent Cu-ATSM. Nuclear Medicine and Biology, 32(6).
https://doi.org/10.1016/j.nucmedbio.2005.05.003
Chakravarty, R., Shetty, P., Nair, K. V. V., Rajeswari, A., Jagadeesan, K. C., Sarma, H. D., Rangarajan, V., Krishnatry, R., & Chakraborty, S. (2020). Reactor produced [64Cu]CuCl2 as a PET radiopharmaceutical for cancer imaging: from radiochemistry laboratory to nuclear medicine clinic. Annals of Nuclear Medicine, 34(12).
https://doi.org/10.1007/s12149-020-01522-2
DOE Explains...Isotopes. (2021). DOE Office of Science.
Eckerman, K. F., Westfall, R. J., Ryman, J. C., & Cristy, M. (1994). Availability of Nuclear Decay Data in Electronic Form, Including Beta Spectra Not Previously Published. Health
Physics, 67(4). https://doi.org/10.1097/00004032-199410000-00004
Fujibayashi, Y., Taniuchi, H., Yonekura, Y., Ohtani, H., Konishi, J., & Yokoyama, A. (1997). Copper-62-ATSM: A new hypoxia imaging agent with high membrane permeability and low redox potential. Journal of Nuclear Medicine, 38(7).
Fujibayashi, Y., Yoshii, Y., Furukawa, T., Yoshimoto, M., Matsumoto, H., & Saga, T. (2020). Imaging and Therapy Against Hypoxic Tumors with 64Cu-ATSM. In A. and N. M. and J. M. Toyama Yoshiaki and Miyawaki (Ed.), Make Life Visible (pp. 285–292). Springer Singapore.
Gupta, A., Lee, M. S., Kim, J. H., Park, S., Park, H. S., Kim, S. E., Lee, D. S., & Lee, J. S. (2019). Preclinical voxel-based dosimetry through GATE Monte Carlo simulation using PET/CT imaging of mice. Physics in Medicine & Biology, 64(9).
https://doi.org/10.1088/1361-6560/ab134b
Hueting, R., Kersemans, V., Cornelissen, B., Tredwell, M., Hussien, K., Christlieb, M., Gee, A. D., Passchier, J., Smart, S. C., Dilworth, J. R., Gouverneur, V., & Muschel, R. J. (2014). A Comparison of the Behavior of 64Cu-Acetate and 64Cu-ATSM In Vitro and In Vivo.
Institute of Medicine. (1995). Adverse Reproductive Outcomes in Families of Atomic Veterans. National Academies Press. https://doi.org/10.17226/4992
Johnson, T. (2017). Introduction to Health Physics (5th ed.). McGraw-Hill.
Kim, C. H., Yeom, Y. S., Petoussi-Henss, N., Zankl, M., Bolch, W. E., Lee, C., Choi, C., Nguyen, T. T., Eckerman, K., Kim, H. S., Han, M. C., Qiu, R., Chung, B. S., Han, H., & Shin, B. (2020). ICRP Publication 145: Adult Mesh-Type Reference Computational Phantoms. Annals of the ICRP, 49(3). https://doi.org/10.1177/0146645319893605 Ku, A., Facca, V. J., Cai, Z., & Reilly, R. M. (2019). Auger electrons for cancer therapy – a
review. EJNMMI Radiopharmacy and Chemistry, 4(1). https://doi.org/10.1186/s41181-019-0075-2
Kume, M., Carey, P. C., Gaehle, G., Madrid, E., Voller, T., Margenau, W., Welch, M. J., & Lapi, S. E. (2012). A semi-automated system for the routine production of copper-64. Applied
Radiation and Isotopes, 70(8). https://doi.org/10.1016/j.apradiso.2012.03.009
Lewis, J. S., Laforest, R., Buettner, T. L., Song, S.-K., Fujibayashi, Y., Connett, J. M., & Welch, M. J. (2001). Copper-64-diacetyl-bis(N4-methylthiosemicarbazone): An agent for
radiotherapy. Proceedings of the National Academy of Sciences, 98(3). https://doi.org/10.1073/pnas.98.3.1206
Lewis, Jason S., McCarthy, D. W., McCarthy, T. J., Fujibayashi, Y., & Welch, M. J. (1999). Evaluation of 64Cu-ATSM in vitro and in vivo in a hypoxic tumor model. J Nucl Med,
40(1), 177–183.
Li, C., Mitchell, G. S., & Cherry, S. R. (2010). Cerenkov luminescence tomography for small-animal imaging. Optics Letters, 35(7). https://doi.org/10.1364/OL.35.001109
Li, F., Jørgensen, J., Madsen, J., & Kjaer, A. (2015). Pharmacokinetic Analysis of 64Cu-ATSM Dynamic PET in Human Xenograft Tumors in Mice. Diagnostics, 5(2).
https://doi.org/10.3390/diagnostics5020096
Liu, T., Karlsen, M., Karlberg, A. M., & Redalen, K. R. (2020). Hypoxia imaging and theranostic potential of [64Cu][Cu(ATSM)] and ionic Cu(II) salts: a review of current evidence and discussion of the retention mechanisms. In EJNMMI Research (Vol. 10, Issue 1). https://doi.org/10.1186/s13550-020-00621-5
McConn, R. J., Gesh, C. J., Pagh, R. T., Rucker, R. A., & Williams III, R. (2011). Compendium
of Material Composition Data for Radiation Transport Modeling. https://doi.org/10.2172/1023125
McMillan, D. D., Maeda, J., Bell, J. J., Genet, M. D., Phoonswadi, G., Mann, K. A., Kraft, S. L., Kitamura, H., Fujimori, A., Yoshii, Y., Furukawa, T., Fujibayashi, Y., & Kato, T. A.
(2015). Validation of 64-Cu-ATSM damaging DNA via high-LET Auger electron emission.
Journal of Radiation Research, 56(5). https://doi.org/10.1093/jrr/rrv042
Moulder, J. E., & Rockwell, S. (1987). Tumor hypoxia: its impact on cancer therapy. Cancer and
Metastasis Reviews, 5(4). https://doi.org/10.1007/BF00055376
NRC. (2020). Dose. NRC Glossary. https://www.nrc.gov/reading-rm/basic-ref/glossary/dose.html
Obata, A., Kasamatsu, S., Lewis, J. S., Furukawa, T., Takamatsu, S., Toyohara, J., Asai, T., Welch, M. J., Adams, S. G., Saji, H., Yonekura, Y., & Fujibayashi, Y. (2005). Basic characterization of 64Cu-ATSM as a radiotherapy agent. Nuclear Medicine and Biology,
32(1). https://doi.org/10.1016/j.nucmedbio.2004.08.012
Obata, A., Yoshimi, E., Waki, A., Lewis, J. S., Oyama, N., Welch, M. J., Saji, H., Yonekura, Y., & Fujibayashi, Y. (2001). Retention mechanism of hypoxia selective nuclear
imaging/radiotherapeutic agent Cu-diacetyl-bis(N 4-methylthiosemicarbazone) (Cu-ATSM) in tumor cells. Annals of Nuclear Medicine, 15(6). https://doi.org/10.1007/BF02988502 Peters, L. J., Withers, H. R., Thames, H. D., & Fletcher, G. H. (1983). The problem: Tumor
radioresistance in clinical radiotherapy. Masson Publishing USA, Inc. http://inis.iaea.org/search/search.aspx?orig_q=RN:18008815
Plett, P. A., Sampson, C. H., Chua, H. L., Joshi, M., Booth, C., Gough, A., Johnson, C. S., Katz, B. P., Farese, A. M., Parker, J., MacVittie, T. J., & Orschell, C. M. (2012). Establishing a Murine Model of the Hematopoietic Syndrome of the Acute Radiation Syndrome. Health
Physics, 103(4). https://doi.org/10.1097/HP.0b013e3182667309
Rubin, P., & Casarett, G. W. (1968). Clinical radiation pathology as applied to curative radiotherapy. Cancer, 22(4). https://doi.org/10.1002/1097-0142(196810)22:4<767::AID-CNCR2820220412>3.0.CO;2-7
Ruggiero, A., Holland, J. P., Lewis, J. S., & Grimm, J. (2010). Cerenkov Luminescence Imaging of Medical Isotopes. Journal of Nuclear Medicine, 51(7).
https://doi.org/10.2967/jnumed.110.076521
Schwarz, A. L., Schwarz, R. A., & Carter, L. L. (2011). MCNP Visual Editor Manuel. Singh, B. (2007). Nuclear Data Sheets 108, 197.
https://www.nndc.bnl.gov/nudat2/decaysearchdirect.jsp?nuc=64CU&unc=nds
Singh, V. K., Newman, V. L., Berg, A. N., & MacVittie, T. J. (2015). Animal models for acute radiation syndrome drug discovery. Expert Opinion on Drug Discovery, 10(5).
https://doi.org/10.1517/17460441.2015.1023290
The 2007 Recommendations of the International Commission on Radiological Protection. ICRP publication 103. (2007). https://doi.org/10.1016/j.icrp.2007.10.003
Weeks, A. J., Paul, R. L., Marsden, P. K., Blower, P. J., & Lloyd, D. R. (2010). Radiobiological effects of hypoxia-dependent uptake of 64Cu-ATSM: enhanced DNA damage and
cytotoxicity in hypoxic cells. European Journal of Nuclear Medicine and Molecular
Imaging, 37(2). https://doi.org/10.1007/s00259-009-1305-8 Wener, C. J. (2017). MCNP User’s Manual- Code Version 6.2.
Xie, Q., Zhu, H., Wang, F., Meng, X., Ren, Q., Xia, C., & Yang, Z. (2017). Establishing Reliable Cu-64 Production Process: From Target Plating to Molecular Specific Tumor Micro-PET Imaging. Molecules, 22(4). https://doi.org/10.3390/molecules22040641
Yoshii, Y., Furukawa, T., Kiyono, Y., Watanabe, R., Mori, T., Yoshii, H., Asai, T., Okazawa, H., Welch, M. J., & Fujibayashi, Y. (2011). Internal radiotherapy with copper-64-diacetyl-bis (N4-methylthiosemicarbazone) reduces CD133+ highly tumorigenic cells and metastatic
ability of mouse colon carcinoma. Nuclear Medicine and Biology, 38(2). https://doi.org/10.1016/j.nucmedbio.2010.08.009
Yoshii, Y., Matsumoto, H., Yoshimoto, M., Furukawa, T., Morokoshi, Y., Sogawa, C., Zhang, M.-R., Wakizaka, H., Yoshii, H., Fujibayashi, Y., & Saga, T. (2014). Controlled
Administration of Penicillamine Reduces Radiation Exposure in Critical Organs during 64Cu-ATSM Internal Radiotherapy: A Novel Strategy for Liver Protection. PLoS ONE,
9(1). https://doi.org/10.1371/journal.pone.0086996
Yoshii, Y., Matsumoto, H., Yoshimoto, M., Zhang, M.-R., Oe, Y., Kurihara, H., Narita, Y., Jin, Z.-H., Tsuji, A. B., Yoshinaga, K., Fujibayashi, Y., & Higashi, T. (2018). Multiple
Administrations of 64Cu-ATSM as a Novel Therapeutic Option for Glioblastoma: a Translational Study Using Mice with Xenografts. Translational Oncology, 11(1). https://doi.org/10.1016/j.tranon.2017.10.006
Zinn, K. R., Chaudhuri, T. R., Cheng, T. ‐P., Steven Morris, J., & Meyer, W. A. , Jr. (1994). Production of no‐carrier‐added 64Cu from zinc metal irradiated under boron shielding.
Cancer, 73(3), 774–778.