2002 municipal response to drought in the Colorado Front Range
5
0
0
Full text
(2) Kenney et al.. 2020. Water managers have been understandably concerned about accommodating the water demands of this growing population given the knowledge that drought would eventually return. Additional challenges to balancing municipal water budgets include environmental protection regulations, water quality requirements, interstate obligations, and, over the longer term, the possibility that increasing greenhouse gas emissions could result in higher winter temperatures and diminished late winter snowpack, U.S. Global Change Research Program (2002). Any decrease in late winter and early spring snowfall is of particular concern, as stored snowmelt provides the major water supply source for Front Range water users. 1.1. The Drought of 2002 Following a drier than normal winter of 2000-01, the winter of 200102 was also abnormally warm and dry. Snowpack for the South Platte Basin, where the study is focused, never rose higher than 54% of average throughout the entire winter. As of March 31, snowpack for the basin was 52% of average. Reservoir storage for the basin was 85% of average on March 31, dropping to 72% of average by May 31. This combination of events led to a water supply problem for Front Range water managers. By the late spring of 2002, the severity of the drought finally spurred action among municipal water managers in the Denver metropolitan area. The result was a variety of policy responses aimed primarily at reducing summer outdoor water consumption through restrictions on lawn watering. In many Colorado communities, lawn watering accounts for over half of summer water use. Restrictions on the time, type and frequency of lawn watering sought to prolong reservoir storage, both for 2002 and, fearing a continued drought, for summer of 2003.. 2. Methods 2.1. General Purpose and Research Hypothesis As part of its ongoing efforts to analyze the vulnerability of water resources in Colorado’s South Platte River Basin to the impacts of climate variability and regional growth, the Western Water Assessment2 examined the drought response of nine cities along the Front Range during the summer of 2002. Our central hypothesis was that outdoor watering restrictions imposed in response to drought result in less water being consumed than would normally be expected, given climatic conditions and population growth. The study compared, for each city or provider, water use patterns during summer of 2002 during watering restrictions to use in 2000 and 2001 when such restrictions were not in place. An additional, but secondary, research goal was to compare the experience of cities and providers to each other, identifying potential trends between different strategies and different 2. A joint research project of the National Oceanic and Atmospheric Administration (NOAA) and the Cooperative Institute for Research in Environmental Sciences (CIRES) at the University of Colorado.. Hydrology Days 2003. 220.
(3) 2002 Municipal Response to Drought in the Colorado Front Range. levels of success. Since results for each city or provider are tabulated in this study using a standardized methodology, cross–provider comparisons are facilitated—something not otherwise possible since the providers use a variety of approaches internally to estimate levels of success. The general goal of these investigations is to help municipal water managers assess and refine drought coping strategies. 2.2. Cities Selected for Study From a water management standpoint, the dozens of adjacent municipalities comprising the Denver Metro area are highly heterogeneous. Many operate independent water systems, based on distinct portfolios of water rights. This study focused primarily on the following municipalities or municipal water providers in the Denver Metro region: Aurora, Boulder, Denver Water, Fort Collins, Lafayette, Louisville, Superior, Thornton, and Westminster. These cities were chosen, in part, to capture the large variability in municipal water systems. One key point of variability is the location of source waters. Most Denver Metro cities have access to flows coming down the east side of the Rockies, either from the South Platte mainstem or from several tributaries. In the northern and central regions, these flows are augmented by water collected in the headwaters of the Colorado River system west of the Continental Divide. In the northern region, these flows are captured by the federal Colorado-Big Thompson (C-BT) project, which annually diverts over 200,000 acre-feet to the Front Range. Slightly smaller imports are associated with the cities in the central region, which primarily rely on tunnels owned and operated by the Denver Water Department. Other important sources of variability include the age and size of the cities, their growth rates, their differing approaches to water management and conservation, and most importantly in this investigation, their different approaches to drought management. While all nine cities or providers were impacted by the drought, these impacts were far from uniform, and their responses—and their levels of success—were equally varied. For example, due to severe water supply shortages, Lafayette imposed a mandatory one-day-per-week limit on outdoor watering in order to reduce water consumption by 75%, while nearby Superior was content with voluntary outdoor watering restrictions for most of the summer. Similarly Aurora implemented strict lawn watering restrictions long before neighboring Denver. These differences in approach reflect important differences in water system vulnerabilities as well as different comfort levels regarding risk, and different belief structures regarding the effectiveness of water restrictions— both voluntary and mandatory. 2.3. Assumptions This study relies on three assumptions concerning outdoor water use, which are based on our review of the relevant literature and historical trends. First, population growth leads to an increase in overall water consumption.. Hydrology Days 2003. 221.
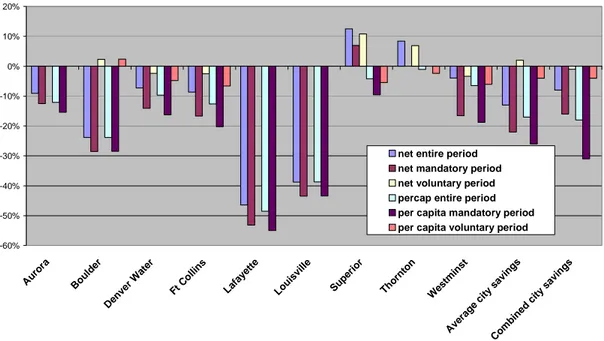
(4) Kenney et al.. Second, as average temperatures rise outdoor water use increases as well. Finally, as precipitation declines outdoor water consumption rises. Consequently, given the above average temperatures and below average precipitation for the South Platte River Basin in 2002, we would expect that water use would be higher that year than in years with lower average temperatures and higher average precipitation. However, water use data for 2002 suggest that water consumption was less than average for many municipalities and providers compared to previous years, lending support to our central hypothesis. 2.4. Data Each municipality or water provider provided daily water use data for the peak outdoor watering months of May, June, July and August for the years 2000, 2001, and 2002. These data are based on demand as opposed to production to help factor out water loss due to leaks or unauthorized use. Population figures for each municipality for the years 1999 through 2001 were provided by the Colorado State Demographer’s Office. However, population figures for the year 2002 will not be available until July 2003. Therefore, this study estimated 2002 population for each municipality based on the previous three-year trend of population growth or decline. Estimated service area population figures were provided by Denver Water for 2000, 2001, and 2002. Annual population figures were used in combination with daily water demand data to estimate per capita water use which permitted the study to control for the effects of population on water consumption. Maximum daily temperature and precipitation data for the study period were obtained from various agencies. These data, in conjunction with daily water consumption for the years 2000 and 2001, were used as predictors in a multiple regression equation to estimate what we would have expected use to be in 2002 absent watering restrictions, given the hot and dry conditions. 2.5. Comparisons The study measured water consumption savings using three methods: first, total water use for 2002 was compared to total demand averaged over 2000 and 2001. Second, per capita water use for 2002 was compared to per capita use for the average of the previous two years. Finally, expected per capita use for 2002 was compared to actual per capita use for that year. The comparisons were made for three time periods: the entire study period (May 1 – August 31), the period during which mandatory restrictions, if any, were in place, and the period during which voluntary restrictions, if any, were in place. The study also examined the level of restrictions of each provider in relation to the savings that were achieved. 2.6. Results Response to voluntary restrictions ranged from a 2% increase in per capita use to a 7% decrease. Response to mandatory restrictions ranged from. Hydrology Days 2003. 222.
(5) 2002 Municipal Response to Drought in the Colorado Front Range. a 10% to a 55% decrease in per capita use, indicating mandatory restrictions are more effective than voluntary. Among cities that employed mandatory restrictions, those cities with more severe limitations on outdoor watering (two day per week rather than every third day) generally saw greater reductions in use. The city that experienced the greatest reduction in use (Lafayette) restricted outdoor watering to one day per week. Expected use calculations are not yet available for all providers. Actual 2002 Water Consumption Compared to 2000/01 Average 20%. 10%. 0%. -10%. -20%. net entire period net mandatory period net voluntary period percap entire period per capita mandatory period per capita voluntary period. -30%. -40%. -50%. om. bi ne d. ci ty. sa vi ng s. sa vi ng s ci ty C. A. ve ra ge. W es tm in st. Th or nt on. io r Su pe r. Lo ui sv ill e. La fa ye tte. Ft Co lli ns. at er W. D. en ve r. ou ld er B. A. ur or a. -60%. Figure 1. 2002 water savings for nine providers.. References Jain, S., C.A. Woodhouse, M.P. Hoerling, 2002: Multidecadal streamflow regimes in the interior western United States: Implications for the vulnerability of water resources. Geophysical Research Letters, November 15, 2002. McKee, T.B., N.J. Doesken, J. Kleist, C. Shrier, W. P. Stanton, 2000: A History of Drought in Colorado: Lessons learned and what lies ahead. Colorado Water Resources Research Institute (Fort Collins, CO). U.S. Global Change Research Program, 2002: Climate Action Report 2002.. Hydrology Days 2003. 223.
(6)
Figure
Related documents
46 Konkreta exempel skulle kunna vara främjandeinsatser för affärsänglar/affärsängelnätverk, skapa arenor där aktörer från utbuds- och efterfrågesidan kan mötas eller
Exakt hur dessa verksamheter har uppstått studeras inte i detalj, men nyetableringar kan exempelvis vara ett resultat av avknoppningar från större företag inklusive
The increasing availability of data and attention to services has increased the understanding of the contribution of services to innovation and productivity in
Av tabellen framgår att det behövs utförlig information om de projekt som genomförs vid instituten. Då Tillväxtanalys ska föreslå en metod som kan visa hur institutens verksamhet
Närmare 90 procent av de statliga medlen (intäkter och utgifter) för näringslivets klimatomställning går till generella styrmedel, det vill säga styrmedel som påverkar
Den förbättrade tillgängligheten berör framför allt boende i områden med en mycket hög eller hög tillgänglighet till tätorter, men även antalet personer med längre än
Under resultatdiskussionen diskuterar vi elevernas tillit till de vuxna i skolan, elevernas trygghet i skolans gemensamma utrymmen, vikten av att inkludera elever i
The EU exports of waste abroad have negative environmental and public health consequences in the countries of destination, while resources for the circular economy.. domestically
