AGRICUlTURAL RESPONSE
TO HYDROlOGIC DROUGHT
by
V.J
.
BIDWEll
July 1972
53
AGRICULTURAL RESPONSE TO HYDROLOGIC DROUGHT
July 1972
by
V.J. Bidwell*
HYDROLOGY PAPERS COLORADO STATE UNIVERSITY FORT COLLINS; COLORADO 80521
•Research Associate, Colorado State University, Civil Engineering Department, Fort Collins, Colorado
Chapter
II
TABLE OF CONTENTS
ACKNOWLEDGMENTS ABSTRACT . . .
THE PURPOSE OF A DROUGHT -CROP MODEL 1.1 Defmition of Drought . . . . 1.2 The Causes of Drought . . . . 1.3 The Statistical Proper tiles of Agricultural Drought 1.4 The Drought-Crop Yield Relationship
WATER-SOIL-PLANT RELATIONSHIPS 2.1 The Factors Contributing to Yield . 2.2 The Role of Water in Plant Growth 2.3 Water Stress; The Soil-Water-Plant System 2.4 The Soil System . . . . 2.5 The Plant System . . . .
2.6 Factors Controlling Evaporation and Transpiration 2.7 The Yield-Water Stress Relationship
Ill PRESENT MODEL THEORIES
3.1 Models Directly Related to Drought Without Regard to Time of Occurrence 3.2 Models Concerned with Time of Occurrence of Water Deficit
IV MODEL DEVELOPMENT . 4.1 The Systems Approach 4.2 A Discussion of Errors
4.3 Development of the System Function
4.4 Simplification of the General System Function 4.5 Some Physical Considerations . . . .
4.6 Solution of the Production Function and Data Requirements 4.7 Modifications to Assist Convergence
4.8 Singularity . . . . 4.9 Stepwise Regression . . . . 4.10 Application of Non-linear Least Squares 4.11 Three Additional Notes on the Procedure V APPLICATION OF THE MODEL
5.1 Description of the Data
5.2 Demonstration of Analytical Capability Using Synthetic Data 5.3 Assumptions in the Formulation of Models for the Com Yield Data 5.4 Formulation and Testing of Some Models
CONCLUSIONS . . . . Page iv iv 1 1 1 1 1 2 -2 2 2 3 3 4 4 5 5 5 8 8 8 8 9 10 11 13 13 13 14 15
16
16
16
1819
24ACKNOWLEDGMENTS
The research leading to this paper was conducted as part of the large continental droughts project with principal investigator Dr. V. M. Yevjevich and financially supported by the U.S. National Science Foundation under grant GK-11564.
ABSTRACT
The paper deals with the effects and evaluation of the effects of hydrologic drought on the yield of dryland farming. Some of the physiological principles involved in crop growth are reviewed in the context of a system which relates reduction in crop production to deficits in the water input. A possible set of non-linear functions is developed to describe this system by using the physical properties of crop production as constraints on the mathematics. The method of non-linear least squares regression is described as a suitable technique for solving the system function. Application of the analytical methods to a set of corn yield data is demonstrated with several types of system functions, one of which is suggested as a suitable practical model. the predictability of the models is not high because of restriction imposed by the availability of data. Some improvements are suggested for further development when more suitable data are available.
Chapter 1
THE PURPOSE OF A DROUGHT-CROP MODEL
Of all the detrimental effects ascribed to droughts the total or partial loss of agricultural pro-duction is probably the most serious. Within this con-text is included both crops for direct harvesting and those used as pasture for animal grazing.
1.1 Definition of Drought
The question of what constitutes a drought has been asked many times and the answer can be given only in terms of the phenomenon being described. In this paper the case under consideration is dryland farming, i.e., the crop depends entirely on naturally occurring rainfall for its moisture requirements. Drought then occurs when the rainfall fails to supply sufficient moisture for optimum yields. The irrigated farm is not considered here because, ideally, irrigation should be managed in such a way that optimum yields are obtained. The case of insufficient irrigation water supply is therefore also outside the scope of this discussion.
1.2 The Causes of Drought
In section 1.1 it was stated that agricultural drought occurs whenever the yield iis not optimal because of insufficient moisture supply. The term optimum yield in this context is defmed only with respect to the moisture requirements of the crop. Even with adequate water the yield may not be the 'best' in an absolute sense because of soil, fertilizer, temperature conditions, biological factors etc. I nsuffi-cient moisture for optimal growth can be caused by deficiency in the amount and timing of rainfall and by climatic conditions which cause increased require-ments. The latter conditions are generally grouped as evapotranspiration factors.
1.3 The Statistical Properties of Agricultural Drought The factors which cause agricultural drought such as deficits in rainfall and the climatic variables related to evapotranspiration are themselves random with respect to time and space. Hence the effects on crop yields are also randomly distributed in both time and space because they are functions of random vari· abies. The usual ways of combating random natural disasters such as floods and droughts are by economic methods such as insurance or engineering structures
and systems designed for a certain level of damage which has a certain probability of occurrence. In either case the designer requires estimates of the pro-bability distribution of the event in time and space. This information can be obtained in two ways:
(1) By a study of the probability distribution of the event.
(2) By relating the event to other variables whose probability distributions can be found.
The latter method is favored in the study of agricultural drought because of the scarcity of data on crop yield which is not confounded with factors other than hydrologic drought. The availability of rainfall data, for example, enables good estimates of its statistical properties to be made. If a suitable func-tional relationship can be derived between rainfall and drought effects then the statistical properties of droughts can be obtained. Titis approach can also be applied to areas where a particular crop is not yet grown in order to determine the economic feasibility of planting the crop.
1.4 The Drought-Crop Yield Relationship
It is the purpose of this study to develop a methodology for deriving the relationship between crop yield and the causative conditions. The case of total crop loss due to drought is not dealt with direc t-ly because the devastating conditions required are known and hence their probability of occurrence can be estimated. The case of partial crop damage how-ever is more complex because the same value of less than optimal yield can be caused by a large number of combinations of causative conditions hence the need for a functional relationship. The study is addressed mainly to this problem.
The situation may arise when the joint pro-bability distribution of all causative factors cannot be determined due to lack of data. The functional rela-tionship may then be derived for those factors for which statistical information exists. The remaining factors are incorporated as uncertainty in the model. This is the case in the present study in which only rainfall was inducted as a causative factor due to lack of suitable data.
Chapter 2
WATER-SOIL-PLANT RELA II ON SHIPS
2.1 The Factors Contributing to Yield
The purpose of this chapter is to review some of the basic concepts of the physical relationship between applied water and the yield of a crop. It is generally recognized [Blake, 1967]
*
that the total biological yield of a crop can be expressed as:Total yield = (duration of photosynthesis) x (intensity of photosynthesis)- (respiration) The harvestable or economic yield is then some pro -portion of the total biological yield. This formulation is affected by genetic and biological factors but is generally true for a particular crop situation. The rate of photosynthesis is affected by the following factors [Blake, 1967] :
(1) Light, which depends on day length, cloud cover and the area and orientation of leaf surfaces.
(2) Temperature - The photosynthetic rate doubles for each increase of JOOC over the range-60C to 30°C.
(3) Availability of atmospheric carbon dioxide which may be limiting only in thick foliage.
(4) Water status; water stress results in a sharp decline in photosynthesis.
The loss of plant matter by respiration of carbon dioxide during the night is affected by temperature in the same way as photosynthesis and can account for 10 percent to 50 percent of the carbon dioxide fixa-tion during the day.
The above comments of course do not take in-to account the availability of nutrients and other factors. The main point to be considered is that the water status of the plant which is the main interest in a drought study is only one factor in crop production although a very important one. It is quite possible for the effects of low or very high temperatures, for example, to mask the effect of water deficit. The effects of water stress will now be considered in more detail.
*references are given by authors' names followed by the year of a reference at the end of this paper.
2.2 The Role of Water in Plant Growth
Water has several uses in the growth of plants and the following compilation from Currier ll967] outlines the principal roles:
(1) Water is an important structural constituent of the plant.
(2) Water hydrates enzymes and provides the aqueous environment necessary for metabolic re-actions.
(3) Water is the medium for transport of sub -stances from regions of supply to regions of use; e.g., transport of nutrients from the soil into the plant.
(4) Because of its high heat of vaporization, water is an effective coolant for the plant by trans-piration and its high specific heat also helps in pro-tection against low temperature injury.
Some 'Schools of thought [Pearson, 1967] maintain that transpiration serves no useful purpose directly but is an indirect effect of photosynthesis. The stomata in the leaf surface must be open to allow atmospheric carbon dioxide to reach the underlying mesophyll tissue where the photosynthetic reactions occur. Since the moist surface of the mesophyll is exposed, transpiration to the atmosphere results. One of the effects of water stress in the plant is that the stomata are closed partially or fulJy, thus reducing transpiration Joss. Whatever the cause and effect relationships are, the end result is that with the stomata closed the growth processes cannot occur. Therefore the effect of mild water stress is to inhibit the growth oriented phases of the plant and more severe stress causes permanent structural damage or kills the plant.
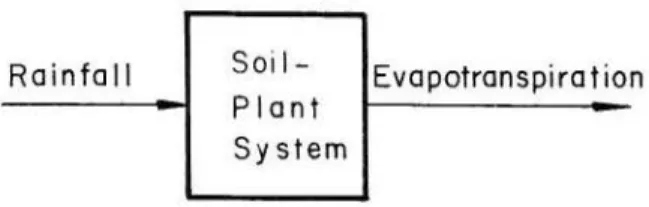
2.3 Water Stress; The Soil-Water-Plant System In order to determine the causes of undesirable water deficit in the plant, the water-soil-plant rela -tionship can be considered as a system with rainfall input to the soil and transpiration output to the atmosphere.
Rain fa II Soi 1-P I ant System
Evapotranspiration
This system can be further decomposed into two s ub-systems to account for soil and plant behavior separately.
Rainfall Transpiration
Evaporation Drainage
2.4 The Soil System
The soil can be considered as a storage which receives water by infiltrating rainfall and loses it mainly by drainage until a state called field capacity is reached in which the remaining water in the soil is held mostly by surface tension forces. The small amount held by electrochemical forces is not of concern here. Further loss of water from the soil occurs by evaporation from near the soil surface or absorption into the root system of the plant. The evaporation of water from the soil surface is con-trolled by atmospheric conditions and soil moisture conditions near the surface. For hlimid climatic con-ditions and deep soil this loss is usually of a smaller order of magnitude than the water transpired by plants.
The soil water output to the plant is deter-mined by the difference in potential between plant water and soil water and the conductivity of the root system. The soil moisture potential is a measure of the energy status of the soil water with respect to a free surface and can be considered as a function of the
soil
moisture content shown in Figure 1. This relationship is often complicated by hysteresis, i.e., different curves for increasing and decreasing moisture content.Water transport can occur in soils in two modes: (I) viscous flow, and (2) diffusion in the liquid and vapor phases. The latter becomes
0 c Q) +-0
a..
Q) ... ::l-
(/') 0 ~ 0 (/)Soi I Moisture Content
Fig. I Relation between soil moisture potential and soil moisture content.
important for quite dry soils although it is favored by large temperature gradients in wetter soils. It is important to realize that the parameters of the soil system behavior depend on the physical structure of the soil and its chemical properties. Thus a functional relationship derived for a particular soil may not apply to another soil or even for the same soil under a different tillage practice.
2.5 The Plant System
The plant receives water from the soil and transpires the bulk of it into the atmosphere. Any excess of transpiration rate over absorption rate from the soil will eventually result in internal water stress and the plant will suffer by reduction of growth rate, adverse structural effects (wilting) or may die. The transpiration rate is dependent on climatic conditions (discussed in a subsequent section) and the diffusion resistance of the leaf surface. This resistance is con-trolled to some extent by the water status of the plant and becomes limiting only at very high potential transpiration rates or existing water stress in the plant.
The input of soil water to the plant depends on the difference in potential between soil water and internal plant water and the conductivity ofthe root system. Plant water potential depends on the wateJ status, hence on the transpiration rate, and soil water
potential depends upon available soil moisture as mentioned previously. Another source of energy for absorption is the osmotic potential which expresses the solute concentration gradient between the soil water and plant water. If the soil water is too saline the adverse osmotic potential can prevent the ab-sorption of the soil water by the plant.
TI1e parameters of the plant system are highly non-stationary with respect to time because as the plant's foliage and root system develop with growth the absorption and transpira lion characteristics change. The growth parameters of the same period ir1
the growing season for an annual crop can change because of damage due to previous water stress or the root system may develop during a period of low soil moisture and make the plant subsequently more drought resistant.
2.6 Factors Controlling Evaporation and Tr ans-piration
Evapotranspiration, as the phenomenon is collectively called, depends on plant or soil factors and climatic conditions. The climatic conditions are usually expressed in the form of the potential evapo-transpiration. The actual evapotranspiration is then a proportion of the potential evapotranspiration; the proportion depends on the availability of soil water and the transpiration characteristics of the plant. Some of the many relationships proposed for the ratio of actual to potential evapotranspiration as a function of available soil moisture are shown in Figure 2 [David and Hiler, 1970] . For a crop the total evapotranspiration is also affected by the amount of bare soil and crop cover. For well
devel-Fig. 2
So i I Moisture PWP OD
Soil moisture according to: A) Thornwaite; B) Holmes; C) Pierce; D) Veihmeyer-van Savel.
oped cover and root system the plant population is not a significant factor because generally soil water is limiting.
TI1e potential evapotranspiration depends on the irlcident solar energy, relative humidity of the air, wind velocity and turbulence and advection from adjacent areas. There are many empirical formulae available for estimating potential evapotranspiration from solar and climatic data.
The effect of large scale transport of atmo-spheric moisture into or out of a region is an important factor in the cause of droughts. Without tllis transport a region could be considered as a closed system in which the soil water transpired into the atmosphere eventually returns to the soil as rainfall excluding the effects of surface streams - and the system would remain stable. However, the advection of moisture laden air from oceanic regions and the accompanying atmospheric circulation is a major factor and fluctuations in this moisture transport due perhaps to shifts in ocean currents may cause a major drought.
2.7 The Yield-Water Stress Relationship
From the previous discussion on plant physi-ology it is evident that closure of the stomata by water stress reduces photosynthetic activity thus in -hibiting growth. This phenomenon has been empiri-cally verified by Denmead and Shaw (1962] who·
showed that plants ceased to gain dry matter weight when the soil moisture was less than the turgor loss point (a measure of the wilting point). Moore [ 1961] used a similar concept by proposing an index of potential growth which was a function of percentage moisture depletion. In general then, my internal water stress in the plant causes reduction of growth rate and the total reduction is the product of dura-tion of stress by magnitude of growth loss with respect to the potential growth rate. The concept of potential growth rate is important as there are stages of growth for some crops when the potential green growth is essentially zero and water stress is not harmful. Sometimes water stress can be beneficial in the case of crops grown for seed when the reduction in vegetative growth does not affect the production of the desired harvest. Therefore, a production function derived for one aspect of crop production may not apply to a different product from the same plant. A comprehensive treatment of these factors is given by Richards and Wadleigh [ 1952].
Chapter 3
PRESENT MODEL THEORIES
There is a large amount of literature dealing with production functions for crops. These are mostly oriented towards irrigated farming and its optimization. In this chapter only those models dealing with the timing of applied water during the growing season are reviewed together with theories directly concerned with agricultural drought. The sur-vey is not intended to be exhaustive but rather to show the range of models and theories in this field. 3.1 Models Directly Related to Droughts Without
Regard to Time of Occurrence
Barger and Thorn [1949] considered rainfall in n-week totals during a 16-week growing season for com and correlated yield with the n-week values (n
=
1, 2, ... ,16) for many years in order to determine a drought base for each n-week total for each station. The yields were then correlated with deficits from the drought base.Van Bavel [ 195 3] used estimated evapo-l transpiration (by the Thornwaite method) as the out-put from a predetermined soil moisture storage. Drought was defined as occurring whenever the sto-rage was empty. The magnitude of the storage was determined from an assumed moisture stress level.
Stewart and Hagan [ 1969] dealt with water usage over the whole growing season without regard for the timing of water application. They considered water use to be equivalent to the estimated evapo-transpiration.
3.2 Models Concerned with Time of Occurrence of Water Deficit
The following theories are concerned with the timing of water application to crops but do not include those models in which feedback is required from soil moisture readings taken during the growing season. Although not all specifically drought oriented the models are of interest because it is now realized that the timing of water deficit is of prime import-ance in agricultural drought.
Parks and Knetsch [1959] used Van Bavel's [1953] drought day criterion to estimate the
drought level during certain periods in the growing season for corn. The corn yield was then correlated with these drought levels with an equation of the form
where A, B, C, and D denote the number of drought days occurring in successive periods of 33, 32, 14, and 31 days, respectively during the growing season. The 14 day C term represents the tasseling period. The Van Bavers drought day is calculated by sub
-tracting the estimated evapotranspiration (by Thorn-waite method) from a known soil moisture until it is depleted and the drought begins. Rainfall refills the storage, and the total storage capacity is determined from an assumed moisture stress level. The authors also correlate yield with a quadratic function of drought index values (determined from the above equation) and nitrogen fertilizer treatment.
Moore [ 1961] considers the growing season as a number of irrigation periods. During each period the relative growth (compared to potential growth) Gr. for the ith period is given by
l (j, I
f
g(x)dxo
::::I Gri =e.
X 100 8i ' I (3.2)where (). is the soil moisture stress of the end of I
the ith irrigation period and g(x) is the functional relationship of relative growth to percent moisture depletion.
The total relative growth for the entire season is
n ti
G = :E I
-r i= I
o
i T(3.3)
where T is the length of season and ti the length of the ith irrigation cycle.
The function g(x) is assumed to be the same at any stage in the crop's growth in the absence of addi-tional information. A critical assumption is that there
is no interdependence of relative growth, i.e., stress at any one stage does not affect the re~ponse at a later
time.
Doll [ 1967] was concerned with functions
which varied with the year t and weather vari·
abies x1(s) at time s within year t, so that both
trend and weather effects on a crop were explained.
For com yield data in Missouri for the years
1930..1963 he obtained a function of the form
where Y 1 is yield in year t ( 193G-+-t
=
1) and z1=
a 1 x1 (1)
+
a2 x1 (2}+
..
a8 x1 (8) and x1 (i}=
rainfall variable for week i in season beginning June 7.Flinn and Musgrave [ 1967] also use an additive model similar to that of Moore (above), i.e., the growth at each stage is independent of moisture stress
at other stages and the total growth for the whole
season is the sum of the relative growth at each stage.
The authors recognize that relative growth is different at various stages of growth and base their relative growth calculations on the assumption that growth
occurs on those days when actual evapotranspiration
equals potential evapotranspiration, i.e., no stress. A
dynamic programming solution is also presented for
the optimal allocation of irrigation water as the as-sumed production function is suitable for this
tech-nique.
Hall and Butcher [ 1968] also proposed
a.
dynamic programming algorithm for their modelin which y max is the maximum possible yield when
there is no moisture stress during any of the n time
periods during the growing season. wi is the soil
moisture during period i, and if all other periods
have soil moisture at field capacity w r then the resulting yield y is given by
(3.6)
where the growth coefficient ai(w) for period i
de-pends on the soil moisture for period i. Thus in
general, the proportion of maximum yield obtained is
given by the product of the coefficients ai(wJ The
production function was put into a form suitable for
dynamic programming by taking the logarithm of the
function. In this model also there is no mter-dependence of moisture stress effects at different times in the growing season but the effects are mwti·
plicative rather than additive. The authors did not
present any empirical proof of the model.
Jensen [ 1968] suggests two model types, one for what he calls determinate crops, i.e., crops with a
defm.ite flowering or heading stage and another for
indeterminate crops such as grasses. The model for a
determinate crop when soil moisture is limiting is
n
n
i=l A. wet ' (w-) oc i (3.7} where y /y0 is the relative yield of the crop (y 0
re-presents the yield when soil moisture is not a limiting
factor); (w et /w )oc . 1 is the ratio of actual water use
to potentlal water use during period i of the growing
season and
:X.
is a parameter to be determined. In' I
the case of indeterminate crops which tend to recover
from periods of water stress the suggested relation -ship is
n
~ \ (wet)l
i=l
(3.8)
which implies that the effects of stress during one period are additive rather than multiplicative in con-trast to the determinate crop model which applies to
crops which suffer permanent damage due to mois· ture stress.
Brown and Vanderlip [1969] correlated
pro-duction of winter wheat at several locations in Kansas
with monthly moisture departure values and also with
monthly values of the Palmer Drought Index [Palmer,
1964] . This index is based on a soil moisture accounting scheme which introduces some antece-dent weather effects. The production functions used are of the form
where y is yield and the x1 are monthly climatic
values. Note that although the quadratic terms are
included there are no interaction cross-products so a.gain the effects are considered independent and
additive.
Yaron ( 1971] in his review paper of crop pro-, duction functions suggests a generalized optimal path type procedure for optimizing water usage and other relevant plant factors. The approach is largely
con-ceptual and no empirical evidence is offered in its support.
In conclusion it can be said that the principle differences between models and thus the factors to be
considered are:
(1) 'The length and number of periods during the growing season.
(2) The choice of state variable for each period. (3) The functional relationship between yield and the state variables at each period.
In the next chapter a general model structure will be considered and some particular examples
Chapter 4 MODEL DEVELOPMENT
4.1 The Systems Approach
The response of crop production to agricultural
drought can be considered as a system with climatic
variables as input and harvestable yields as output.
The input variable set could include rainfall and the
climatic variables which control evapotranspiration.
One way of analyzing a system is to construct a
model on the basis of knowledge of the physical
be-havior of the system and then evaluate the model
parameters by using input-output data and a suitable
optimization technique. The usual objective function is the minimization of the error mean square of the
predicted output. A second approach is to treat the
system as a "black box" and derive a mathematical
response function from an analysis of only the input
and output data. The latter method has been selected
in the present research although a certain amount of
physical knowledge has been used to assist the
analy-tical procedures.
4.2 A Discussion of Errors
The use of a system model in the simulation of
such a complex physical phenomenon as the growth
of a crop is at best a workable approximation. It is
useful, therefore, to consider the closeness of this
approximation or conversely the types and causes of
errors. The sources of these errors can be considered
in two main groups:
(1) Errors in the data; these may be further
divided into:
(a) Measurement errors; this type of error
is relatively unimportant in the present state of the
art because the accuracy of instrumentation tends to
exceed the resolution of the analytical procedures.
(b) Missing data; this could be, for
example, monthly rainfall data instead of the desired
weekly amounts or complete lack of information on
some of the variables related to evapotranspiration.
(2) Model errors; again, these can be grouped
as:
(a) Incorrect selection of input variables. The effect is the same as error J (b) above in which
the variables are chosen correctly but no data is avail·
able-.
(b) Inadequate simulation of the physical
behavior of the process because the mathematical
formulation is not sufficiently flexible. Sometimes
the choice of mathematical functions is restricted by
the lack of sufficient data to enable significant esti·
mates to be made of a large number of parameters.
(c) Non-stationary behavior of the
pro-cess e.g., an annual crop may develop different root
structure in djfferent years and thus have a varying
reaction to the same degree of water stress. For some
crops the root development depends on the moisture stress in the early stages of growth. Sometimes
ap-parent non-stationarity is really due to errors of type
I (b) as for example the behavior of crops growing in
different soils. If the soil properties cannot be quanti
-fied and used as an additional input variable then the
error may well be dismissed as being due to
non-stationarity. Finally it should be noted that the
vary-ing behavior of a particular crop throughout the
growing season is not considered to be non-stationary
because the climatic inputs a each period of time are
considered to be separate input variables thus
re-moving the time dependence.
4.3 Development of the System Function
Consider the growing season of a crop divided
into n time periods, not necessarily of equal length
and let x. be the climatic input variable in the ith
I
period. The variable xi could be rainfall, irrigation
water, drought index or a function of several other
variables related to precipitation and
evapotranspira-tion for example. The yield y of the crop at harvest
time can be ex pressed generally as
(4.1)
The function y may have different forms for yield
expressed as green matter, dry weight, fruit, etc. Pro
exist over the range considered it may be expressed as a multidimensional polynomial n n n y= 1: i=J + 1: 1: i= 1 j= 1 n n n 1: 1: 1: a .. kx.x.xk + . . . (4.2) i= 1 j= I k= I IJ l J •
In order to reduce the number of terms to be con-sidered in subsequent analyses an economy may be affected by factorizing the polynomial
n (i) (i) 2 (i)
3
y= i~l (b, xi+b2 xi +b3 xi+ ... )
n n
+ 1: 1: (c~i) xi+ c;i) x; + ... ) i= l j=l n n n + 1: 1: 1: (d( 1i) x1 . + d;i) x,2 + ... ) i=l j= 1 k=j (d(k) 1 xk + d(k) 2
Xk
2 + · · · )+
·
· ·
'
(4.3)and then expressing each polynomial factor as a single function
(4.4)
The main purposes for expressing the function in this form is that all interactions between periods are considered and yet the f. .... (x.) can be expressed
IJ 1
as single parameter functions thus economizing on parameter estimation or optimization. The choice of function is dependent on the climatic vari-able xi used and the physical behavior of the system. In the empirical work carried out for this report the xi were monthly rainfall values and the func-tions f. I were of the form,
xC:
I wher·e ~~! so that a "diminishing returns" type of behavior is obtained. However, other functional forms may better suit other variables and models.4.4 Simplification of the General System Function Even with the above reduction to the cross-products of single parameter functions there will generally be too many terms for analysis. The main reasons being lack of sufficient data to give significant estimates and the physical limitations of computer facilities. A further reduction in the number of terms to be considered can often be done by considering the boundary conditions and critical properties of the system. For the drought-crop pro-duction model the questions to be considered are:
(1) What are the lengths of the time periods for each X; and does a zero xi value (e.g., no rain for two weeks) during that period destroy the crop? If so, this period is said to be critical with respect to the input xi.
(2) Which of the n periods are critical and which are non-critical (i.e., zero xi does not destroy the crop)?
(3) Is there interaction between periods, i.e., does the crop response to stress at period i depend on what occurred during period j?
(4) Does the model satisfy the condition that no input during the growing season equals zero out-put?
It should be emphasized at this point that a model developed in terms of inputs other than rain-fall or applied water may have a different set of criti-cal and boundary conditions.
As an example of the application of the above boundary conditions, consider the model proposed by Hall and Butcher [ 1968]
where wi is applied water during period and ai(wi) is the growth coefficient.
The condition of no inputs giving zero output is easily satisfied if any one of the a. I (w.) has I a zero intercept, i.e., any ai (0) = 0.
Any of the i periods which are critical must satisfy ai(O)c = 0. However, any period not critical must satisfy a.(O) = k. so that it represents the
' nc 1
those non-critical periods. Now consider the case when period i is non- critical as is period i+ 1 but the period of time equivalent to i plus (i+ 1) is cri -tical. Therefore a;(O)
=
ki ai + 1 (0)=
ki+ 1 and yet zero inputs during periods i and i+ I do not destroy the crop. Obviously there is some interaction between periods and the model does not take this into ac-count. The only situation in which this model will satisfy the boundary conditions is when the periods are chosen to be of such lengths that all periods are critical. This, of course, requires some prior know-ledge of the plant physiology.A superficial knowledge of which periods are likely to be critical during the crop's growing season
can greatly assist in reducing the orders of function cross-products to be considered in the analysis. For example, consider a growing season consisting of four monthly periods say, May, June, July and August. These months receive rainfall inputs x
1, x2, x3
and x4, respectively, and it is known that only July is critical, i.e., no rain in July will destroy the crop. Now
where <P denotes some order of products of the functions within the brackets.
Since period 3 is critical, f3(0) = 0. Consider . the product
which form does not seem feasible because of the reasons given above. If no rain during May and June would destroy the crop, then the model breaks down as f1 (0)
=
k1 (non-critical) and f2(0) = k2 butf I (0) f2 (0) f0.
The next order of products to be considered is the third order set
(4.8) Note that this is not simply products of the original
four f.(x.) taken in sets of three but ea.::h product I I
contains different functions of the xi. The purpose of this form is to give the maximum genc;!rality to the
production function and especially to represent :my interaction between periods. If there was no inter-action effects then
but in general the possibility of interaction must be considered.
In order to satisfy the critical nature of
x
3 only those products containing a function of x3should be considered, i.e.,
(4.1 0) If no period was critical then all four products would have to be included. In this form all fi(O) = 0 will still satisfy the non-critical behavior as any non-critical period appears in only two of the three terms and hence zero inputs in any one does not give
zero output. However, zero inputs in any two periods will give zero y value. These need not be adjacent periods in the above model as x 1 = X4
=
0 willgive y = 0 for all f1(0)
=
0. If x 1 = x4=
0 gives y:f:
0 then the model would have to be modi-t1ed by considering other product forms ·such as second order terms combined with the third order ones above. lt is often easier to work from high order produ.::ts to low order in developing the model because most low order terms do not satisfy the boundary conditions. There is the greatest number ofterms to be considered in the middle range of orders
of products and, in general, these terms should he
added to the model only if there is some prior reason
for doing so as the mode.! can easily become un-wieldy.
4.5 Some Physical Considerations
It is useful at this point to consider the physical phenomena underlying crop production and lheir relationship to the aforementioned mathematical functions. In Chapter 2 it was deduced that the water
soil plant system is basically a storage with rainfall input and evapotranspiration output. Whenever the
storage runs low or becomes ~mpty the plant growth
is reduced or it may die. Some of the models
re-viewed in Chapter 3 usc accounting procedures, esse·
ntially, to determine when stress occurs. This be -havior can be included in the systems :walysis by means of a fun~.:tion defir1ed as
)x-a dim (x,a) =
L
0
x>a(
x
~a
J
(4.1 1)The use of this function is apparent in the response from the ith period in the growing season which be-comes:
Note the implicit accounting procedure which tests whether the storage is likely to be empty at period i. The parameter a. can be estimated in the
I
analysis. This storage concept may explain some of the interaction between growth periods as the "carry over" of soil moisture to give a higher input to the succeeding period. There is stili some "true" growth
interaction apart from this factor due to water stress damage affecting later growth. Both types of inter-action are included in the cross product terms of the general system functions.
There has been some argument in the literature as to whether the production function should be
additive or multiplicative. This seems to be largely a question of definition of the yield response for each time period. For the additive model, f,(x) refers to the actual growth increment whereas in the multipli-cative model f;(x) is the percentage of the maxi-mum final yield if only x. I is limiting as defined by
Hall and Butcher [ 1968 J . Neither model includes
any interdependence of response between different periods of the growth cycle.
4.6 Solution of the Production Function and Data Requirements
The principal advantage of the method of ana-lysis, as described in the following text, lies in the efficient use of data. Some models such as that of Hall and Butcher { 1968] require controlled inputs to crops in order to determine the production function. The method proposed by Hall and Butcher is to keep inputs to all periods at maximum except for the period under observation if no interaction is pre-s·umed to occur. If interactions occur the number of controlled experiments required becomes enormous. For the least squares estimation to be discussed the inputs can be randomly distributed as would
occur from rainfall on a crop and the number of in-put sets (i.e., number of crop yields) considered need be only great enough to estimate the production function parameters. This point is discussed in detail
later.
TI1e remainder of this chapter is concerned with the development of the mathematical theory under-lying the algorithm for solving the system function.
Considerable use is made of matrix notation in the presentation of the theory and the non-rna thematically minded reader may proceed to
Chapter 5 without loss of continuity.
Consider the situation in which there are m observations on each of the input variables x1 , ... ,xn
and the output yield y. Suppose that from the physical considerations outlined previously y can be expressed as a function of the n input variables
With the parameters 8 I, f) 2 , ... ,8 p to be estimated,
so that
X
2 +
(4.14)
TI1e method of obtaining the solution is the non-linear least squares regression procedure given by Jennrich and Sampson
(1968].
This is the Gauss-Newton method with modifications due to Hartley[ 1961) and J en nrich and Sampson in order to ensure convergence and prevent instability. The technique consists essentially of approximating the above pro-duction fuuction with a Taylor series expansion in terms of the
e
i and solving the resulting equations by the least squares methods of multiple linear regression. Let,.c.
denote the vector (x1 .... ,x0) and
~ the Vector (0 I , (J 2 , ... ,fJ p).
For some initial values
1°
of the parameters the function f(i<.f0) can be approximated by the first order terms of the Taylor seriesf(~;Q"
+
b.~J
:::::
f(~r)
+
D.o
I~
(fc~r)
+
and
_Q_ f (x·t1°)
a
f (x·8°)381 2 ~~ • · · a8p 2 ~~::
X
or representing the above matrices in the condensed
form
(4.18)
This formulation is analogous to the multiple linear
regression of a variable y on a set of variables x1 , ••• ,
xn, which can be represented as
IXIIBI
=
IYI+
lei , (4.19)where lXI is a m x n matrix of the m observations
on the x., IYI is a I (m x 1) matrix of observations on y , lei is the error term matrix, and IBI is the matrix of regression coefficients in the equation
(4.20)
The least squares estimation of the bi is obtained by
the procedure.
(4.21) Thus
(4.22) t:.8 p
where e is the error term. Let yl' f
1
{c;!~, wheret
=
l ,2, ... ,m, denote the observations on y and f{c;!0). Then the observations on the above equation can be written in matrix form= + . (4.17)
where IXIT denotes the transpose of lXI, and
iB1 is the matrix of estimates of the regression co·
efficien ts.
Hence the t:.8. tn the nonlinear regression are
I given by
(4.23)
New values of 81
=
£It+
M1 are calculated and the procedure is repeated until it converges to final values of 8 I .. The criterion for convergence is theresidual sums of squares
The procedure is continued until the relative increase in error mean square is less than a chosen value, i.e.,
m where s2
=
L [y1 -f1{x,OW
n t=l {4.24)
4.7 Modifications to Assist Convergence
Sometimes the error mean square does not decrease when
p_
is incremented by ~ because the linear approximation used for f~) fails at that point. The usual modification is to incrementi_
byetlP._
where O<e<I and re-evaluate the error mean square. A practical value to use ise =
1/2 and if the error mean square still increases use e = 1/4 etc., halving the step each time until convergence occurs. 4.8 SingularityAs,£ changes its values during the iteration procedure it can happen that the partial deriva -tives of~~/38
1
become linearly dependent or near-ly so and thus the matrix lf'(x;O)I becomes singular or almost singular. The regression procedure cannot then continue because the inverse cannot be evalua· ted. This problem of singularity can be handled by carrying out the regression procedure in a stepwise manner. The stepwise regression also provides a method of introducing parameter constraints into the analysis.4.9 Stepwise Regression
The algorithm given here is essentially that due to Efroymson [ 1960] . In order to invert a n x n matrix IAI the Gauss-Jordan pivotal method is used so that if a 1) .. are the elements of IAI before pivoting then after pivoting on a non-zero diagonal element akk the new matrix has elements
aiJ • alk ak/akk i
:f
k jjk -aik/akk j:f: k j=k r=
{4.25) a ij ak/akk i=k j:fk 1/akk i=k j=kAfter all diagonal elements have been used as pivots the matrix IAI is completely inverted. If any of the diagonal elements are zero or become zero the inversion cannot be completed. By partioning IAI into IA1 11 the submatrix containing the diag
on-al elements which are to be used as pivots and the other three sub matrices lA 12
1,
IA2 1 I, IA2 21, so thatlA I (4.26)
then pivoting on the chosen elements yields the mat -rix
{4.27)
This result is important in the application of stepwise inversion to multiple linear regression used in the following section.
Now Jet IZI be a (m x n) matrix of observ a-tions on a set of n variables expressed as deviations from their mean values, i.e., zij -
z
i
,
i=
1, . . .,n, j = 1, . . . ,m. One of these variables z0 is the dependent variable in a regression equation on a sub· set of the other n -I variables which are to be tested in a stepwise manner as possible independent vari-ables. The independent variables are added to the re-gression equation one by one, so that at any stage the matrix IZI may be considered as two submatrices
IZI = IIXI IYII (4.28) where lXI is the matrix of variables already in the regression equation and IYI is the matrix of variables not in the regression, including the chosen dependent variable. The covariance matrix of all the variables is given by
IIXI IYIITIIXI IYII = IXITIXI IX111YI IYITIXI IYITIYI
{4.29) The stepwise inversion algorithm may be applied to the covariance matrix by pivoting on.p; on the di a-gonal elements of the submatrix lXI lXI, i.e., the
covariance matrix of the independent variables
al-ready in the regression. Tltis partial inversion of the total covariance matrix gives the result according to the stepwise algorithm of Equation 4.25 to give result
of Equation 4.27,
(4.30)
and using the standard results for the multiple linear
regression of Equation 4.'22 this matrix can be
written as
IB
I
(4.31)
-IBI
l
SI
where
IB
I
is the matrix of regression coefficients ofeach of the "y" variables on the variables already in the regression and includes the regression of the
chosen dependent variable on the "x" variables. The
matrix
l
SI
is the residual covariance matrix and the diagonal elements contain the sums of squares of the residuals of the "y" variables estimated from "x"variables. The essence of stepwise regression lies in moving variables from the "y" set to the "x" set and
vice versa in order to minimize the residual sum of
squares in the chosen dependent variables yd. The
variable to be next entered into the regression is the y. I with the lar0°est value of b.d /s .. I II , where b .. l)
and s.. J) are elements of
I
B
I
and!S
I
respectively.In order to avoid singularity in the matrix inversion
procedure the magnitude of the diagonal element to
be used as the next pivot is checked by comparing it
with an arbitrary tolerance value, e.g., 0.00 1. If the
clement is smaller than the tolerance value then the corresponding variable is not entered into the
regres-sion. Variables may also be removed from the regres
-sion if they lose significance. The F-test is commonly
used as a significance test for entering or removing
variables. The stepwise procedure continues until
there is no further reduction in the error variance of the dependent variable or the tolerance of diagonal pivot. clements becomes too small.
4.10 Application to Non-linear Least Squares
In the case of the non-linear least squares the independent variables are replaced by the partial deri-vatives of the regression equation with respect to the parameters of Equation 4.17,
(4.32)
and the residual error becomes the dependent variable (4.33) Thus the initial data matrix becomes
IIX
I
IYII =I
If'
(x;0°)1 ..-.-l
y-
f(x:8°)1 , (4.34) """"--'and the "covariance" matrix is formed in the same manner as that in Equation 4.29. Application of the inversion procedure and recognizing that lAO
I
=
IB
I
gives the result according to Equation 4.31 as
(4.35)
The use of a stepwise procedure becomes important
in that if any of the diagonal elements of
have a low tolerance value: (and thus likely to cause
singularity), they are not used as pivots and the cor -responding t::,8 i 's are zero. Otherwise, /:::,.8 i is given
in the
I.M I
matrix. This is also a means of handlingparameter constraint. When a particular Oi has
reached its boundary value (this is in the input to the
procedure) the corresponding diagonal element is no
longer used as a pivot. When a set of t::,(J have been
found from the assumed initi'.ll values
1°
the newvalues for the next iteration are:
o'
= 0° + /:::,.0( 4.36)
and the procedure continues. If
Oj+ I =
o!
+ t::,(). i I lexceed~ its boundary value the matrix is unpivoted on
the corresponding element and an o:/))JJ. I found for
o:
<
I so that tl1e boundary condition is satisfied.The above computational procedures arc those
em-ployed in the empirical section of tlus report by using
the Biomedical Computer Program BMDX85 (1970).
4.1 1 Three Additional Notes on the Procedure (I) Throughout the foregoing analysis the
usual properties of least squares regression have been
assumed. That is, the error term is considered to be
symmetrically distributed with constant variance and to he independent. Sometimes, the constant variance assumption may not be satisfied, e.g., large Y; having
larger errors or some observations may be unreliable.
11tis situation can be handled by introducing a weighting variable w1 with each observation.
The value of wi is proportional io the reli
-ability of the ith observation. Usually the weights are
normalized so that
m
"" w. =] i=J I
(4.37) (4.37)
where m is the number of observations. The set of
observation equations ( 4.19) become
lwiiXIIBI = lwiiYI
+
lwllel (4.38)so that the error wie1 has constant variance for all
observations. TI1e least squares estimate of the regr es-sion coefficients is
(4.39)
The values to be chosen for the weights
wi arc usually estimated from physical considerations such as instrumentation errors or if it is known that
the error is proportional to the magnitude of the
dependent variable y then the weights are scaled
accordingly.
(2) An interesting property of the non-linear
least squares procedure becomes evident when ana·
lyzing functions of the type
()
0
y=Otxl 2x2 3 (4.40)
such as occurs in the Hall and Butcher IJ968]
model. The non-linear least squares procedure gives
the least squares estimates of the parameters () 1 , 0 2, 6 3, whereas the commonly applied technique of
taking logarithms
and employing linear least squares regression leads to
biased estimates. The reason for the bias is that the sums of squares of the logarithms of the errors are
minimized which is not usually the correct error
model. Edwards (1962] gives examples of this effect
using the Cobb-Douglas multiplicative production
function.
(3) With certain types of non-linear functions and data sets the non-linear regression procedure may not converge if the assumed initial set of parameter
values 8° is poorly chosen. There arc no easily
usable r';:i'Ies to determine when such a situation is likely to occur so the possibiHty should be recognized
in any analysis. Often the initial parameter values can
be estimated from the physics of the problem. An
alternative procedure is to use linear least squares Lo
estimate the linear parameters in a function
0~ ()4
y ::: O I X I - + () 3 X2 (4.42)
the parameters 0 1 • 0
3 can be calculated and initial
values of 0 2 = 0 4
=
I assumed for the non-linear parameters.Chapter 5
APPLICATION OF THE MODEL
5.1 Description of the Data
Two types of data were used to test the model.
Firstly, 210 observations of synthetic data were
generated according to a certain non-linear function 1
in order to test some properties of the estimation
techniques. The second data type consisted of
com yield values, corresponding monthly rainfall and
soil moisture at planting from 20 experimental plots
in Minnesota and South Dakota for the years
1960-1961. The initial soil moisture data was missing
from six of the plots for 1961 and therefore only 34
independent observations were available. These data
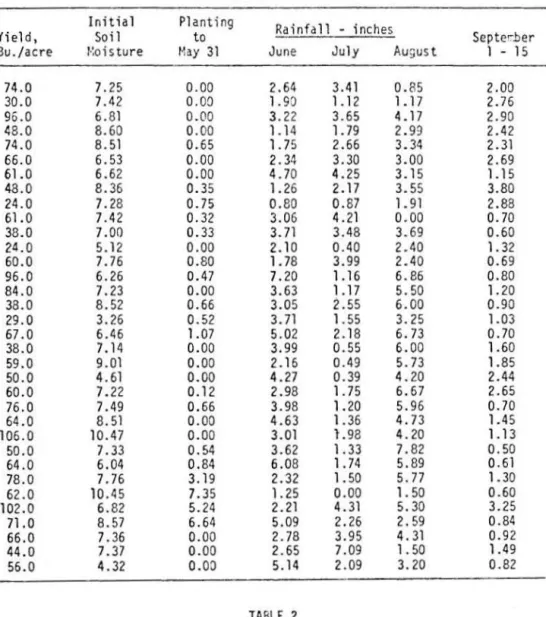
were abstracted from a U.S.D..A. Agricultural Research Service Publication (Holt et. a/. 1965] and
are given in Table 1. There were also data for stand
and fertilizer treatment for the plots but inclusion of
these additional variables in the model would have required more observations to avoid loss of degrees of
freedom. There was no evaporation or evapotranspira
-tion data available for the plots and no attempt was
made to estimate this factor and include it in the
data input. There were two reasons for this apparent
omission. Firstly, the evapotranspiration data would
have necessitated further functions and parameters
because of the lack of enough information to
con-duct a soil moisture balance and, therefore, cause a
lack of degrees of freedom. Secondly, the model is
for the purpose. of estimating the frequency of
agri-cultural drought from the statistical properties of the
input variables. Although the statistical properties of
rainfall can be easily found from the abundant data
available this is not true for the joint distribution of
rainfall and the climatic factors involved in
evapo-transpiration. Further study in this area will provide
the answers but until they are found and more crop
data becomes available the analysis is confined to
rainfall input.
5.2 Demonstr.ation of Analytical Capability Using
Synthetic Data
In order to demonstrate the capability of the
non-linear least squares technique in detecting the
correct model among a limited set, the data used were
generated without any error term by means of the
function y = 2.0 xt 0.38 + 3.0 x2 0.38 + 4.0 x3 0.38 + 5.0 x4 0.38 + 3.0 xs 0.38 + 2.5 (xJ x3)0.2t +3.0(x,x4)0.21 +4.0(x2x3)0.2J +4.5(x2x4)0.21 +4.0(x3x4)0.21 +3.0(x3xs)0.21 +2.0(x4xs)o.2t' (5.1) where x 1 , x2, x3, and x
5 were values of moo thly
rainfall at 5 stations with the statistical properties
shown in Table 2. The model proposed for analysis
irlcluded all the second order cross products whereas
three of these were omitted from the generation
scheme. Thus the model is
Y = p(J) x, p(2) + p(3) x2 p(4) + p(5) x3P(6) + p(7) x/<8> + p(8) x/<1 o) + p(I 1) (x1 x 2)P<• 2 > + p(13)(xl x3)P(14) + p(15)(xl x4)P(I6) +. p(l7) (x1 x3)P0 8) + p(19) (x2x3)P<20) + p(21) (x 2x4)P(22) + p(23) (x2x5)P<24> + p(25) (x3x4)P(26) + p(27) (x3xs)P(28) + p(29) (x4xs)p(3o) ' (5.2)
with the constraints
o..;;p(i)
..;;
I.oo,
i=3,4,6,8,I0,12,14,I6,18,20,22, 24, 26, 28, 30'
p(i) ~ 0 ' i = 1' 3' 5. 7' 9' ll ' 13' 15' 17' 19'
21,23,25,27,29 ,
and irlitial values
p(i) = 1.00 for all i .
The results of the parameter estimation after 50 it
TABLE 1 Corn Yield Data 1960-1961
Initial Planting
Rainfall - inches
Yield, Soil to Septer.ber
Bu./acre l·:oi s ture !·lay 31 June July August 1 - 15
74.0 7.25 0.00 2.64 3.41 0.85 2.00 30.0 7.42 0.00 1.90 1.12 1.17 2.76 96.0 6.81 0.00 3.22 3.65 4.17 2.90 48.0 8.60 0.00 1.14 1. 79 2.99 2.42 74.0 8.51 0.65 1. 75 2.66 3. 34 2.31 66.0 6.53 0.00 2. 34 3.30 3.00 2.69 61.0 6.62 0.00 4.70 4.25 3.15 1.15 48.0 8.36 0.35 1.26 2.17 3.55 3.80 24.0 7.28 0.75 0.80 0.87 1.91 2.88 61.0 7.42 0.32 3.06 4.21 0.00 0. 70 38.0 7.00 0.33 3. 71 3.48 3.69 0.60 24.0 5.12 0.00 2.10 0.40 2.40 1. 32 60.0 7.76 0.80 l. 78 3.99 2.40 0.69 96.0 6.26 0.47 7.20 1.16 6.86 0.80 84.0 7.23 0.00 3.63 1.17 5.50 1.20 38.0 8.52 0.66 3.05 2.55 6.00 0.90 29.0 3.26 0.52 3. 71 1. 55 3.25 1.03 67.0 6.46 1.07 5.02 2.18 6. 73 0.70 38.0 7.14 0.00 3.99 0.55 6.00 1.60 59.0 9.01 0.00 2.16 0.49 5.73 1.85 50.0 4. 61 0.00 4.27 0.39 4.20 2.44 60.0 7.22 0.12 2.98 1. 75 6.67 2.65 76.0 7.49 0.66 3.98 1.20 5.96 0.70 64.0 8. 51 0.00 4.63 1.36 4.73 1.45 106.0 10.47 0.00 3.01 1.98 4. 20 1.13 50.0 7.33 0.54 3.62 1. 33 7.82 0.50 64.0 6.04 0.84 6.08 1. 74 5.89 0.61 78.0 7.76 3.19 2.'32 1.
so
5. 77 1.30 62.0 10.45 7.35 1. 25 0.00 1. 50 0.60 102.0 6.82 5.24 2.21 4.31 5.30 3.25 71.0 8.57 6.64 5.09 2.26 2.59 0.84 66.0 7.36 0.00 2.78 3.95 4. 31 0.92 44.0 7.37 0.00 2.65 7.09 1. 50 1.49 56.0 4.32 0.00 5.14 2.09 3.20 0.82 TABLE 2Statistical Proper~ies of the Synthetic Data
Variable x, x2 x3 x4 x5 Mean 1.30 1.56 l. 70 1.41 1.42 Standard Deviation 0.33 0.34 0.36 0.42 0.36 Correlation Matrix Variable x, x2 x3 x4 xs x, 1.000 0.265 0.093 0.080
o.
109 x2 1.000 0.067 0.056 0.255 x3 1.000 ·0.088 0.004 x4 1.000 0.035 xs 1.000TABLE 3
Results of Pararr.eter Estirr.atlon for Synthetic Data Parameter True Value
1 2.00 2 0.38 3 3.00 4 0.38 5 4.00 6 0.38 7 5.00 8 0.38 9 3.00 10 0.38 11 0.00 12 o.oo 13 2.50 14 0.21 15 3.00 16 0.21 17 0.00 18 0.00 19 4.00 20 0. 21 21 4. so 22 0. 21 23 o.oo 24 0.00 25 4.00 26 0.21 27 3.00 28 0.21 29 2.00 30
o.
21It is interesting to note that the terms actually missing in the true model compared to the proposed model were removed by driving the relevant para-meters to insignificantly small values. This type of behavior can be expected only if the functions used as terms in the model vanish at certain parameter values. The large number of iterations used here is not always necessary just to obtain "true" parameter values because the value of the dependent variable is often relatively insensitive to changes in some of the parameters. In this example the variance of y was 73.96 and after 20 iterations the error mean square was 2.60. Since the data are error free this value re-presents model error of only 3.5 percent unexplained variance. At 50 iterations the error mean square had been reduced to 7.46 X 10"9• The number of iterations
required in any particular problem depends on the
number of parameters, the parameter correlation structure, the initial values and the constraints im-posed on the parameters.
Est irr.a ted Value
1.98 0.38 3.00 0.38 3.99 0.38 5.00 0.38 3.00 0. 38 -6 1.21x1o_16 4.44x10 2.53 0.21 2.99 o·.21 _ 3 2.33xlo_ 15 7.10x10 4.00 0.21 4.50 0.21 -4 1. 32x1 0 _ 15 3.55x10 3.99 0.21 2.98 0. 21 2.01 o. 21
5.3 Assumptions in the Formulation of Models for Com-Yield Data
The rainfall data are in monthly totals except for the parts of May and September included in the
growing season. The relative coarseness of this time
increment means that the critical days or weeks in the growth cycle cannot be identified closely with the respective precipitation inputs and a good model simulation cannot be expected. The data come from plots on four different soil types and this factor has not been taken into account because the reduction in degrees of freedom by introduction of the relevant terms would seriously affect the significance of the results. The evapotranspiration at any one time is considered to be the same for all plots for the two
years of data collection although variation during the
growing season is implicitly taken into account. Again the relevant terms could be included if more observa-tions are available.
1hroughout all the models to be tested the
basic building block function is x.a1 i, where x. 1 is
the precipitation input during period i except for
the soil moisture at planting time. Other functions
could be chosen which theoretically may fit the plant
behavior better but for the assumptions and data considered xa, has sufficient flexibility. An
advan-tage of xa is the fact that the effect of any parti·
cular xiai, in product form with other terms can be
eliminated by driving o:i to zero in order to remove
model error. For example, if the 'true' model is
a a
Y
=x lx 21 2
then it can be obtained from a proposed model
when the analytical procedure puts o:3 = o:4 = 0.
For all the models tested the basic variables
were
x1, the soil moisture at plartting plus rainfall in May from planting time to the end of the month.
planting time to the end of the month,
x2, the rainfall in June,
x3, the rainfall in July,
x4, the rainfall in August, and
15.
x
5 , the rainfall in September up to September
5.4 Formulation and Testing of Some Models
Instead of proposing one particular model on
the basis of the boundary conditions as suggested
earlier, several types of model are considered in order
to demonstrate the effects of model error and the
analytical capability of the procedure.
(1) The 5th order product
(5.3)
This model assumes that all periods are critical.
Before using the non-linear least squares in this case a
simple least squares regression on the logarithms was
carried out, i.e.,
+ o:
5 Jog x5 +log a . (5.4)
The least squares regression yielded
y = 6 76 X0.67 X0.41 XO.J7 XO.l3 XO.J 7 (5 .5)
• 1 2 3 4 5
The parameter estimates are biased because of
mini-mizing the mean square of logarithm of the assumed
multiplicative error term. R2 = 0.526 although this value is uncorrected for degrees of freedom and
diffi-cult to interpret in terms of the untransformed data.
The parameter values look feasible even though there
were no constraints. Corrected error mean square is
581.
The same model was analyzed by the non-linear least squares procedure with the constraints
a~ 0 , 0 ~ o:1.,.;;; 1, for i = 1, 2, 3, 4, 5,
with the initial values
a= 0.1 o:i = 1.00 i = 1' ... , 5 .
The set of partial derivatives, f'{:UJj of the assumed
function of Equation (5.3), which constitute the
in-dependent variables in the non-linear regression, are
(5.6)
etc.,
with the "dependent variable"
al a2 a3 a4 as
y-ax1 x2 x3 x4 x5 ,
and the "regression" coefficients
for .each iteration in the parameter estimation.
The procedure would not converge thus
pro-cedure was also run with the initial parameter values equal to those estimated by the log transformation
method as given above, but still did not converge.
(2) This model was then extended by
consider-ing the possibility of some non zero intercept forms
which admit non-critical periods and represent a
general model of the type proposed by Hall and Butcher [1968]
with the constraints
ai;;;. 0, i = 0, l, ... , 5
0 .;;;; ai .;;;; 1 , i = 1 , 2, ... , 5 ,
and the initial values
ai = .00001 , i
=
I, 2, ... , 5Again the procedure did not converge. These results suggest that the model is inadequate probably
because the interactive effect between periods is more
important than was assumed in this model.
(3) The next model considered was the 4th
order one including all the five product terms, namely
a2 a a as
y=alx2 x3 3x4 4xs
(5.8)
It was expected that not all terms or all parts of
a term would be significant. The number of
para-meters is large (25) but this will be reduced if any of
them vanish in the analysis.
This model converged very quickly in 19
itera-tions to the form Y = .0063 X 1 x3x4x5 + 2.59 x1 x4 O.l 7 + 9 73 X .10 X 0.51 X 0.34 X 0.38 . 1 2 3
s
+ 0.39 x2x4 . (5.9)The constraints on the parameters were
o.;;;;a:i,~i''Yi' oi,ei.;;;;t.oo, for i=l, ... ,s and
ai ;;;. 0
Some of the parameters did take on boundary
values and removal of the constraints tended to yield
non-physical results. The error mean square corrected
for the degrees of freedom for the parameters in the
final form of the model was 471 and uncorrected for
degrees of freedom was 249. The latter value is in
-cluded as a measure of the simulation obtained as the
sparse data employed in the study does not give an
optimistic view of the capabilities of the model. The
above value of error mean square corresponds to an explained variartce of 46 percent. The derived model also has the interesting boundary property that
al-though no one zero rainfall period will destroy the
crop any two successive zero periods will do so. This fact is very much in keeping with the physical
situa-tion as the zero values appearing in the data lead to a
similar conclusion.
(4) A consideration of all the possible 3rd order
products in a model would lead to a large number of
parameters, 40 in this case, which exceeds the
number of observations. Therefore, some prior
know-ledge such as the boundary conditions would have to
be used. However, any group of five or fewer third
order terms are a special case of the five fourth order
terms with certain parameters equal to zero and thus
a good model of this form would have been detected
in the previous analysis.
(5) The first and second order terms were
in-cluded in one model although each product term had
a common exponent
(5.10)
with constraints ai ;;;. 0, and 0 .;;;; a:i .;;;; 1, which
resulted in the model y = 2.79 x
1
+
2.99 x2+
1.79 (x1 x3)0·47
+
0.16 (x1 x 4)