Aerospace 2019, 6, 134; doi:10.3390/aerospace6120134 www.mdpi.com/journal/aerospace
Article
Assessment of a Turbo‐Electric Aircraft
Configuration with Aft‐Propulsion Using Boundary
Layer Ingestion
Rainer Schnell 1,*,†, Xin Zhao 2,†, Efthymios Rallis 3,†, Mavroudis Kavvalos 2,†, Smruti Sahoo 2,†,
Markus Schnoes 1,† and Konstantinos Kyprianidis 2,† 1 Institute of Propulsion Technology, German Aerospace Center (DLR), 51145 Cologne, Germany; Markus.Schnoes@dlr.de 2 Future Energy Center, School of Business, Society and Engineering, Mälardalen University, SE72219 Västerås, Sweden; xin.zhao@mdh.se (X.Z.); mavroudis.kavvalos@mdh.se (M.K.); smruti.sahoo@mdh.se (S.S.); konstantinos.kyprianidis@mdh.se (K.K.) 3 Department of Mechanincal Engineering, Aristotle University of Thessaloniki, GR54124 Thessaloniki, Greece; efthymios.rallis@mdh.se * Correspondence: rainer.schnell@dlr.de † These authors contributed equally to this work. Received: 8 November 2019; Accepted: 11 December 2019; Published: 16 December 2019 Abstract: In this paper, a turbo‐electric propulsion system was analyzed, and its performance was assessed. The aircraft considered here was a single‐aisle, medium‐range configuration targeting a capacity of 150 Pax. The propulsion concept comprised two boosted geared turbofan engines mounted under‐wing. Those main engines were supported by an electrically driven aft‐propulsor contributing to the thrust generation and by taking advantage of ingesting the boundary layer of the fuselage for potentially higher levels of propulsive efficiency and allowing for the improved operation of the main engines. The performance assessment as carried out in the context of this paper involved different levels: Firstly, based on the reference aircraft and the detailed description of its major components, the engine performance model for both main engines, as well as for the electrically driven aft‐propulsor was set up. The methodology, as introduced, has already been applied in the context of hybrid‐electric propulsion and allowed for the aforementioned aircraft sizing, as well as the subsequent gas turbine multi‐point synthesis (simulation). A geared turbofan architecture with 2035 technology assumptions was considered for the main engine configuration. The present trade study focused on the design and performance analysis of the aft‐propulsor and how it affected the performance of the main engines, due to the electric power generation. In order to allow for a more accurate description of the performance of this particular module, the enhanced streamline curvature method with an underlying and pre‐optimized profile database was used to design a propulsor tailored to meet the requirements of the aft propulsor as derived from the cycle synthesis and overall aircraft specification; existing design expertise for novel and highly integrated propulsors could be taken advantage of herein. The resulting performance characteristics from the streamline curvature method were then fed back to the engine performance model in a closely coupled approach in order to have a more accurate description of the module behavior. This direct coupling allowed for enhanced sensitivity studies, monitoring different top‐level parameters, such as the thrust/power split between the main engines and the aft propulsor. As a result, different propulsor specifications and fan designs with optimal performance characteristics were achieved, which in return affected the performance of all subsystems considered.
Keywords: turbofans; civil aviation; turbo‐electric propulsion; boundary layer ingestion (BLI); multi‐point gas turbine synthesis; propulsor design; streamline curvature
1. Introduction
Facing an exponential growth in civil air traffic over the next decades [1], accompanied with growing skepticism in the population towards air traffic in general, almost all major economies in the world initiated dedicated research efforts to compensate for or, at least, minimize the negative impacts induced by aircraft emissions. In Europe, the initial targets, formulated in the context of ACARE’s visions 2020 in the early 2000′s within an alliance of research organizations, universities and industry, were continued and extended, resulting in an updated version of its Strategic Research Agenda named Flightpath 2050 [2]. The major targets laid out therein concern a significant reduction in CO2, NOx and noise emission; those ambitious goals are expected to be reached with major contributions from engine and aircraft technology, as well as air traffic management (ATM) and operations in general. Continuous and rather evolutionary development of gas turbine technology already led to a major reduction in specific fuel consumption (SFC) for the latest generation of A320 equipped with new engine technology (NEO) compared to 2000’s technology. This trend of improving conventional technology at module and system level is expected to continue, but also novel and more revolutionary concepts are to be considered, due to the already very high level of maturity of the existing technology. In this context, complementing the classical gas turbine cycle with electrical components is expected to open the design space further, and hence, offering more potential to increase overall performance. Whereas, purely electrical driven aircraft does not seem a viable option mid‐term, due to excessive energy density requirements, well exceeding the technically achievable limits (at least at a larger scale), turbo‐ and hybrid‐electric configurations may have potential benefits and are subject to a growing number of research activities worldwide and within Europe. Most of those concepts have in common that a gas turbine is being used for providing the major portion of the energy, whereas, a combination of power extraction from the main engine and power input from batteries is also considered in various arrangements. The potential advantages of such configurations at a system level can be summarized as follows:
Improved operability of the gas generator (e.g., by minimizing cooling requirements or enhancing component performance in terms of stall margins, resulting in reduced required variability),
possible re‐(down‐)sizing and optimization of the gas generator (e.g., by relieving the core engine requirements by additional power input from an electrical source at the most demanding, and hence, sizing relevant mission points), and
decouple the location of thrust induction from power generation and thereby further opening the entire design space and allowing for novel aircraft configurations with improved engine integration (e.g., by ingesting the fuselage boundary layer).
The first two points have been addressed in several studies, and their potential benefits were quantified, e.g., in References [3–6]. The third point entails a large variety of possible configurations and arrangements, of which one was selected and is subject to the present study: The chosen configuration comprises a conventional tube‐and‐wing aircraft with two main under‐wing engines producing the major portion of the required thrust. An additional, electrically driven propulsor is introduced in the backend of the aircraft fuselage and contributes to fulfilling the overall thrust requirements. Due to this arrangement, the aft‐propulsor is able to ingest the fuselage boundary layer, and hence, may operate at higher levels of propulsive efficiency; this is expected to increase the overall efficiency of the entire propulsion system, potentially translating into an SFC benefit. However, the additional weight and drag introduced by both, propulsor and electrical system, along with necessary modifications of the aircraft (e.g., due to a possible re‐design of the entire empennage) will compromise the potential benefits, which makes the evaluation of the given
technology at the system level a necessary step. In general, this arrangement is considered to be the most conservative among more radical and future headed scenarios since it retains most of the classical tube‐and‐wing layout, including the benefit of existing gas turbine technology.
The potential advantages of a boundary layer propulsion system were identified and addressed already in the mid 40′s of the last century [7], and configurations taking advantage of this effect have been broadly investigated ever since. The most comprehensive overviews and framework of equations, more or less universally applicable at a conceptual level to any new aircraft (A/C) configuration, can be found in Reference [8], and a more recent one in the direct context of novel aircraft configuration in Reference [9]. The configuration, as studied in the context of this paper, has also been introduced and studied by other researchers, one of the most comprehensive and prominent one being provided by NASA named Single‐aisle Turboelectric Aircraft with an Aft Boundary Layer (STARC‐ABL) in Reference [10]. More recent studies of this particular configuration are not only presenting a refined overall performance assessment at higher levels of fidelity [11,12], but furthermore addressing specific aspects, such as the Computational Fluid Dynamics (CFD)‐based design optimization of the aft propulsors’ intake [13]. Those investigations are complemented by other studies of similar concepts, however, in most cases at a lower level of fidelity and more conceptual in nature [14,15]; all studies, however, suggest a benefit in terms of mission‐based block fuel and encourage a number of activities dedicated to this particular concept. Based on the available data and modelling approaches as described in the given literature (or a lack thereof), the main research questions that will be addressed in the present article shall be derived and posed at the next chapter.
2. Research Objectives and Layout of the Present Study
In light of the anticipated technological advances outlined above, the main mechanisms defining the system performance of the given configuration are the following: 1. The amount of boundary layer captured by the aft‐propulsor and hence, the level of achievable propulsive efficiency; 2. The performance and design of the aft‐fan; 3. The performance of the main engine and its components, in particular considering that power is being extracted and transferred to drive the aft propulsor; 4. The performance and weight of the electrical system.
All mentioned aspects are inherently inter‐dependent in such way that, e.g., the amount of captured boundary layer is influenced by the aft‐propulsor dimensions, which are driven by its pressure ratio (FPR) and mass flow rate, resulting from the level of power input to the aft‐fan as being extracted from the main engines; this, in return, drives the performance of the gas turbine. One of the main design choices at top‐level to be made is the thrust or power split between the main engine(s) and the aft propulsor. At the module level, FPR then has to be chosen to initiate more detailed design considerations of the aft‐fan. A detailed knowledge of the boundary layer (or respective momentum deficit) that can be ingested into the aft‐fan typically requires a dedicated and CFD based design effort of the fuselage and the intake; some further information can be found in References [10]. Since the present study was carried out exclusively at the conceptual level, the introduction of CFD was not considered. A sensitivity analysis conducted for the inlet momentum deficit, as potentially being captured by the aft‐fan; several design efforts were realized at different levels of momentum deficit for a given set of power extraction and FPR. This was used to explore the design space, and served as a guide to choose the top‐level cycle and fan parameters, allowing for a more detailed design of the fan afterwards. An underlying performance model of the gas turbine was used to evaluate the performance of the cycle, taking advantage of multi‐point synthesis matching theme at key mission points. In this context, the main questions that will be subsequently addressed and answered in the following chapters, also defining the layout of the present study, are the following:
(1) What is the sensitivity of the system top‐level parameters, here mainly being the power extraction from the main engine low speed shaft (PWX46) to the aft‐fan (PWX48), as well as the aft‐fan FPR, on the overall performance metrics (downselection)?
(2) What implications and challenges do those choices impose on the conceptual design of the aft‐fan and to what extent do they affect the gas turbine/main engine performance?
Since addressing those questions always has to be seen in the light of the assumptions that were made and the methods being used, the next chapter will summarize both in order to make the results as transparent as possible. Figure 1 highlights the main components of the present study in a schematic manner: The actual aircraft as used in this study, and the underlying mission will be described in Section 3.1. The gas turbine with all its components represented by a thermodynamic cycle model is introduced and assessed in Section 3.2 and the aft‐propulsor design, which was realized with a streamline‐curvature based design method, will be discussed in Section 3.3; the respective coupling of the cycle model with the streamline curvature method will be described and discussed in Section 3.4. The main results, quantifying the overall potential of the given concept, will then be summarized in Section 4.
Figure 1. Turbo‐electric aircraft concept with aft propulsion as investigated in the present study and initially introduced in Reference [10] (left), boundary layer ingestion (BLI)‐propulsor located in the aft section of the aircraft resulting from the present study (center) and engine layout of the main under‐wing engines and aft‐fan (right). 3. Assumptions and Methodology 3.1. Aircraft and Mission Profile An A320‐like, single‐aisle aircraft, more details of which are given in this paragraph, was the basis of the present study. The thrust requirements of the main mission points are summarized in the following Table 1:
Table 1. Major aircraft mission and performance parameters, as well as thrust requirements (per engine) for the mission points considered [6].
Take‐Off Top‐of‐Climb Cruise
Thrust (kN) 92.5 24.0 18.0 Altitude (m) 0 10,668 10,668 Flight Mach (‐) 0.25 0.78 0.78 ΔTISA (K) +15 +10 +0 Since the concept clearly aims at fuel burn benefits at Cruise conditions, only the main mission points for the aerodynamic and thermal design of the gas turbine, as well as cruise were included in the sensitivity analysis. No full mission analysis was carried out for boundary layer ingestion (BLI) scenarios, but the resulting block fuel‐saving potential was estimated through the use of exchange rates. Those exchange rates translated the change in cruise SFC, weight and drag into a respective
change in mission fuel burn; all necessary details regarding this conversion are provided in Section 4.3.3. More information on the mission characteristics and resulting engine performance of the baseline engine at all ratings can be found in Reference [6] and Table A1 in the appendix. Regarding the aircraft geometry, the Central Reference Aircraft Data System (CeRAS) model in Common Parametric Aircraft Configuration Schema (CPACS) format was available [16] representing a validated and re‐engineered version of an A320. Its main geometric features are summarized in Table 2.
Table 2. Aircraft and mission characteristics. Aircraft and Mission Unit Value
Design Range km 4800 Business Case Range km 925 Passenger Capability ‐ 150 Wing Area m2 122.4 Wing Span m 33.91 Tailplane Area m2 31.0 Tailplane Span m 12.45 Fin Area m2 21.5 Fin Span m 6.26 Fuselage Length m 37
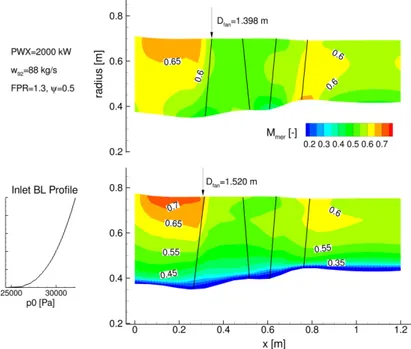
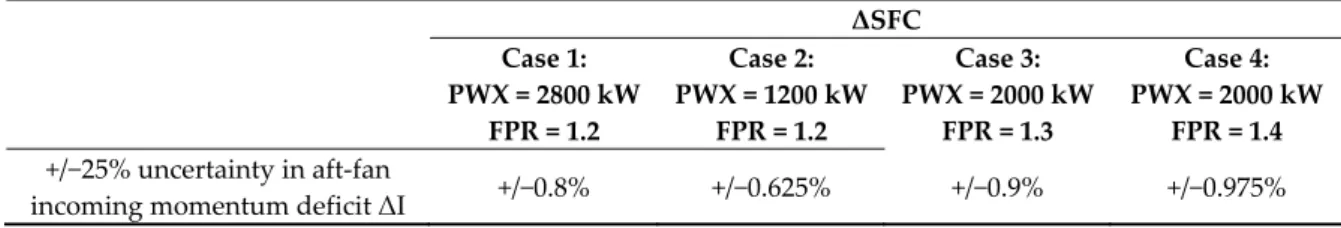
The resulting performance parameters were also available through the Environmental Assessment (EVA) framework to allow for a coupled consideration of aircraft and engine performance for a given mission profile. The specifications of EVA can be found in Reference [17], and more information will be provided in the following chapter when describing the main engine cycle. The tail cone geometry of the given aircraft model was used within this study to define the location where the fuselage diffusion begins and also to define the minimal hub diameter of the aft‐fan. One important constraint applied to this study was to fix this radius at r = 0.37 m in order for the tail‐cone propulsor to be structurally integrated and comply with the given fuselage geometry (see also [10] in which a similar arrangement and values were used). Regarding the fuselage boundary layer, a rough estimate based on simple turbulent flat plate theory using (1/7th) power law [18] was made, taking into account the given fuselage dimensions and aircraft mission parameters (flight Ma and altitude). Together with aft‐propulsor mass flow rate, this profile defined the incoming momentum deficit (see Figure 2), which also was assumed to be axisymmetric. The boundary layer theory applied did not include any pressure gradient, and all the integrated fuselage friction was directly translated into a corresponding average total pressure loss. This treatment of the incoming boundary layer, despite being practically applicable and reasonably representing the prevailing flow physics at conceptual level, is only a first order estimate and the incoming momentum deficit largely depends on the fuselage and intake design, as well as the respective diffusion (and also the real boundary layer height may be substantially smaller or bigger [19]). Hence, the uncertainty in predicting the real achievable incoming momentum deficit was considered in a sensitivity study.
Figure 2. Sketch of the A/C tail cone and derived geometric boundary conditions for the aft‐fan conceptual design, as well as assumptions on the incoming boundary layer based on turbulent flat‐plate boundary layer profiles. 3.2. Main Engine Gas Turbine Cycle As far as the two under‐wing main engines are concerned, a geared turbo‐fan architecture was envisioned, and the overall engine performance modelling schematic (with corresponding power extraction from the low‐speed shaft) is shown in Figure 3.
Figure 3. Main engine gas turbine cycle and station definition.
Entry into service (EIS) 2035 component polytropic efficiency levels and maximal metal temperatures were being introduced into the performance model. The values for the engine specific thrust (SFN), gas generator overall pressure ratio (OPR), jet velocity ratio VcoldQhot and pressure ratio split exponent (PRn) at Cruise conditions emerged from a performance optimization of this particular engine as described in greater detail in Reference [6]. Those values or respective limitations were fixed in the present study by applying a multi‐point cycle synthesis for different and relevant mission points (for the BLI cases the main engine’s fan inlet mass flow w2 was fixed
rather than SFN (see Section 4)); here mainly the aerodynamic design point hot‐day Top of Climb (TOC) and hot‐day Take‐Off (TO). This set of parameters and respective matching thereof, more details of which are given in Table A2 in Appendix A, also defined the baseline engine (without power extraction and aft‐fan) to which all cases with aft‐propulsion and BLI will be assessed against.
Originated from the baseline, for all the BLI cases, it is important to highlight that the very same parameters of the gas generator (OPR, PRn, VcoldQhot and T4 at cruise, as well as the turbine maximum metal temperatures) were retained with power extraction and a respective thrust contribution from the aft‐propulsor. This resulted in comparable levels of core efficiency and allowed for a better analysis as to what mechanism is responsible for the potential or penalty. As illustrated in the matching scheme table A2 in Appendix A, for all the engine performance simulations, a multiple point synthesis was applied to keep the aforementioned main engine parameters constant. At multiple synthesis level, Bypass Ratio (BPR) and FPR at TOC were varied for the constant VcoldQhot and T4 at cruise, and compressor pressure ratios at TOC were varied for constant OPR and PRn at cruise. Metal temperatures were fixed through varying the corresponding turbine cooling flow. The minor effect from the selection of the cooling flow extraction point was, however, neglected—hence, the fixed extraction point defined. At a single point level, a constant fan inlet mass at TOC was set, in order to achieve a constant main engine fan size instead of a constant SFN. For a given FPR and BPR from synthesis level, as well as a constant fan inlet mass flow at TOC,
T4 at design point hot‐day TOC was varied for matching the thrust requirement and the power
delivered to the BLI fan. For the BLI fan, shaft power input and the pressure ratio of it were given, and the air mass flow going through it was varied to consume the power fed in. The aforementioned calculations were realized within the computational framework EVA, where disciplines like aircraft sizing and performance, as well as engine performance with multi‐point cycle synthesis matching scheme are incorporated [17]. 3.3. Propulsor Conceptual Design
The conceptual design of the aft‐propulsor was carried out using a streamline‐curvature method in a through‐flow manner using the DLR’s Advanced Compressor Design Code (ACDC) [20,21]. This study focused on this particular component, due to the more unknown, and to some extent, unconventional design space (as compared with the main engine component). The method requires a computational grid in a through‐flow plane—as shown in Figure 4—as an input, with a number of streamlines in the radial direction (k) defined at different axial locations (i). The position of each blade row is given by its respective leading and trailing edge index I; this also fixes the axial chord of each blade row. The grid also defines the annulus lines of the hub (k = 0) and the tip (k = kmax). Other input parameters to be specified are the number of blades for each blade row, the rotors’ rotational speed and the mass flow rate. Together with the physical boundary conditions defining the inlet thermodynamic states and flow kinematics (total pressure and temperature and flow angles, all as a radial profile and stemming from the fuselage boundary layer profile in the case of a BLI assessment), the method provides all necessary data to describe and assess the stage performance in the given through‐flow plane (=meridional plane along the machine axis, as shown in Figure 4, also referred to as S2M‐plane). Essentially two modes are available: A design mode, which requires an a priori definition of the radial distribution of the rotor total pressure ratio (the average of which is the design target resulting from the engine performance) and outlet guide vane (OGV) exit flow angle (typically chosen to achieve swirl free outflow) at design conditions. The second mode enables the assessment at off‐design conditions and the calculation of respective performance characteristics over the entire speed range. Both modes assess the fan design by taking advantage of a large database of pre‐optimized profiles (see References [20,21] for more details), together with standard correlations taking into account endwall and tip leakage effects. One of the advantages of the existing database is that it consists of performance parameters, such as profile losses and deviation being directly linked to geometric parameters. Hence, a full 3D geometry of the whole stage is available through interpolation within the database right away and allows for a seamless subsequent assessment and verification of the design using CFD (not being part of the conceptual design and not considered here). The design strategy for the aft propulsor and rationale for the main design decisions will be described in more detail in the corresponding Section 4.2.2. From the aforementioned method description, it is obvious, however, that the number of parameters to be specified requires a fair amount of design expertise and is not straight forward or directly to be
taken from textbooks. This underlines the necessity for an inter‐disciplinary exchange, involving experts with different backgrounds when exploring entirely new design spaces.
Figure 4. Computational grid and station definition as input parameters to the streamline‐curvature method ACDC (Advanced Compressor Design Code [20,21]) used for the aft‐propulsor conceptual design.
3.4. Method Coupling Procedure and Performance Characteristics Sensitivity
The consistency between module performance and the thermodynamic model at cycle level is of importance in order to gain knowledge of realistically achievable efficiency levels at design conditions under given constraints and in particular to describe the modules’ off‐design behavior. The latter one is of particular significance for the mission analysis and also to support early design decisions, such as the necessity for introducing variability, due to a compromised stall margin of the respective component. Typically, there are several ways of describing the performance of the respective module (here aft‐fan) at cycle level:
Use and scaling of a standard component map (either from open literature or from an internal database, depending on the level of knowledge);
The scaling of a more tailored map (e.g., stemming from initial design considerations of the respective module); Direct use of the unscaled map, e.g., from more advanced conceptual design iterations of the module; or A direct coupling between the cycle performance and the component design, typically realized in an iterative manner for each mission point (a zooming‐like approach). The latter approach is visualized in Figure 5: It starts with a given specification in terms of mass flow rate w92, FPR and a first assumption of the component efficiency level at the given mission point. Those data were exchanged with the streamline curvature method, which iterates by changing the rotational speed (RPM) to meet the targeted mass flow rate and FPR using a controller with Proportional, Integral and Differential (PID) characteristics. The efficiency level is a result, and all data were transferred back to the cycle. This procedure is carried out repeatedly until consistency between both models is achieved with a given accuracy. Typically, the method convergences after approximately five outer iterations, with 3–4 inner iterations of the Streamline‐Curvature (SLC) based method to adjust the operating conditions. Although some effort was put into realizing this direct coupling procedure, it only seems to have advantages when creating maps being more computationally expensive (e.g., by CFD) than being achieved with a through‐flow based approach (which needs less than a minute to produce the entire map). Rotor IGV Stator iTE,rotor C oordi na te r, S tr ea m lin e k Coordinate x, Station i iLE,rotor
Figure 5. Coupling procedure of the performance model (Environmental Assessment, EVA) with the streamline‐curvature method (ACDC); Δηis is the difference between values
of the current and the last iteration, ΔFPR the respective difference between current iteration and the target pressure ratio (FPR).
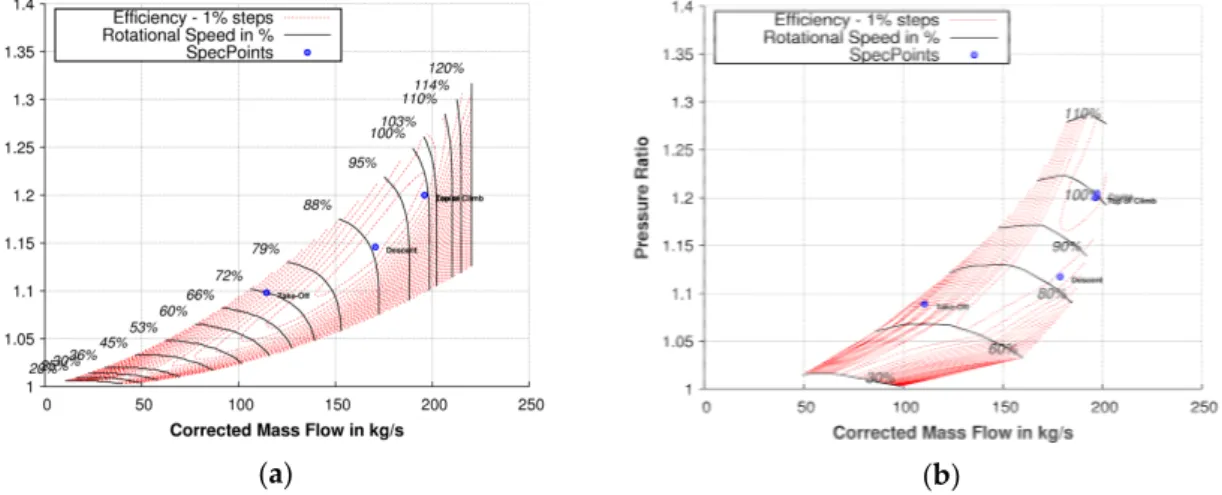
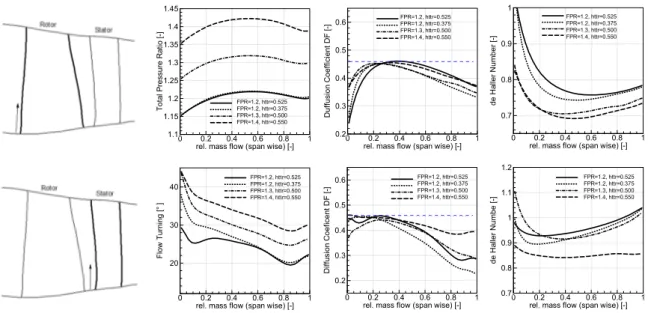
The advantage (or sometimes necessity) of having more detailed knowledge about the module performance at off‐design conditions is highlighted in the next two figures, Figures 6 and 7. In the plots, different performance characteristics of the aft‐fan are shown and compared. The obvious difference in their respective shape to a large extend is driven by the difference in FPR on the one hand and different design philosophies (here, choices of rotor tip speed) at given FPR on the other hand. It is presumed, for example, that the standard and pre‐existing maps, before being scaled down to match the target FPR, were originally designed for a higher FPR. This design yields an inherently steeper characteristic, due to higher and (supposedly) well supersonic relative rotor tip Mach numbers as compared to subsonic or close to sonic tip Mach numbers at the rotor inflow for the tailored and SLC based designs at lower FPR (1.2). Since at this point, no BLI scenario is considered and all maps were generated with radially constant inlet conditions, the difference in the shape of the maps is solely attributed to different design targets and philosophies. Apart from the performance characteristics, Figure 6 also shows a direct comparison of the location of the considered mission points when using standard maps (Figure 6a) and maps (Figure 6b) stemming from a first conceptual study of the aft‐propulsor for a chosen FPR = 1.2. Due to a constant power off‐take in all mission points, the Cruise and Top‐Of‐Climb points almost collapse and, contrary to the main engines’ operation, the descent point is also located at very high RPM, due to the high power input. A fixed nozzle operation was considered for all simulation points, and the nozzle is unchoked at all conditions for given levels of FPR. One of the most important observations concerns the aft‐propulsor stall margin at Take‐Off conditions. Whereas, the standard maps suggest sufficient reserves in terms of stall margin, due to the much steeper speed lines (representing a more transonic design or even the behavior closer to a multi‐stage Low‐Pressure Compressor (LPC)), the actual location of the Take‐Off point is closer to the expected component’s stability limit. However, this needs to be further quantified (e.g., as shown in Reference [22]), although the Aft‐Fan stall margin was not considered explicitly in all design efforts. Moreover, the corresponding rotational speed is substantially different, which is important for designing the electrical system. By comparing the maps from different design rationales or top‐level choices in Figure 7, all stemming from a conceptual design using the through‐flow approach, one can make a similar observation regarding the stall margin at Take‐Off conditions: Due to the steeper characteristic of a low‐work coefficient Ψ design, and hence, higher rotor tip speed, the stall margin is inherently greater as compared with a
high‐Ψ design at given FPR (ore details on the overall design rationale and choice and meaning of the working coefficient are provided in Section 4.2.2). Increasing the FPR, however, seems a more viable option to maintain a necessary stall margin of the aft‐fan. It is important to note that the through‐flow results do not provide the necessary fidelity to accurately predict the stall margin on an absolute basis, but rather give an indication and trend when comparing the different design strategies (in fact the stall line was estimated by omitting points with a lower than a given average de‐Haller number). However, as stated at the beginning of this chapter, early design choices to be made at cycle level regarding a necessary variability can be supported with a better idea of the module’s off‐design performance, and hence, additional iterations between the different design teams avoided.
(a) (b)
Figure 6. Location of the mission points in the aft‐fan performance maps—Results using standard maps as initially available in the performance model (a) and updated characteristics from dedicated fan design efforts using the SLC‐method for FPR = 1.2 and Ψ = 0.5 (b).
(a) (b) (c)
Figure 7. Location of the mission points as considered in this study in the aft‐fan performance characteristics and their respective dependence on the choice of fan corrected tip speed or work coefficient Ψ, respectively—Results for FPR = 1.2/Ψ = 0.6 (a), FPR = 1.2/Ψ = 0.4 (b) and FPR = 1.3/Ψ = 0.5 (c). 4. Results and Discussion 4.1. Sensitivity Studies 4.1.1. Efficiency Definitions and Figures of Merit
Before discussing the results of the sensitivity analysis in the following sub‐chapters, the framework of equations used for the analysis shall be laid out first, considering the assumption made in the previous chapters. This will be done at the thermodynamic level; hence, only average and mixed out states will be regarded with a number of simplifications made for the sake of clarity
and the conceptual nature of the entire study. As far as the constant net thrust (FN) at the given mission point is concerned, contributions from the aft‐fan (AF) and the two main engines (ME) are included in the total sum as follow:
𝐹𝑁 𝐹𝑁 𝐹𝑁 𝑐𝑜𝑛𝑠𝑡. (1)
In this way, when the aft‐fan produces more thrust, the main engine contribution will be smaller. The main figure of merit that will be focused on in the following chapter is the uninstalled specific fuel consumption 𝑆𝐹𝐶
𝑆𝐹𝐶
, ∙ . (2)
Technically the term “uninstalled” is somewhat misleading since one major effect of the aft propulsor’s installation into the aircraft, which is the incoming momentum deficit resulting from the fuselage boundary layer, is inherently included in Equation (2) as it will be shown in the next paragraphs. It will be used nonetheless in order to be in line with the wording stemming from classical, under‐wing engine integration. It is reasonable as well since non‐thermodynamic effects, such as engine weight and drag are not included herein. At given flight speed 𝑣 , uninstalled SFC is driven by the overall efficiency of the system 𝜂 , consisting of both, the aft‐fan and the main
engine. This overall efficiency at the system level is a function of core efficiency (𝜂 ) of the gas generator, transmission efficiency ( 𝜂 ), propulsive efficiency ( 𝜂 ), mechanical efficiency (𝜂 ) (friction in bearings, duct and gearbox losses etc.) and the efficiency of the electrical system (𝜂 ):
𝜂 , 𝑓 𝜂 , 𝜂 , 𝜂 , 𝜂 , 𝜂 . (3)
The last two, 𝜂 and 𝜂 , were included in the performance analysis, but kept at constant values of ηmech = 0.99 and ηel = 0.95, and hence, shall not be considered further on as part of the
sensitivity (for more on the efficiency of the electrical system see Section 4.3.1. Following the definitions of both, propulsive and transmission efficiency, it is worthwhile looking at those quantities separately for the aft‐fan and the main engine, as well as at a system level, in order to better understand the trades to be made. Starting with the main gas turbine engine, the conventional definitions of the propulsive efficiency 𝜂 , transfer efficiency 𝜂 and core efficiency 𝜂 are a priori applicable and useful. The core efficiency, which per definition is the ratio of the power available after all the power requirements of the core compression processes (including power off‐take) are satisfied, 𝐸 , and the power as introduced by the fuel flow, 𝐸 ,:
𝜂 . (4)
In the same vein, the transmission efficiency 𝜂 , is defined as the quality of the power
transfer from the core stream to the bypass stream. This translates to the ratio of the change in kinetic energy of the jets in the bypass and core, Δ𝐸 , , to the useful power of the core, 𝐸 :
𝜂 , , . (5)
The propulsive efficiency is defined as the useful propulsive power over the change in jet kinetic power:
𝜂 ,
, . (6)
With the definition of the stations 18 (bypass nozzle throat) and 7 (core nozzle throat), as shown in the gas turbine schematic, and accounting for the power‐off take from the main engine core, as well as removing the system kinetic power, due to the flight velocity 𝑤 𝑣 , the transmission efficiency of the main engine can be written as:
𝜂 ,
0.5 ∙ 𝑤 𝑣 , 𝑤 𝑣 , 𝑤 𝑣
𝐸 , 𝑤 𝑣 /2 𝑃𝑊𝑋46𝜂
Here 𝐸, is the core exit potential power, and the core exit is where the fan core and LPC
power requirements are satisfied in the low‐pressure turbine (LPT) expansion. The core flow energy used for the production of PWX46 through the LPT, as well as the core stream kinetic energy 𝑤 𝑣 /2, need to be subtracted from the potential power in the main engine in order to define the transmission efficiency. The propulsive efficiency is given by: 𝜂 , 0.5 ∙ 𝑤 𝑣 𝐹𝑁 𝑣 , 𝑤 𝑣 , 𝑤 𝑣 𝑣 𝑤 𝑣 , 𝑣 𝑤 𝑣 , 𝑣 0.5 ∙ 𝑤 𝑣 , 𝑤 𝑣 , 𝑤 𝑣 , (8) and consequently, the core efficiency is defined as: 𝜂 𝐸 , 𝑤 𝑣 /2 𝑤 ∙ 𝐹𝐻𝑉 , (9)
with 𝑤 ∙ 𝐹𝐻𝑉 being the power as introduced by the fuel flow 𝐸 . Here, the core efficiency of the gas generator ηcore is kept to an approximately constant lever for all cases, due to the matching
scheme selected for the gas turbine operation, which keeps OPR, PRn and T4 constant at cruise. Nevertheless, due to a more efficient aft‐fan propulsion system, constant thrust and turbine metal temperature requirement, ηcore is improved through a reduced turbine cooling requirement.
The aft‐fan may be considered separately now following the same rationale in defining the different efficiencies, with the propulsive efficiency to be formulated with the use of the decreased incoming velocity, due to BLI 𝑣, as seen by the aft propulsor inlet, rather than the flight velocity, 𝑣 : 𝜂 , . ∙ , , , , = , / , . ∙ , , / , (10) reflecting the aft‐fan nozzle propulsive power over the kinetic power change of the flow through the aft‐fan. The transmission efficiency 𝜂 , 0.5 ∙ 𝑤 𝑣 , 𝑣 , 𝑃𝑊𝑋46/𝜂 , (11) is defined as the fraction of the enthalpy change of the core flow through the LPT (the part used for PWX46 generation) that is added to the kinetic power of the flow through the aft‐fan. In the equations, 𝑤 is the aft‐fan inlet mass flow rate, 𝑣 , is the aft‐fan nozzle ideally expanded jet
velocity, 𝑣 , is the reduced aft‐fan inlet velocity, due to BLI effect and 𝜂 is the efficiency of the
LPT. The aft‐fan mass flow rate w92 can be considered as dependent on aft‐fan FPR, PWX48 and the component efficiency:
𝑤 𝑓 𝐹𝑃𝑅 , 𝜂 , 𝑃𝑊𝑋48 , (12)
and the aft‐fan jet velocity 𝑣 is only a function of the aft‐fan FPR (and duct losses, which is assumed as a fixed value and will be discussed later): v , 𝑓 𝐹𝑃𝑅 . (13) The main objective obviously is to maximize the overall system efficiency, which in the same fashion can be split into its propulsive efficiency 𝜂 , 𝑤 𝑣 , 𝑣 , 𝑣 𝑤 𝑣 𝑣 𝑣 0.5 ∙ 𝑤 𝑣 , 𝑣 , 𝑤 𝑣 𝑣 , (14) and transfer efficiency 𝜂 , 0.5 ∙ 𝑤 𝑣 , 𝑣 , 𝑤 𝑣 𝑣 𝐸 , 𝑤 𝑣 /2 . (15)
Here 𝑣 denotes the mixed out jet velocity comprising of the cold jet 𝑣 , in the main engine
bypass and the hot jet 𝑣 , after the core nozzle exit. This mixed out velocity is mainly dependent
on the FPR of the main engine in the bypass and the jet velocity ratio VcoldQhot:
𝑣 𝑓 𝐹𝑃𝑅 , 𝑉𝑐𝑜𝑙𝑑𝑄ℎ𝑜𝑡 . (16)
In conclusion, the overall system efficiency as defined below and derived from the previous equations, essentially is a function of the velocity deficit, due to BLI 𝑣 , , both fan pressure ratios of the main engine fan and the aft propulsor, the gas turbine jet velocity ratio VcoldQhot and the power extraction or power input to the aft‐fan: 𝜂 , 𝑤 𝑣 , 𝑣 , 𝑤 𝑣 𝑣 𝑣 𝑤 ∙ 𝐹𝐻𝑉 𝑓 𝑣 , , 𝐹𝑃𝑅 , 𝐹𝑃𝑅 , 𝑉𝑐𝑜𝑙𝑑𝑄ℎ𝑜𝑡, 𝑃𝑊𝑋48 . (17) The partial derivative of the overall efficiency then can be written as: ∆𝜂 𝜕𝜂 𝜕𝑣 , ∆𝑣 , 𝜕𝜂 𝜕𝐹𝑃𝑅 ∆𝐹𝑃𝑅 𝜕𝜂 𝜕𝐹𝑃𝑅 ∆𝐹𝑃𝑅 𝜕𝜂 𝜕𝑉𝑐𝑜𝑙𝑑𝑄ℎ𝑜𝑡∆𝑉𝑐𝑜𝑙𝑑𝑄ℎ𝑜𝑡 𝜕𝜂 𝜕𝑃𝑊𝑋48∆𝑃𝑊𝑋48 . (18) The sensitivity of the entire system is a multi‐dimensional problem, and rather than running a large scale optimization, the sensitivity of individual parameters was investigated and ranked in order to support design decisions regarding the optimal power extraction, fan pressure ratio of both, aft‐fan and main engine, as well as gas turbine jet velocity ratio. In the following qualitative and quantitative investigations, all results will be shown and discussed for cruise conditions if not stated otherwise.
4.1.2. Power, Thrust Split and Aft‐Fan Inlet Momentum Deficit/BLI Impact
As highlighted at the beginning of this paper, it is almost impossible to reliably quantify the average incoming momentum deficit to the aft propulsor, defined as:
𝑣 , ∗ 𝑤 , – 𝑣 ∗ 𝑤 / 𝑣 ∗ 𝑤 , (19)
and being induced by the fuselage boundary layer. To somehow consider this uncertainty in a sensitivity study, only the corresponding average velocity deficit 𝑣, was varied at given power
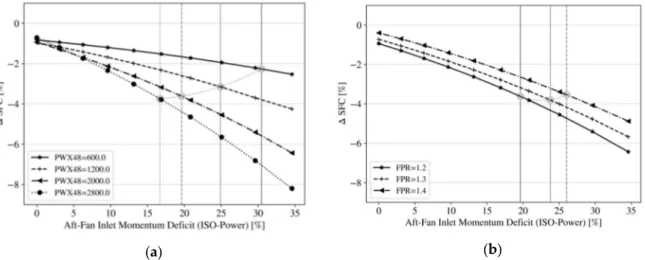
input, and hence, mass flow rate 𝑤 , 𝑤 at constant flight velocity 𝑣 . This was done regardless of the physical achievability, and solely in order to investigate its effect on uninstalled SFC. At this stage, no detailed information regarding the shape of the boundary layer was needed, and in a first approach, only a small number of power‐extraction levels and FPR were considered. The impact of this artificial variation of inlet momentum by specifying the corresponding average inlet conditions of the aft‐fan only is shown in Figure 8a at different levels of power extraction PWX48 at constant FPR, and in Figure 8b for different aft‐fan pressure ratios at constant PWX48:
(a)
(b)
Figure 8. Sensitivity of the specific fuel consumption (SFC, uninstalled) on incoming momentum deficit at different levels of power extraction PWX48 at constant fan pressure ratio FPR = 1.2 (a) and different aft‐fan pressure ratio levels at PWX48 = 2000 kW (b)—The vertical lines denote the theoretically captured momentum deficit based on flat‐plate assumptions; the light grey markers indicate the respective intersection with the PWX (a) or FPR (b) sensitivity lines and are considered achievable configurations.
The offset at zero momentum deficit, reflecting a better performance of all cases with aft propulsion compared with the baseline scenario, in general stems from improved propulsive efficiency of both, the main engine fan and aft‐propulsor performance, as it will be explained later in this section. It is evident in those results that a rather high amount of power input is needed in order for the aft propulsor to substantially contribute to a reduction in SFC due to both, the BLI effect, as well as the generally higher levels of propulsive efficiency because of its lower FPR (compared with the main engine). The respective sensitivity between PWX48 and the momentum deficit is non‐linear, and at a given theoretical momentum deficit, the additional SFC benefit increases with increasing aft‐fan power. However, at given FPR, the aft‐fan grows in diameter when increasing PWX48, and hence, the amount of achievable ingested boundary layer becomes smaller and almost cancels out any additional, BLI‐related SFC benefit. In the figure, one vertical line defines the resulting inlet momentum deficit as calculated with flat‐plate BL theory and can be related to the respective PWX48 or FPR sensitivity line by the same line style. The intersection of the two lines (vertical flat plate BL momentum deficit lines and PWX48 or FPR sensitivity lines at varying inlet momentum deficit) denotes what is, under the given assumptions, considered an achievable configuration. Those intersections are highlighted by the light grey markers. It is important to notice that at constant levels of power extraction, the fan mass flow rate is nearly constant and independent of the inlet momentum deficit. Connecting the intersecting points yields the light grey line, which suggests that further increasing the power input to the main fan at given FPR has no further benefit for the SFC, since the beneficial impact from ingesting the boundary layer becomes smaller and smaller with increasing mass flow rate/tip diameter. Subsequently, based on those results, a choice for the amount of power extraction has been made at PWX48 = 2000 kW, and the impact of varying aft‐fan FPR has been investigated in the same fashion. Here the sensitivity of the BLI effect seems generally smaller in terms of uninstalled SFC benefit, but the results for the achievable configurations as denoted again by the light grey lines clearly suggest an optimal region of FPR at given power input. This optimal range is not driven by the aft‐fan component efficiency (which was fixed for this particular study as will be discussed later), but rather by a trade‐off between the beneficial effect of increasing the incoming momentum deficit and an overall lower level of propulsive efficiency at higher FPR. To further clarify the aforementioned observations, only the achievable configurations from both sensitivity studies are plotted together in Figure 9a. A quadratic fit, indicated by the light grey lines, was chosen to anticipate the behavior in between the calculated points, which is merely being used to illustrate the different characteristics of the two sensitivities
(constant power extraction vs. constant FPR) rather than deriving an—at this point—still unknown optimum and detailed progression. The existence of an optimum will be derived later in this section based on refined data with more points considered, allowing to avoid any interpolation or anticipation of missing data. However, the almost asymptotic behavior of the PWX‐sensitivity towards higher values of power input at the system level can be assumed (solid black lines), as well as the range of a potential maximum SFC benefit with varying FPR (dashed lines). (a) (b) Figure 9. Achievable configurations in terms of realistic momentum deficit and respective SFC benefit with varying FPR and PWX48 (a) and transfer efficiency vs. propulsive efficiency for the same configurations (b).
Splitting the overall aft‐fan efficiency in transfer and propulsive efficiency (see Equations (10) and (11)), as shown in the right part of Figure 9b, it is possible to further explain both trends: At constant FPR and varying PWX48, the increase in jet velocity is solely driven by the incoming velocity deficit 𝑣 , in a linear fashion, and 𝑤 and PWX48 scale in the same way, hence, their
dependency is cancelled out. This leads to an almost linear dependency between transfer and propulsive efficiency. On the other hand, when varying the FPR at a given level of PWX48, the jet velocity of the aft‐fan is not only driven by the incoming and BLI‐related velocity deficit, but also by the FPR, which increases the jet velocity at higher FPR. At given and constant relative duct losses
dPqP, increasing the FPR leads to an increase of the effective component efficiency [23]. As shown
and discussed in the given reference, an increased FPR reduces the relative impact of dPqP on nozzle total pressure, and hence, increases the ideal velocity 𝑣 , . Looking into the definition of the
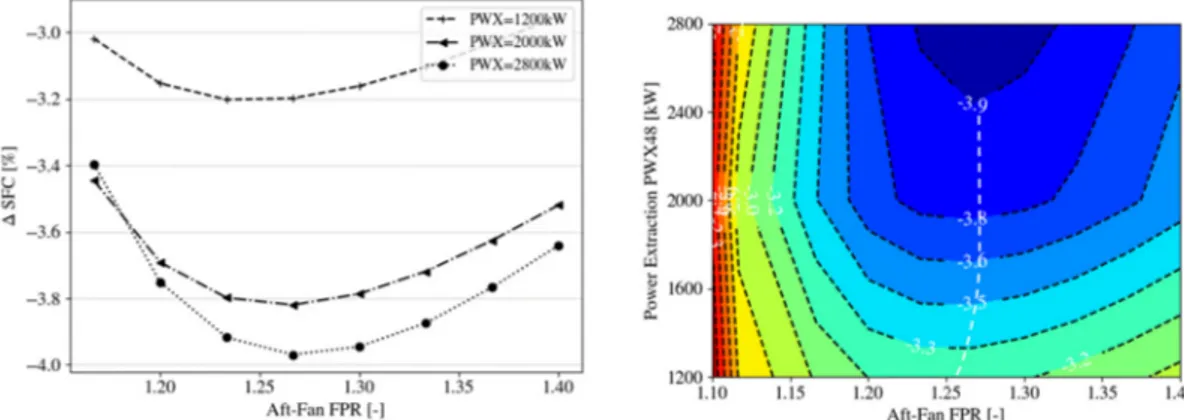
transfer efficiency (15), this directly translates into higher levels of transfer efficiency with increasing FPR. As a result, one can observe a non‐linear behavior of the aft‐fans’s transfer and propulsive efficiency with a presumed optimal overall efficiency, and hence, lowest ΔSFC in the region of FPR ≈ 1.3, yielding the best compromise between an increased transfer efficiency at higher jet velocity levels and retaining high levels of propulsive efficiency for both, aft‐fan and the main engine. In order to better quantify the optimal FPR for a maximal benefit in terms of uninstalled SFC, a refined sensitivity study was carried out subsequently for three different power extractions and a variety of FPR, and the results are shown in Figure 10. The dependency of the inlet momentum deficit here was removed by only considering achievable configurations and applying the corresponding momentum deficit for each point individually. The results suggest an optimal value of approximately FPR ≈ 1.27 for both cases PWX48 = 2000 kW and PWX48 = 2800 kW, and, as discussed before, a shift of the optimal FPR towards smaller values at lower levels of power as indicated by the white dashed lines. Again splitting up the aft‐level performance into propulsive and transfer efficiency, the aforementioned sensitivities are visualized in Figure 11 for the aft‐fan first: The transfer efficiency is almost constant at given FPR with only very minor differences in LPT efficiencies. Hence, transfer efficiency is almost independent of the levels of power‐off takes (see Equation (11)), while the propulsive efficiency is a function of both, power off‐take and FPR (Equation (10)) reaching its maximum towards lowest values of FPR and power off‐takes with
highest values at low FPR. Here it is interesting to note that the propulsive efficiency at constant FPR decreases with increased power inputs PWX48, which is directly associated with a decreasing BLI benefit, due to the aft‐fan’s larger dimensions.
Figure 12 shows the same results for the main engine. The trend for the transfer efficiency (Equation (7)) is exactly the opposite as for the aft‐fan and shows a dependency mainly on the level of power off‐take and only a very small dependence on aft‐fan FPR, due to minor changes in core efficiency levels and a different and BLI‐dependent thrust split. The sensitivity with power off‐take, however, is rather small with a difference of 1.3% between the minimum and maximum level of PWX48, due to almost identical levels of gas turbine core efficiency at all levels of PWX48. The propulsive efficiency yields the opposite trend, here high power off‐takes results in higher levels of propulsive efficiency, due to higher thrust contributions from the aft‐fan, resulting in a lower FPR of the main engine, and as a consequence, higher levels of propulsive efficiency. Again, the range of variation is relatively small with a 1.9% maximal difference between highest and lowest propulsive efficiency and in general, a gain in propulsive efficiency is traded for a decrease in transfer efficiency in almost the same manner. The results also suggest a very low overall dependence on aft‐fan FPR and the dominant quantity defining the main engine performance is the power off‐take; the power off‐take itself is enabled at constant gas turbine core efficiency levels, OPR, T4 and pressure ratio split PRn by adjusting the core mass flow rate, compressors pressure ratios, and pressure drop over the LPT. The coupling with the bypass flow at given inlet mass flow rate 𝑤 is then achieved by varying the bypass ratio, as well as the main engine fan pressure ratio to meet overall thrust requirements at the given jet velocity ratio. At the system level, all of the aforementioned trends yield the results, as shown in Figure 13: Both, transfer (Equation (15)) and propulsive efficiencies (Equation (14)) have almost opposite trends, with higher levels for the propulsive efficiency at increasing levels of power off‐take and only a small remaining dependency from aft‐fan FPR and a similar, but opposite trend for the transfer efficiency: Here the highest levels were observed at higher values of aft‐fan FPR and towards low power off‐takes. The resulting products of transfer and propulsive efficiencies of the aft‐propulsor (a), the main engine (b) and the system (resulting from a mass flow weighed combination of both, aft‐fan and main engine, (c)) are finally shown in the respective diagrams of Figure 14 (see also Equations (6), (11) and (15)). Here it can be seen again how beyond a certain (aft‐fan FPR‐dependent) level of power‐extraction there is almost no additional SFC benefit (c) due to opposite sensitivities of aft‐fan (a) and main engine (b) propulsive efficiency and a diminishing additional BLI benefit towards increasing aft‐fan dimensions. Moreover, the effect of the main engine seems of lower importance, since the levels of overall efficiency are very close to each other, with a maximum difference of approximately 0.6% and maximum values at highest aft‐fan power off‐takes, and hence, lowest main engine FPR. The overall system efficiency, and hence, SFC benefit is mostly driven by the aft‐fan, of which a significant thrust contribution is needed to translate into an overall SFC benefit.
Figure 10. Uninstalled SFC benefit for all achievable configurations with varying aft‐fan FPR (left) and power off‐take PWX48 vs. aft‐fan pressure ratio with contours color coding the relative SFC (right).
(a) (b)
Figure 11. Contours of aft‐fan transfer efficiency (a) and propulsive efficiency (b) as a function of power extraction PWX48 and fan pressure ratio FPR. (a) (b) Figure 12. Contours of the main engine transfer efficiency (a) and propulsive efficiency (b) as a function of power extraction PWX48 and aft‐fan pressure ratio FPR. (a) (b) Figure 13. Contours of the system transfer efficiency (a) and propulsive efficiency (b) as a function of power extraction PWX48 and aft‐fan pressure ratio FPR.
(a) (b) (c)
Figure 14. Contours of the product of transfer efficiency and propulsive efficiency as a function of power extraction PWX48 and aft‐fan pressure ratio FPR for the aft‐fan (a), the main engine (b) and the system (c).
4.1.3. Gas Turbine and Aft‐Propulsor Jet Velocity Ratio Impact
The results discussed in the previous chapter were all obtained for fixed values of the gas turbine jet velocity ratio VcoldQhot, and in this chapter, its impact shall be discussed. In general, the jet velocity ratio can be considered for the gas turbine and the aft‐fan separately, as well as at a system level, and its choice has a direct impact on the overall efficiency (see Section 4.1). In a subsequent sensitivity study, the respective jet velocity ratio was varied within a range of [0.7 … 1.1], and the performance was evaluated for four selected cases (indicated by the markers in the previous section: [FPR = 1.2, PWX48 = 1200 kW], [FPR = 1.2, PWX48 = 2800 kW], [FPR = 1.3, PWX48 = 2000 kW], and [FPR = 1.4, PWX48 = 2000 kW]) with the achievable momentum deficit of the respective configuration being imposed; the corresponding results are shown in Figure 15. One of the main conclusions from Figure 15a is that the gas turbine jet velocity ratio optimization (location of the uninstalled SFC‐benefit maximum) seems not to be influenced by the level of the aft‐fan power off‐take and aft‐fan FPR; as a consequence, one can keep the BPR optimization for the bypass side as per traditional conceptual design practice. Based strictly on the cycle design, the optimum SFC occurs at a velocity ratio of about 0.925, but considering system level design aspects, such as mission‐based block fuel rather than SFC, an optimum value of velocity ratio would be expected to be lower than this and closer to 0.9. The details of this system level design trade‐off are beyond the scope of this work, but details can be found in reference [6], including the rationale as to why slightly moving away from the optimum towards lower values is more favorouble when also considering mission‐based block fuel; for further analysis herein a value of VcoldQhot = 0.9 was chosen. The results also suggest that the system jet velocity ratio is influenced by choice of aft‐fan FPR, but not by the amount of power transferred to it, and the relation between system and gas turbine jet velocity ratio is linear in nature (Figure 15b).
(a)
(b)
Figure 15. Dependence of the specific fuel consumption (SFC, uninstalled) on the gas turbine jet velocity ratio for different scenarios (a) and jet velocity ratio of the main engine vs. system jet velocity ratio for the same selected cases (b).
To complement those results, a similar study was carried out by varying inlet momentum deficit for three different levels of aft‐fan FPR (here only aft‐fan FPR was varied, because the system jet velocity ratio was independent of power extraction as highlighted already); the results are shown in Figure 16 with the achievable configurations again denoted by the colored markers.
(a) (b) (c)
Figure 16. Sensitivity of the specific fuel consumption (SFC, uninstalled) on incoming momentum deficit and fan pressure ratio FPR at constant PWX48 = 2000 kW for different gas turbine jet velocity ratios—Results for VcoldQhot = 0.9 (a), VcoldQhot = 0.8 (b) and
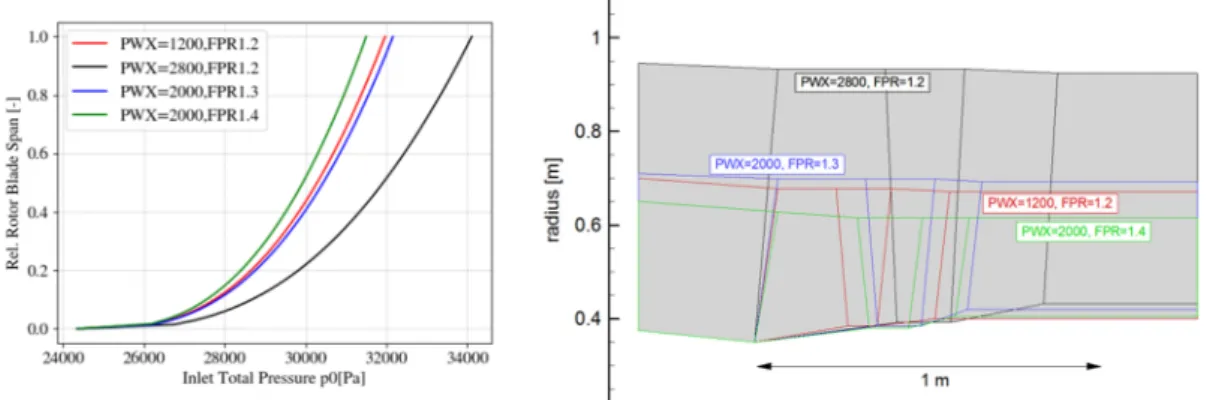
VcoldQhot = 0.7 (c). 4.2. Cases Downselection Based on the sensitivity study discussed in the previous chapter, four cases were downselected in order to allow for the conceptual design of the aft propulsor and discuss the resulting component performance and design implications. Those cases comprise two different power extraction levels at constant FPR and two different aft‐fan pressure ratios at a constant level of power extraction: FPR = 1.2 and PWX48 = 1200 kW, FPR = 1.2 and PWX48 = 2800 kW, FPR = 1.3 and PWX48 = 2000 kW and FPR = 1.4 and PWX48 = 2000 kW.
The cases were chosen because they all had comparable (uninstalled) SFC benefits, but were expected to lead to substantially different designs of the aft‐fan.
4.2.1. Choice of Main Gas Turbine Cycle and Resulting Engine Performance
Before discussing the design of the aft‐fan in the next chapter, the resulting performance of the main engine shall be summarized for all four cases. One assumption, the consequences of which were not discussed yet in detail, was that the main engine was operated at constant mass flow rate
w2. With increasing thrust contribution from the aft‐fan, the thrust requirement of the main engine was reduced, allowing for a lower FPR of the main engine fan and corresponding operation at higher levels of propulsive efficiency (and compromised transmission efficiency). The values for all four cases in direct comparison with the baseline engine are shown in Figure 17 at Cruise conditions. One example underlining the constant gas generator performance for all cases is shown in Figure 18, yielding almost identical levels of core efficiency, as well as High‐Pressure Compressor (HPC) and LPC component efficiencies (minor differences stem from the fact that the design point of the engine was Top‐of‐Climb, and the shown results at Cruise condition, hence, are at off‐design). This was achieved by the application of the multi‐point synthesis matching scheme. All in all, this resulted in a more or less SFC neutral operation of the main engine and the SFC benefits at a system level stem almost exclusively from the aft‐propulsor as discussed in the previous Section 4.1.1. (a) (b)
Figure 17. Main engine fan pressure ratio (a) and resulting thrust contribution from the aft‐fan in relation to the overall thrust (b) for downselected cases at Cruise conditions. NB: The thrust ratio of the reference case is technically zero, and hence, not included in plot (b). (a) (b) Figure 18. Gas generator core efficiency (a) as well as LPC and HPC component efficiencies (b) at cruise conditions for all downselected cases. 4.2.2. Aft‐Propulsor Design Rationale and Top‐Level Design Parameters for Downselected Cases The main assumptions for the aft‐fan conceptual design, which were equally applied to all cases (BLI and non‐BLI) at design conditions, are as follows:
![Table 1. Major aircraft mission and performance parameters, as well as thrust requirements (per engine) for the mission points considered [6].](https://thumb-eu.123doks.com/thumbv2/5dokorg/4874329.133102/4.892.129.542.437.608/table-aircraft-mission-performance-parameters-requirements-mission-considered.webp)

![Figure 4. Computational grid and station definition as input parameters to the streamline‐curvature method ACDC (Advanced Compressor Design Code [20,21]) used for the aft‐propulsor conceptual design.](https://thumb-eu.123doks.com/thumbv2/5dokorg/4874329.133102/8.892.274.617.175.366/computational-definition-parameters-streamline-curvature-compressor-propulsor-conceptual.webp)