AN EVALUATION OF TRAFFIC CONTROL DEVICES AND DRIVER
DISTRACTION ON DRIVER BEHAVIOR AT RAILWAY-HIGHWAY
GRADE CROSSINGS
Radhameris A. GómezDepartment of Civil and Environmental Engineering, Human Performance Laboratory University of Massachusetts Amherst
139 Marston Hall, 130 Natural Resources Road, Amherst, MA 01002, USA Phone: + 1 661-724-6639 E-mail: radha.gomez@gmail.com
Co-authors(s); Michael Knodler, Department of Civil and Environmental Engineering, University of Massachusetts Amherst; Donald L. Fisher, Department of Mechanical and Industrial Engineering, University of Massachusetts Amherst.
ABSTRACT
The U.S. railroad system is made up of over 700 railroads operating on 140,000 miles of track, with more than 130,000 at-grade public railway-highway crossings, or intersections in which any part of a roadway intersects with railroad tracks. Safety at these railroad-highway grade crossings and the related traffic control devices used to communicate with drivers is of major concern.
There are three factors that influence a driver’s behavior at a given crossing. First, traffic control devices, including warning devices at the railway-highway at-grade crossings, provide the driver with information. Second, assuming that the driver identifies the warning, the driver’s prior knowledge influences his or her expectancy regarding various railroad-highway grade crossing situations and, therefore, the way in which the driver responds to the hazard presented by the crossing. Finally, the driver’s own physiological (e.g., impaired) and psychological (e.g., distracted) state will modify the role that conspicuity and expectancy have on the driver’s behavior
In order to address the gap that exists in our understanding of driver distraction at railway-highway at-grade crossings, two driving simulator experiments were conducted to determine the role that distraction has on the effectiveness of warning devices at grade crossings. In the first experiment, the role of distraction in reducing the benefit of typical crossbucks and flashing lights is evaluated. Participants were either engaged or not engaged in a distracting task, which included either a mock cell phone conversation or an in-vehicle task. Based upon the fact that distractions reduce the advantage of flashing lights and crossbucks, an evaluation of an alternative treatment that might be used to warn drivers of an approaching train was conducted. The question being addressed is whether these alternative markings, known as dynamic envelope pavement markings are an effective application for mitigating the effects of driver distraction at at-grade railway-highway grade crossings. Initial findings point to the fact that even when flashing lights and its respective signage and markings are properly working, a distracted driver is more likely to ignore the cues.
1.
INTRODUCTION
Safety on our nation’s railroads continues to be a prevailing concern, particularly as it relates to safety at railway-highway grade crossings. Railway-highway grade crossings (herein referred to as grade crossings) are those intersections in which any part of a roadway intersects with railroad tracks at the same level or grade. The Traffic Control Device (TCD) found at the crossing dictates its classification; if the crossing configuration includes flashing lights and other dynamic components which are triggered by the presence of a train, the crossing is considered to be “active” (5)(15). On the other hand, if the crossing is only controlled by signage that is always present at the crossing such as the crossbuck (Figure 1) and its associated pavement markings and advance warning sign (Figure 2), then the crossing is considered to be “passive.”
While it is recognized that the safest way to accommodate vehicles and trains is by grade separation, these separations are costly and not always feasible, therefore, this study aims to shed light on the current state of the rail system which is dominated by grade crossings (7).
The effectiveness of warning devices on driver behavior at grade crossings has been studied extensively (10)(3)(12). This research draws primarily from two important studies conducted in the area of grade crossings and human factors. One of the most comprehensive studies of its kind, by Caird et al., (3) analyzed over 300 grade crossing accidents in Canada. The study identified unsafe acts, passive signs and markings, and active warning systems, among others, as the primary categories of accident contributors. To address accident contributors at passive crossings, the authors and previous research (13)(18) support that upgrading crossings from passive to active by adding flashing lights, has
the potential of reducing accidents by 64 percent over crossbucks alone. What the study doesn’t address is whether driver compliance will be significantly higher once these upgrades are completed, particularly when drivers are distracted.
The second relevant study in this area, conducted by Lenné et al., (12) used a driving simulator to examine driver behavior at three grade crossings: the first crossing was stop-controlled, the second crossing was equipped with flashing lights and the third crossing was regulated by a traffic signal at the crossing. The study measured the driver’s mean vehicle speed on approach at the grade crossing; if the speed on approach was less than 10km/h (~6mph) then the driver was scored as compliant. The authors report that in a sample of 25 participants, 17 of those drivers were non-compliant with 10 of these drivers not reaching a full stop at the stop-controlled crossing, and 6 of the remaining drivers, ignoring the traffic light. Although stop-controlled grade crossings are not common practice in the U.S., traffic signals and flashing red lights are frequently found in the vicinity of grade crossings. What is not known from these two studies, is whether the effectiveness of these warning devices holds under conditions in which the driver is distracted – an increasing problem in our global roadways (14).
With the average U.S. household owning five electronic devices connected to the internet via Wi-Fi, wired or cellular networks (2), it is no surprise that one of the most dangerous driver behavior is the spreading epidemic of distracted driving. The most recent statistics show that more than 600 million passenger cars and 4.6 billion cell phone subscriptions worldwide (14).The increasing intrusion of
Figure1:Crossbuck (MUTCD,2009 R15-1)
Figure2: Advance Warning Sign (MUTCD,2009 W10-1)
mobile devices in the driving environment coupled with the amount increasing amount of time drivers who send and receive text messages take their eyes off the road (14), makes this issue a pressing one that must be readily addressed.
The goal of this study is two-fold; first, it’s urgent to identify the role that distraction plays on drivers’ attention while approaching a grade crossing and second, assuming that distraction is an issue, it is crucial to evaluate alternative treatments to reduce distractions in and around grade crossings.
2.
METHODOLOGY
2.1. Participants
A total of 72 participants are enrolled in Experiment 1. Research subjects are distributed in two main age groups: 19-25 and 30-65 years old; balancing for gender, participants are randomly assigned to one of two groups in which participants will be either be: performing a mock cell phone task, or performing an in-vehicle task; participants serve as their own control group during half of the drive by only performing the driving task itself while navigating the virtual environment. The same number of participants and age group have been assigned to experiment 2. All participants receive a practice drive, an Informed Consent form , a demographic questionnaire which collects participant’s driving history, age and gender and a Simulator Sickness Questionnaire (SSQ) (11).
2.2. Stimuli
The first experiment evaluates driver behavior at grade crossings equipped with signage and pavement markings found in active, non-gated crossings (Figure 3). Participants are exposed to flashing lights, crossbuck and its associated pavement markings. Signage and pavement markings follow sizing and placement guidelines as set forth in the 2009 Edition of the Manual on Uniform Traffic Control Devices (MUTCD).
For the second experiment, participants navigate crossings which have been
enhanced with the dynamic envelope markings, (Figure 4) in addition to the crossbuck and flashing lights. The dynamic envelope markings are painted on the region
between and immediately adjacent to the tracks at a grade crossing, along with corresponding signage on the side of the road (19)(6). Like advance yield markings found at non-signalized midblock crosswalks (21)(8), these markings provide the driver with an additional level of warning as they approach a grade crossing and are both inexpensive to install and easy to maintain. The question is whether these markings are as effective for applications on grade crossings when the driver is distracted.
2.3. Secondary Tasks
Participants are randomly assigned to undertake one of two distracting tasks: either a a cell phone conversation or an in-vehicle task. For the mock cell phone conversation, there are 50 sentences scripted into each drive; the format of these sentenses is a modified version of the Baddeley Reasoning Test (1). During this task, participants hear a 5-word sentence every 10 seconds and at the conclusion of each sentence, the participant will then be asked to recall the subject, and object in each sentence, and state whether the sentence made logical sense, by answering yes or no.
Figure 3:Signage for Experiment 1
Figure 4: Dynamic Envelope Markings (43)
The in-vehicle task requires that the participant interacts with a Global Positioning System (GPS) device. The driver is asked to determine whether s/he is on a particular road or approaching a particular intersection by referencing the GPS. For example, the driver may hear: “Are you on a road which leads to the intersection with Maple St.?” The GPS allows for the map to be changed every time a question is asked because at certain times while driving it is the case that a driver needs to constantly refer to the GPS for route information.
2.4. Description of Simulator Drives
2.4.1. Driving Simulator
The simulator drives have been developed using a cutting edge rail package developed by Real Time Technologies (RTI). At the time of writing this document, this is the first research of its kind to be performed in the U.S., relating traffic control devices at grade crossings and driver behavior. The virtual world is projected with a refresh rate of 60 Hz and a resolution of 1400 by 1050. Three screens allow 150 degrees of vision in the horizontal direction and 30
degrees in the vertical direction. Two side view mirrors and one rear-view mirror are projected on the three screens. Participants drive a fixed-base simulator (Figure 5). The simulator also employs a surround sound audio system. This system provides realistic wind, road and other vehicle noises with appropriate direction, intensity and Doppler Shift. The driving simulator provides the advantage of placing the driver is situations that are too dangerous for the open road.
2.4.2. Mobile Eye Tracker
A portable lightweight mobile eye tracker shown in Figure 6 is used to collect the eye-movement data for each driver. Previous research (4)(15) has shown that the use of an eye tracker can provide information about where a driver is looking that can be helpful to road safety professionals in improving traffic control devices. The eye tracker provides a record of the driver’s point of gaze on the driving scene while in the simulator.
2.5. Scenarios
2.5.1. Scenarios of Interest
Participants navigate a virtual environment at 40mph (30kph) with eight grade crossings, three of which are of interest:
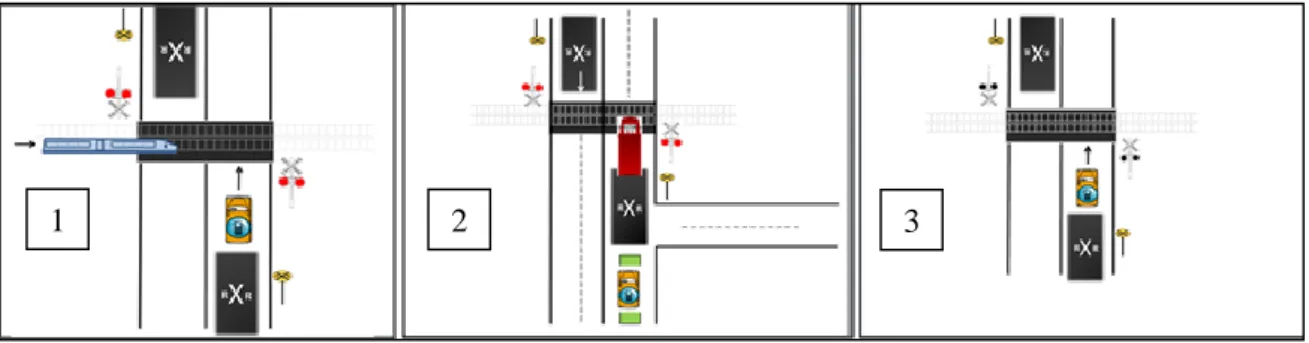
Figure 7: Scenarios of interest: 1) Lights flashing, train crossing, participant cognitively loaded 2)Vehicle ahead, lights flashing, participant cognitively loaded 3) Lights off, no vehicle ahead, participant cognitively loaded
Figure 5: Driving Simulator
Figure 6: ASL Eye Tracker
The three main scenarios of interest collect driver stopping behavior from the crossing, as well as eye movement. In the first scenario, participants see the lights flash, and a train begins to cross. It is expected that participants who are cognitively loaded will have a delayed breaking response and a shorter stopping distance from the crossing. These expectations are supported in previous research by Strayer and Johnston (20) which found that participants engaged in cell phone conversations during a tracking task were more likely to react more slowly when they encountered a traffic signal or to miss traffic signals entirely. These effects were similar for both hand held and hands-free phone configurations.
During the second scenario, the participant encounters a lead vehicle represented by a truck. The truck has been selected as the lead because larger vehicles obscure parts of the driving environment for drivers following closely behind. In this scenario, the truck goes over the grade crossing, and due to its size, obscures the flashing lights from the participant driver. As the participant driver attempts to follow the truck over the crossing, the flashing lights turn on and a train crosses soon thereafter. It is expected that because the participant is distracted and focused on the vehicle ahead, s/he will miss the cues to look at the side of the road where the flashing lights are located, detecting the lights at the very last second before the train crosses and potentially crashing. In fact, a simulator study on the effects of in-vehicle distraction reported that the 22 percent of the longest in-vehicle glances while the driver performed a secondary task accounted for about 86 percent of the observed crashes (9). Therefore; it is a reasonable expectation that the participant driver will crash more often when distracted.
The last scenario of interest requires the cognitively loaded driver to cross over a crossing in which lights are off, no lead vehicle is ahead, and no train is crossing. If the TCD’s are commanding the attention needed to communicate with the driver, then hypothetically, the driver will gaze at the lights and the advance warning signs, even though a train is not present. This information is important to quantify because crossbucks and advance warning signs are the minimum standards requirements for grade crossings in the U.S (6). More importantly, when flashing lights are not operating properly, these devices should be able to communicate to the driver of the presence of a crossing, and the potential of a train actually crossing. It is expected that because the driver is distracted, s/he will be less likely to look at the lights, and the location where a train could potentially materialize. For experiment 2, participants will drive over the same crossings which will be marked with the dynamic envelope markings previously described.
3.
DISCUSSION & NEXT STEPS
Previous research has identified the safety related benefits of treatments for marking railroad grade crossing safer; however little of this research has been rooted in human factors practice to include critical elements of driver behaviors (e.g., glance duration, speed selection, etc.). Similarly, the area of research surrounding driver distraction is relatively mature; however none of the existing research has focused on the application of driver distraction as it relates to rail grade crossing treatments. Given the documented increases in the levels of distraction, it is important to determine whether our current treatments for rail grade crossing are adequate and, if not, what alternative treatments might work better. The research proposed herein will provide the first real evidence of impact of driver distraction on behavior at rail grade crossings. In turn, the research findings will lead to a series of recommendations for improved practice of marking rail grade crossing treatments. The next steps in this study is to complete data collection and analysis which are currently underway.
4.
REFERENCES
1. Baddeley A. D. A 3-minute reasoning test based on grammatical transformations. Psychological Science Vol. 10, 1968, pp.341-342.
2. Bloomberg News. Average Household Has 5 Connected Devices, While Some Have 15-Plus.
http://go.bloomberg.com/tech-blog/2012-08-29-average-household-has-5-connected-devices-while-some-have-15-plus/ Last Accessed: May 5th, 2014
3. Caird, J.K., Creaser, J.I., Edwards, C.J., and Dewar, R.E. (2002). A Human Factors
Analysis of Railroad-highway Grade Crossing Accidents in Canada (TP 13938E). Transport Canada
4. Chan, E., Pradhan, A. K., Knodler, M. A, Pollatsek, A. and Fisher, D. L. "Empirical Evaluation on a Driving Simulator of the Effect of Distractions Inside and Outside the Vehicle on Drivers’ Eye Behaviors." Proceedings of the 87th Transportation Research Board Annual Meeting CD-ROM,TRB. Washington, D.C.: National Research Council, 2008.
5. Federal Railroad Administration U.S. Department of Transportation Railroad-highway Grade Crossing and Trespassing Prevention, http://www.fra.dot.gov/Page/P0040 Last Accessed: October 30th, 2013
6. Federal Highway Administration (FHWA), U.S. Department of Transportation (2009). Manual of Uniform Traffic Control Devices (MUTCD). 2009 Edition.
7. Federal Highway Administration (FHWA) U.S. Department of Transportation (2009). Facts
and Statistics http://safety.fhwa.dot.gov/xings/xing_facts.cfm Last Accessed: October 30th,
2013
8. Gómez,R.A.,Samuel,S.,Gerardino L.R.,Romoser, R.E.M.,Collura, J.,Knodler M.,Fisher, D.L. Do Advance Yield Markings Increase Safe Driver Behaviors at Unsignalized,Marked Midblock Crosswalks?: Driving Simulator Study. In Transportation Research Record: Journal of the Transportation Research Board , No.2264,TRB, National Academies, Washington,D.C. 2011, pp.27-33.
9. Horrey, W. J. and Wickens, C. D. "In-Vehicle Glance Duration Distributions, Tails, and Model of Crash Risk ." Transportation Research Record (Transportation Research Board of the National Academies) 2018 (2007): 22–28.
10. Horton, S., Carroll, A., Chaudhary, M.,Ngamdung,T.,Mozenter, J., (2006). Success Factors in the Reduction of Railroad-highway Grade Crossing Incidents from 1994 to 2003
(Report No. FRA/ORD-09/05) Cambridge, Massachusetts: U.S. Department of Transportation, Transportation Systems Center.
11. Kennedy, R.S.,LaneN.E.,Berbaum K.S., and Lilienthal M.G., Simulator sickness
questionnaire: an enhanced method for quantifying simulator sickness. International Journal of Aviation Psychology, 3(3):203-220, 1993
12. Lenné, M.G.,Rudin-Brown, C.M.,Navarro,J., “Driver Behavior at Rail Level Crossings: Responses to Flashing Lights, Traffic Signals and Stop Signs” Applied Ergonomics 42 (2011) 548-5544.
13. Morrissey, J. (1980). The effectiveness of flashing lights and flashing lights with gates
inreducing accident frequency at public rail-highway crossings (Rep. No. FRA-RRS-80-005). Waltham, MA: Input Output Services.
14. National Highway Traffic Safety Administration. U.S. Department of Transportation (2009).Distracted Driving Global Factsheet.
http://usdotblog.typepad.com/files/6983_distracteddrivingfs_5-17_v2.pdf Last Accessed:
November30th, 2015.
15. Ogden, B., for the Federal Highway Administration (FHWA) Railroad-Highway Grade Crossing Handbook – Revised Second Edition 2007
16. Operation Lifesaver, Inc. (OLI, http://www.oli.org), the national, nonprofit railroad safety education organization. Operation Lifesaver Says Distracted Driving a Factor in Railroad Crossing Crashes WASHINGTON, DC, September 28, 2009 - Accessed 2/19/2013 17. Pradhan, A. K., Hammel, K. R., DeRamus, R., Pollatsek, A., Noyce, D. A. and Fisher, D.L.
"Using Eye Movements To Evaluate Effects of Driver Age on Risk Perception in a Driving Simulator." Human FactorsHuman Factors: The Journal of the Human Factors and Ergonomics Society 47 (2005): 840-852.
18. Schulte, W. R. (1975). Effectiveness of automatic warning devices in reducing accidents at grade crossings. Transportation Research Record 611, 49–57.
19. State of Florida Department of Transportation. FDOT Testing New Pavement Markings that may Make RR Crossings Safer. Press Release. December 13, 2012
20. Strayer, D. L. and Johnston, W. A. (2001). Driven to distraction: Dual-task studies of simulated driving and conversing on a cellular telephone. Psychological Science, 12, 462-466.)
21. Van Houten, R.,J.E.L. Malenfant, and D.McCusker. Advance Yield Markings: Reducing Motor Vehicle-Pedestrian Conflicts at Multilane Crosswalks with Uncontrolled Approach. In Transportation Research Record: Journal of the Transportation Research Board, No. 1773, TRB, National Research Council, Washington, D.C. 2001, pp.69-74