Sustainable Development of Society and Technology
Structure and Fire Second cycle 30 hp
Master of Civil Engineering and Urban
Tutor: Haukur Ingason Examiner: Veronica Ribé
Principal: Maria Kumm, METRO project Date: 2012-07-02
STRUCTURES IN UNDERGROUND
FACILITIES
Analysis of a Concrete Column’s Capacity to Withstand Extraordinary Fire
Loads
ANNA ANDERSSON
EVA-SARA CARLSON
MASTER’S THESIS 30 hp
Structures in Underground Facilities
Analysis of a Concrete Column’s Capability to Withstand
Extraordinary Fire Loads
A Master’s Thesis at Mälardalen University Sweden made within the METRO project
Västerås, 2012-07-02 Performed by
Anna Andersson Eva-Sara Carlson
Structures in Underground Facilities
– Analysis of a Concrete Column’s Capability to Withstand Extraordinary Fire Loads
Konstruktioner i undermarksanläggningar
– Analys av en betongpelares förmåga att motstå extraordinär belastning vid brand
Anna Andersson Eva-Sara Carlson
Number of pages: 39
Illustrations: Anna Andersson
Keywords
Tunnel + Fire, Underground Facilities + Fire, Metro + Fire, Subway + Fire, Eurocodes, Train + Fire Load, Concrete + Fire, Steel + Fire
Sökord
Tunnel + Brand, Undermarksanläggningar + Brand, Tunnelbana + Brand, Eurokoder, Tåg + Brandbelastning Betong + Brand, Stål + Brand
Abstract
The report present a Master of Science in engineering work carried out at Mälardalen’s University, made this work within the research project METRO. The work is a part of the research project METRO. The focus of the METRO project is on the protection of underground rail mass transport systems e.g. tunnels and subways stations. The aim with this work was to determine if a concrete column placed close to the tracks at a subway station can withstand the effect and temperature of a fire in a burning train comparable to the effects and temperatures that showed at the full scale test carried out within the METRO project. A literature review was made previous to the following case study. The results from this show that the column is negligible affected by the fire.
School of Sustainable Development of Society and Technology
Mälardalen University Sweden P.O. Box 883
SE-721 23 Västerås Sweden
Akademin för hållbar samhälls- och teknikutveckling
Mälardalens Högskola Box 883 721 23 Västerås
Preface
This report is a product of our master’s thesis written at Mälardalens University for a degree in
Master Civil Engineering and Urban Development. The work was performed within the research
project METRO, which is a project in fire protection in underground mass transport systems. The work in METRO is divided into different work packages (WPs), and this work is included in WP 5 – Extraordinary Strain on Constructions.
Thank you to…
… Mia Kumm, for taking us up as your personal challenge! You have encouraged us in difficulties, found opportunities when we have only seen problems, guided us on the right track when we got lost and made sure that we finally finished this master thesis.
… Joakim Sandström, for the continuous support with our calculations and for taking time to run the FEM-analyze – twice!
… Jörgen Thor, for guidance in the numerical calculations.
… Anders Lönnermark, for the input data you helped us dig out and for genuine commitment to the problems we encountered.
… Klas Gidlöv, for the nights you stayed up and struggled with encoding our computer programs for calculating thermal conductivity within structures. If it were not for you we would still sit on the floor in your workshop and interpolate erfc “x”-values. Thank you!
… Jens Lind, for taking such good care of us at our site visit at Stockholm underground.
… Jenny Söderström, for taking time and joining us to solve our mathematical problems we came across along the way.
… Gero Meyer, for spending hours reading through and correcting the mistakes we made in the first version of this report. Without you it would not have been as good!
Thank you to everyone else who made this work possible! Anna Anderson and Eva-Sara Carlson
Summary
More and more road and rail tunnels are in construction as the cities are growing. Tunnels need a special treatment in fire protection since the risks and consequences are far greater than with fires above ground. In a tunnel fire the fire gases cool down and fill up the entire tunnel cross section, which complicates the evacuation and rescue operations.
Within this work the following problem formulation was set.
How much impact has the fire effect and the temperature from a burning train on the carrying structures in a subway system? How does a concrete column at a subway platform located near the tracks stand against the fire load from a burning train burning with a similar effect and the same temperature as in the test carried out within the METRO project?
In order to limit the scope of this study the calculations were made for only one column at Hötorget’s subway station. The fire scenario that has been used is a scenario corresponding to the METRO fire, test 3.
The methods used within this work are a literature review and a case study. The literature review formed the basis of the case study.
The METRO project included four full scale tests. In the third test a carriage of the train type X1 was rebuilt to simulate a train type C20. Luggage was placed inside of the carriage and a minor amount of burnable liquid was used for ignition.
One method to evaluate the load bearing capacity of the column after an impact of a fire is to calculate the area of the column’s cross section that reached a temperature of 500 °C or more, that area is considered to be unusable. The remaining part of the cross section is considered to have full carrying capacity. To determine where the 500 °C border was, the thermal conduction of the column was calculated. This was done analytically, numerically and by making a FEM-analyse. Of theoretical methods, the FEM-analyse is considered to give the most accurate results. This has been shown by a comparison between the handmade calculations and the FEM-analyse shows that the numerical calculations give the best results.
existing column. The column was calculated in the ultimate stage since the FEM-analyse showed that the fire had a negligible impact on the column. When calculating, it appeared that the concrete quality class had to be increased to match the exposure class. The new column, designed according to Eurocode, got a cross section of 600 x 600 mm.
Sammanfattning
Idag byggs allt mer väg- och spårtunnlar i takt med att städerna förtätas. Detta innebär en större säkerhetsrisk än att låta trafiken löpa ovan jord. En eventuell brand i en tunnel har ofta större konsekvenser än en brand ovan jord. Brandgaserna svalnar av och lägger sig över tunnels hela tvärsnitt, vilket försvårar utrymningen och räddningstjänstens insats.
I detta arbete har nedanstående problem uppmärksammats.
Hur står påverkan har brandeffekten och brandgastemperaturen från ett brinnande tåg på den bärande konstruktionen i ett tunnelbanesystem? Hur klarar sig en betongpelare placerad på perrongen nära spåret då den utsätts för tågbrand med effekt och temperatur likt de som uppmättes under METRO-projektet?
Arbetet har avgränsats genom att endast en pelare, placerad på Hötorget, har analyserats. Det enda brandscenariot som har används är ett scenario motsvarande METRO-branden, test 3. Metoderna som har använts är litteraturstudie och fallstudie. Litteraturstudien låg till grund för efterkommande fallstudie.
METRO-projektet innefattade fyra fullskaletest. I test tre byggdes ett tåg av modell X1 om för att efterlikna ett tåg av modell C20. Bagage placerades ut i vagnen och en mindre mängd brännbar vätska användes vid antändning.
Ett sätt att kontrollera pelarens kapacitet efter påverkan av brand är att beräkna hur långt in i pelarens tvärsnitt det är 500 °C. Den delen av tvärsnittet som är 500 °C eller mer anses vara obrukbar. Resterande del av tvärsnittet anses fortfarande ha full kapacitet. För att få fram vart 500 °C-gränsen låg beräknades värmeledningen in i pelaren. Detta gjordes analytiskt, numeriskt och genom en analys. Vid en jämförelse mellan handberäkningarna och FEM-analysen, visade de numeriska beräkningarna bästa resultat.
Meningen var att kontrollera en pelare likt den befintliga, byggd enligt BABS, och en pelare uppförd enligt BKR. Kontrollen innebar att pelarnas kapacitet kontrollerades efter påverkan av en brand motsvarande METRO-branden. FEM-analysen visade att branden endast hade en
Definitions and Terms
𝑐 𝑆𝑝𝑒𝑐𝑖𝑒𝑖𝑐 ℎ𝑒𝑎𝑡 𝑐𝑎𝑝𝑎𝑐𝑖𝑡𝑦 [J/kg K] 𝐷 𝐷𝑖𝑠𝑡𝑎𝑛𝑐𝑒 𝑏𝑒𝑡𝑤𝑒𝑒𝑛 𝑡ℎ𝑒 𝑒𝑖𝑒𝑒 𝑎𝑛𝑑 𝑠𝑒𝑙𝑒𝑐𝑡𝑒𝑑 𝑝𝑜𝑖𝑛𝑡 [m] ℎ 𝐻𝑒𝑎𝑡 𝑡𝑒𝑎𝑛𝑠𝑒𝑒𝑒 𝑐𝑜𝑒𝑒𝑒𝑖𝑐𝑖𝑒𝑛𝑡 [W/m2K] 𝑘 𝑇ℎ𝑒𝑒𝑚𝑎𝑙 𝑐𝑜𝑛𝑑𝑢𝑐𝑡𝑖𝑣𝑖𝑡𝑦 [W/mK] 𝐿1 𝐿𝑒𝑛𝑔𝑡ℎ 𝑜𝑒 𝑡ℎ𝑒 𝑠ℎ𝑜𝑒𝑡𝑒𝑠𝑡 𝑠𝑖𝑑𝑒 [𝑚] 𝐿2 𝐿𝑒𝑛𝑔𝑡ℎ 𝑜𝑒 𝑡ℎ𝑒 𝑙𝑜𝑛𝑔𝑒𝑠𝑡 𝑠𝑖𝑑𝑒 [𝑚] 𝜌 𝐷𝑒𝑛𝑠𝑖𝑡𝑦 [𝑘𝑔/𝑚3] 𝑞′′ 𝑀𝑎𝑥𝑖𝑚𝑢𝑚 𝑖𝑛𝑐𝑖𝑑𝑒𝑛𝑡 𝑒𝑎𝑑𝑖𝑎𝑡𝑖𝑜𝑛 [𝑘𝑊/𝑚2] 𝑇(0,𝑡) 𝑇𝑒𝑚𝑝𝑒𝑒𝑎𝑡𝑢𝑒𝑒 𝑜𝑒 𝑡ℎ𝑒 𝑚𝑎𝑡𝑒𝑒𝑖𝑎𝑙´𝑠 𝑠𝑢𝑒𝑒𝑎𝑐𝑒 𝑎𝑡 𝑎 𝑐𝑒𝑒𝑡𝑎𝑖𝑛 𝑡𝑖𝑚𝑒 , 𝑡 [𝐾] 𝑇𝑎 𝐴𝑚𝑏𝑖𝑒𝑛𝑡 𝑡𝑒𝑚𝑝𝑒𝑒𝑎𝑡𝑢𝑒𝑒 [𝐾] 𝑇𝑐 𝐶𝑜𝑛𝑐𝑒𝑒𝑡𝑒 𝑡𝑒𝑚𝑝𝑒𝑒𝑎𝑡𝑢𝑒𝑒 𝑎𝑡 𝑑𝑖𝑠𝑡𝑎𝑛𝑐𝑒 𝑥 𝑒𝑒𝑜𝑚 𝑡ℎ𝑒 𝑠𝑢𝑒𝑒𝑎𝑐𝑒 [𝐾] 𝑇𝑓 𝐹𝑙𝑎𝑚𝑒 𝑡𝑒𝑚𝑝𝑒𝑒𝑎𝑡𝑢𝑒 [𝐾] 𝑇𝑔 𝐺𝑎𝑠 𝑡𝑒𝑚𝑝𝑒𝑒𝑎𝑡𝑢𝑒 [𝐾] 𝑇𝑛 𝑇𝑒𝑚𝑝𝑒𝑒𝑎𝑡𝑢𝑒𝑒 𝑖𝑛 𝑡ℎ𝑒 𝑚𝑖𝑑𝑑𝑙𝑒 𝑜𝑒 𝑡ℎ𝑒 𝑙𝑎𝑦𝑒𝑒 𝑛 [𝐾] ∆𝑇𝑛 𝑇𝑒𝑚𝑝𝑒𝑒𝑎𝑡𝑢𝑒𝑒 𝑑𝑖𝑒𝑒𝑒𝑒𝑒𝑛𝑐𝑒 𝑜𝑒 𝑡ℎ𝑒 𝑙𝑎𝑦𝑒𝑒 𝑛 [𝐾] 𝑇𝑠 𝑇ℎ𝑒 𝑡𝑒𝑚𝑝𝑒𝑒𝑎𝑡𝑢𝑒𝑒 𝑜𝑒 𝑡ℎ𝑒 𝑠𝑡𝑎𝑛𝑑𝑎𝑒𝑑 𝑒𝑖𝑒𝑒 𝑐𝑢𝑒𝑣𝑒 [𝐾] 𝑇𝑠𝑐 𝑇ℎ𝑒 𝑡𝑒𝑚𝑝𝑒𝑒𝑎𝑡𝑢𝑒𝑒 𝑜𝑒 𝑡ℎ𝑒 𝑠𝑢𝑒𝑒𝑎𝑐𝑒 𝑜𝑒 𝑡ℎ𝑒 𝑐𝑜𝑙𝑢𝑚𝑛 [𝐾] 𝑇 𝑇𝑒𝑚𝑝𝑒𝑒𝑎𝑡𝑢𝑒𝑒 𝑎𝑡 𝑎 𝑐𝑒𝑒𝑡𝑎𝑖𝑛 𝑑𝑖𝑠𝑡𝑎𝑛𝑐𝑒 , 𝑥, 𝑎𝑡 𝑎 𝑐𝑒𝑒𝑡𝑎𝑖𝑛 𝑡𝑖𝑚𝑒, 𝑡 [𝐾]𝜀 𝑒𝑚𝑖𝑠𝑠𝑖𝑣𝑖𝑡𝑦 𝜎 𝑆𝑡𝑒𝑒𝑎𝑛 − 𝐵𝑜𝑙𝑡𝑧𝑚𝑎𝑛𝑛 𝑐𝑜𝑛𝑠𝑡𝑎𝑛𝑡 5,67 ∙ 1011 [𝑘𝑊/𝑚2𝐾4] Φ 𝑣𝑖𝑒𝑤 𝑒𝑎𝑐𝑡𝑜𝑒 𝜂𝑤 𝐹𝑢𝑛𝑐𝑡𝑖𝑜𝑛 𝑜𝑒 𝑡ℎ𝑒 𝑔𝑒𝑜𝑢𝑝 𝑡𝑖𝑚𝑒, t 𝑜𝑣𝑒𝑒 𝑡ℎ𝑒𝑒𝑚𝑎𝑙 𝑖𝑛𝑒𝑒𝑡𝑖𝑎 𝑜𝑒 𝑡ℎ𝑒 𝑐𝑜𝑛𝑐𝑒𝑒𝑡𝑒 𝜂𝑤 𝐹𝑢𝑛𝑐𝑡𝑖𝑜𝑛 𝑜𝑒 𝑡ℎ𝑒 𝐹𝑜𝑢𝑒𝑖𝑒𝑒 𝑛𝑢𝑚𝑏𝑒𝑒 𝑜𝑒 𝑡ℎ𝑒 𝑐𝑜𝑛𝑐𝑒𝑒𝑡𝑒 𝑡𝑖𝑚𝑒𝑠 𝑡ℎ𝑒 𝑒𝑖𝑒𝑒 𝑑𝑢𝑒𝑎𝑡𝑖𝑜𝑛, t 𝑜𝑣𝑒𝑒 𝑡ℎ𝑒 𝑑𝑒𝑝𝑡ℎ, x 𝑠𝑞𝑢𝑎𝑒𝑒𝑑 𝜆𝑛 𝑇ℎ𝑒𝑒𝑚𝑎𝑙 𝑐𝑜𝑛𝑑𝑢𝑐𝑡𝑖𝑣𝑖𝑡𝑦 𝑜𝑒 𝑡ℎ𝑒 𝑙𝑎𝑦𝑒𝑒 𝑛 𝑎𝑡 𝑡𝑒𝑚𝑝𝑒𝑒𝑎𝑡𝑢𝑒𝑒 𝑇 [W/mK]
Table of Contents
1. Introduction --- 1 1.1 Background --- 2 1.2 Problem Formulation --- 3 1.3 Aim --- 3 1.4 Purpose --- 3 1.5 Limitation --- 4 2. Methodology --- 5 3. Literature Review --- 7 3.1 Fires in General --- 73.2 Fire in Underground Facilities --- 10
3.3 Examples of Fire Accidents in Underground Facilities --- 13
3.4 Examples of Fire Tests made in Underground Facilities --- 15
3.4.1 EUREKA 499, 1990 – 1992 --- 15 3.4.2 METRO 2009, – 2012 --- 16 3.5 Concrete Structures --- 16 3.6 Regulations --- 17 3.6.1 Boverkets Konstruktionsregler (BKR) --- 18 3.6.2 Eurocode --- 18
4. Analysis of a Carrying Column Exposed to Fire Placed at an Underground Subway Station --- 21
4.1 Comparison between the EUREKA- and METRO test --- 21
4.2 Setup of the Scenario --- 21
4.3 Calculations --- 23
4.3.1 Analytic Calculation of Thermal Conduction --- 24
4.3.8 Designing of a new Column --- 36
4.4 Results of the Study --- 36
5. Discussion and Conclusions --- 37
6. Proposals for Future Work --- 39
References --- 41
Electronic Sources --- 42
1. Introduction
This work is a part of METRO, a Swedish research project about infrastructure protection. The focus of the project lays on the protection of underground rail mass transport systems, e.g., tunnels and subway stations, and fire as well as explosion hazards are studied.
METRO is a multidisciplinary project where researchers from different disciplines cooperate with practitioners with the common goal to make underground rail mass transport systems safer in the future. The following nine partners participate in METRO. Mälardalen University,
SP Technical Research Institute of Sweden, Lund University, Swedish Defence Research Agency
(FOI), Gävle University, Swedish National Defence College, Swedish Fortifications Agency,
Greater Stockholm Fire Brigade and Stockholm Public Transport (SL).
The total budget of METRO is 14.2 million SEK (ca 1.5 million Euro) and the project runs over a period of three years (December 2009 to December 2012). METRO is funded by the following fire organisations. Stockholm Public Transport (SL), Swedish Civil Contingencies Agency (MSB),
the Swedish Transport Administration (Transportverket), the Swedish Fortifications Agency
(Fortifikationsverket) and the Swedish Fire Research Board (Brandforsk). The work in METRO is divided into seven work packages (WPs):
» WP1 – Design Fire » WP2 – Evacuation
» WP3 – Integrated Fire Control » WP4 – Smoke Control
» WP5 – Extraordinary Strain on Constructions » WP6 – Fire and Rescue Operations
» WP7 – Project Management
More information about METRO can be found at the project web page. http://www.metroproject.se.
This master thesis is included in WP5. The terroristic attacks on mass transport systems in Madrid, London and Moscow highlighted a new type of threat. During a rescue operation after a deliberate attack in an underground facility it is imperative that the rescue personnel understand the effect of an explosion on the construction and train. They must be able to interpret signs of a possible cave in or structural collapse. In the WP, previously performed experiments in military facilities will be used to gain knowledge which can be used in civilian
facilities. Additional experiments and simulations will be performed and a tool which aids the decision making for rescue personnel will be developed.
The following four partners participate in METRO. Swedish Defence Research Agency (WP leader), Mälardalen University, Swedish Fortifications Agency and Swedish National Defence
College.
1.1 Background
Today it is common that certain traffic is located underground so an efficient flow of traffic can be designed independently of the existing activities above ground. The public transport systems in many major cities are planned after this principle. The subway systems are an efficient way to transport a large amount of people on a limited time (Frantzich, 2000) and because shorter distances can be drawn in transport systems located underground the travel times can be reduced compare to public transport systems located above ground. Also, by locating transport systems underground valuable land is released and the noise from traffic is reduced. (Bengtson & Wahlström, 1997)
Even outside of the cities it can sometimes be easier to locate the traffic below ground compare to letting it go above. If the traffic, for example, have to pass through an area with a lot of mountains it may be easier to make a tunnel though instead and avoid difficult terrain passages above ground. (Frantzich, 2000)
From a safety perspective it is problematic to design transport systems that includes tunnel traffic. The consequences of a fire inside a tunnel are likely to be much worse compared to a corresponding fire above ground. The fire fighting and the rescue work are more difficult to deal with for the emergency services at the same time as it is more difficult for the people to evacuate and put themselves in safety. The limited ability to clear a tunnel from heat and smoke leads to a large impact of the fire and the smoke during the evacuation progress. It is therefore important that tunnels are designed to limit the risk of fire, and if a fire occurs after all the design must make it possible for people to evacuate safely. (Frantzich, 2000)
There are many factors to take in consideration when designing rail tunnels or subway systems, but one of the most basic things is to make sure that the tunnels and underground
In the autumn of 2011 a full-scale test was carried out within the research project METRO, see chapter 4.1.2 Full Scale Tests, which included two fire tests and one explosion test. In these tests it appeared that the effect of a burning train is much higher than what previously was known. This means that the carrying structures of tunnels and subway systems are likely designed with too little fire impact. In order to assess whether the existing carrying structures in our underground facilities are safe they have to be controlled against the higher fire load.
Stockholm Public Transport (SL) has instructed its drivers to run the train to the next station
ahead or out in the open in case of a fire in a subway train. A burning train is not supposed to stop in a tunnel. This method is to prevent a complicated evacuation through the tunnel. (Frantzich, 2000) When using this method it is especially important to control the carrying structures at the platforms in subway stations.
How much impact has the fire effect and the temperature from a burning train on the carrying structures in a subway system? How does a concrete column at a subway platform located near the tracks stand against the fire load from a burning train burning with a similar effect and the same temperature as in the test carried out within the METRO project?
1.3 Aim
The overall objective for METRO WP5 is to produce research results that can be used to ensure safer operations in underground facilities in case of a deliberate attack in mass transport systems. The objective for WP5 is also to estimate the effects of a blast wave from explosions in constructions and complex geometries and to produce relevant information that can be used for contingency planning by first responders, tunnel operations and owners of underground facilities.
The objective with the work presented in this report is to determine if a concrete column placed close to the tracks at a subway station can withstand the effect and temperature of a fire in a burning train comparable to the effects and temperatures that showed at the full scale test carried out within the METRO project.
1.4 Purpose
The purpose of this work is to determine if a carrying column placed near the tracks in a subway station can withstand the strain a burning train standing at the station will cause, even though the full scale tests carried out within the research project METRO showed that a train is burning with a higher effect then the columns are designed for. Since the subway is a central
transport system used in bigger cities all over the world it is important to ensure that the constructions are safe even during intensive fires.
1.5 Limitation and Uncertainties
In order to limit the scope of this study the calculations have only been made for columns. Other carrying structures, such as beams and joists, have not been controlled.
In the METRO-test only one train carriage was burned and not a whole train, and since the fire that occurred during these test is the fire that is used as the reference fire in this work the risk of fire spread from one carriage to another has been excluded. In the calculations made within this test it is not a whole train burning, just one train carriage.
Alternative locations of the burning train will not be looked at, nor alternative placement of the column.
In the calculation progress the reality has been simplified to make it easier to calculate. These simplifications are presented continuously during the presentation of the calculations.
The cover and quantum of the reinforcement in the chosen column is not verified on-site or through any design documents or drawings. These values have been estimated based on existing standards from when the column was built.
2. Methodology
The different methods that were used in this work are Survey and Case Study. Within the survey the literature review was made. The information gathered in the literature review was used in the case study. The aim of the case study was to analyse the problem formulation by performing calculations on a set up scenario.
The first step was to set up the basics for the work such as the problem formulation, determining the aim of the work, writing the purpose and settling the limitations.
The second step was a site visit at Hötorget’s subway station where relative facts about the station was collected. Most interesting was the information about the columns. How are they placed? What dimension and length do they have? What loads are they carrying?
After the site visit a literature review was made, which also has been complemented during the work since more relevant literature was found while working with the case study.
The literature review was followed by a case study. All data that was needed for following calculations in the case study was compiled by adding the temperature and time data from the METRO test 3 to the data that was collected from the site visit and the literature review.
To find the input data that could not be found in the literature, interviews and discussions with people working within the area were made.
Initially the calculations were made by hand. To verify the manual calculations, a FEM-analyze was made with the same input data as used in the handmade calculations.
The final step within this work was to design a new column according to Eurocode. For the calculation the computer software Concrete Column by Strusoft AB was used.
3. Literature Review
3.1 Fires in General
The fire process in compartments can be divided into different phases. The first phase is the start of the fire, which runs from the ignition to the flashover. During this phase a positive pressure will be built up in the fire room and causes the air to squeeze out through openings as far as available. Fire gases will begin to fill up the room, starting at the ceiling and working its way down towards the floor. First they will fill up the ceiling before they reach down to the openings. The flow conditions will now change and a neutral plane forms. Above the neutral plane the positive pressure under the ceiling is forcing the hot fire gases out of the openings, and under the neutral plane a negative pressure will be built up and cause cold air from outside to be sucked into the fire room. (Bengtsson, 2001) Figure 1 illustrates this phenomenon, called 2 zones model.
Figure 1: 2 zones model in I compartment fire.
When the fire reach the next phase, the flashover, this two-zone layer structure will end and everything combustible in the room will contribute to the fire (Bengtson, 2005), which means that all combustible materials in the room will emit pyrolysis (Bengtsson, 2001). During this
phase the fire gases will reach a temperature between 500 and 600 degrees C and the radiation level, which the floors are subjected to, is in the range of 15 to 20 kW/m2 (Bengtson, 2005).
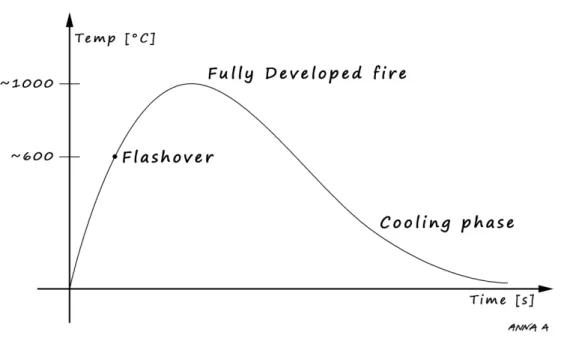
The fully developed fire follows the flashover see Figure 2. During this phase the temperature stays at a constant level between 800 and 900 degrees C till it decreases with the continuing incinerating of the combustible materials. When this happens the temperature will drop again and the cooling phase begins. (Bengtson, 2005)
Figure 2: Fire growth curve corresponding to a compartment fire.
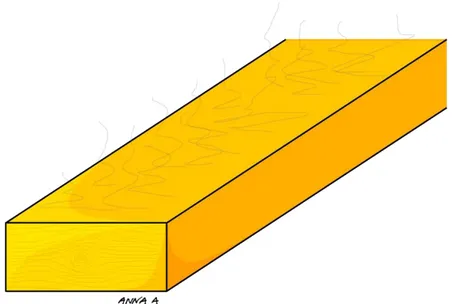
A solid material ignites by pyrolysis. The pyrolysis is a process that describes the breaking up of a fuel. The breaking up happens at a certain temperature and results in pyrolysis gases created at the surface of the material, see Figure 3. How high this temperature needs to be varies between different materials, but usually the surface must be between 300 and 400 degrees C in order to ignite the material with a pilot flame. A spontaneous ignition requires even higher temperatures. For example requires a spontaneous ignition of timber a temperature between 500 and 600 degrees C. (Bengtsson, 2001)
Figure 3: A solid material breaking up into pyrolysis gases.
The hot gas stream which is formed above the flame is called fire plume. The fire plume is formed because of the lower density of the flame and the hot fire gases compared to the surrounding relatively cold air and will therefore start to move upward. Air is drawn into the plume and gets mixed with the fire gases. Some of the air will be used for the combustion, but most of it will follow the plume up to the layer of fire gases at the ceiling and dilute the gases. (Gojkovic & Delin, 2005) The temperature and the velocity inside the plume are directly depending on how much heat the fire emits and the height of the ceiling above the fire source. Both the temperature and the velocity decreases with the height. (Bengtsson, 2001)
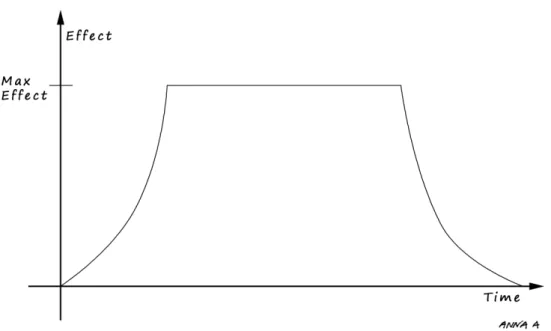
A fire can be either fuel controlled or ventilation controlled. When the fire is fuel controlled the effect of the fire is controlled by the access of fuel. To increase the effect of the fire, fuel would be needed to get added. When the fire is ventilation controlled the situation is reversed. The effect is controlled by the availability of oxygen so that an increase of the effect of the fire would be caused by adding more oxygen. During the early phase of the fire the fire is fuel controlled, but as the fire grows it can eventually turn to be ventilation controlled. This occurs when the available oxygen is no longer enough to burn the pyrolysis gases that the fuel emits. (Bengtsson, 2001) Figure 4 shows an example of a time-effect curve for a compartment fire. In the beginning the fire is fuel controlled and the effect is therefore increasing, but after t
seconds the fire becomes ventilation controlled and the effect becomes constant until all the fuel is burned and the cooling phase begins.
Figure 4: Effect and time curve.
A term often used to describe a fire is Heat Release Rate (HRR). HRR is measured in Joules per second (Watts) and describes the effect of the fire (how much energy in the form of heat that is released from the fire per second). It is a way of measuring the size of the fire.
3.2 Fire in Underground Facilities
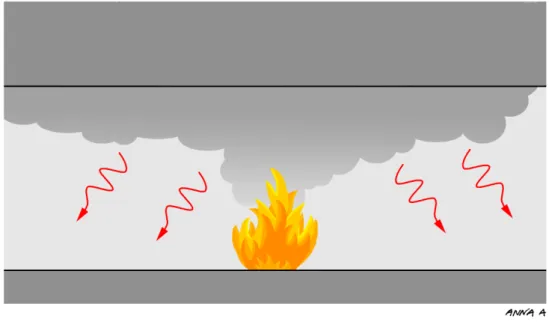
A fire in an underground facility is different compared to an open fire due to the limited space. The tunnel walls causing heat reflections that increase the effect of the fire, see Figure 5.
Figure 5: A tunnel fire with re-radiation.
The heat reflection increases the temperature so that materials or vehicles that would not have burnt intensely in an open fire turn into a heavy fire inside a tunnel. (Ingason, 2005)
At ventilation controlled fires all the oxygen in the combustion zone will be consumed, which leads to that fuel-rich gas will occur and escape to the tunnel exit. (Ingason, 2005)
A fire affects the natural ventilation in a tunnel. The natural ventilation may stop or even change direction. Because of this the fire gases can be carried far away from the fire, which will cause a major threat to people evacuating and to the fire fighters during a rescue operation. (Ingason, 2005)
Tunnel fires also differ from compartment fires such as, for example, fires in buildings. One difference is the factors that affect the HRR. In a compartment fire the HRR is often dictated by the natural ventilation, i.e. the ventilation factor which in turn depends on the area and the height of the openings. In tunnels the natural ventilation is controlled by more factors such as the size of the fire, the length and slope of the tunnel, the design of the cross section, the tunnel type (concrete or blasted rock) and meteorological conditions at the tunnel exit. The supply of oxygen is usually better for a fire in a tunnel then for a compartment fire and tunnels are often equipped with mechanical ventilation such as exhaust fans and/or jet fans positioned in the tunnel roof. The effect of the ventilation on the HRR is therefore quite different from the
effect that the ventilation causes in a compartment fire. (Ingason, Fire dynamics in tunnels, 2005)
A compartment fire can develop into a flashover within a few minutes, but in a tunnel it is unlikely that a fire will develop into a traditional flashover at all. In a tunnel the heat losses to the surroundings are so large that the sufficient amount of hot combustion fire gases that is needed for a flashover to occur will not be formed. A flashover can however occur in, for example, a vehicle inside the tunnel, but it is unlikely that the whole tunnel will be included in a flashover. (Ingason, 2005)
The risk of secondary fire gas explosions at an under ventilated fire is lower in tunnel fires then in compartment fires. This is due to the different conditions of ventilation, the large heat losses that occurs in the tunnels and the differences in geometry. If however a powerful ventilation system is activated in a tunnel during an under ventilated fire or if big fans starts up the flames can quickly grow, which leads to that the fire more easily can spread to flammable materials or vehicles located downstream the fire. (Ingason, 2005)
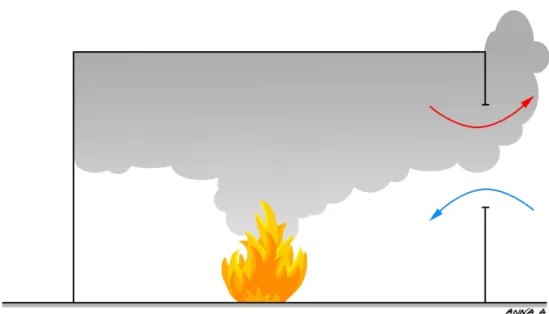
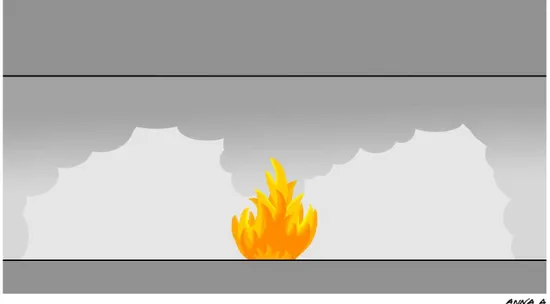
Also the formation of the smoke layers behave differently for tunnel fires compared to compartment fires. At a compartment fire the smoke lies along the ceiling in the early stage of the fire. Under this hot layer of smoke is a zone of cool, smoke-free air. A similar layer structure can occur close to the fire at a tunnel fire in absence of longitudinal ventilation. Further away from the fire the smoke will start to fall down as they cool, see Figure 6. How far from the fire this will happened depends in the size of the fire, section area and height and what type of tunnel it is.
Figure 6: A tunnel fire where the smoke cools down by the surroundings and falls down to floor level.
There is no case in the open literature where a tunnel fire has caused such damage to a tunnel so it not been repairable. There is however always certain anxiety for the risk of collapse that a tunnel fire implies. This collapse risk makes an even bigger problem in a submerged tunnel where there is a risk for leakage if the structure gets damaged. (Ingason, Bengtson, & Hiort, 1998)
3.3 Examples of Fire Accidents in Underground Facilities
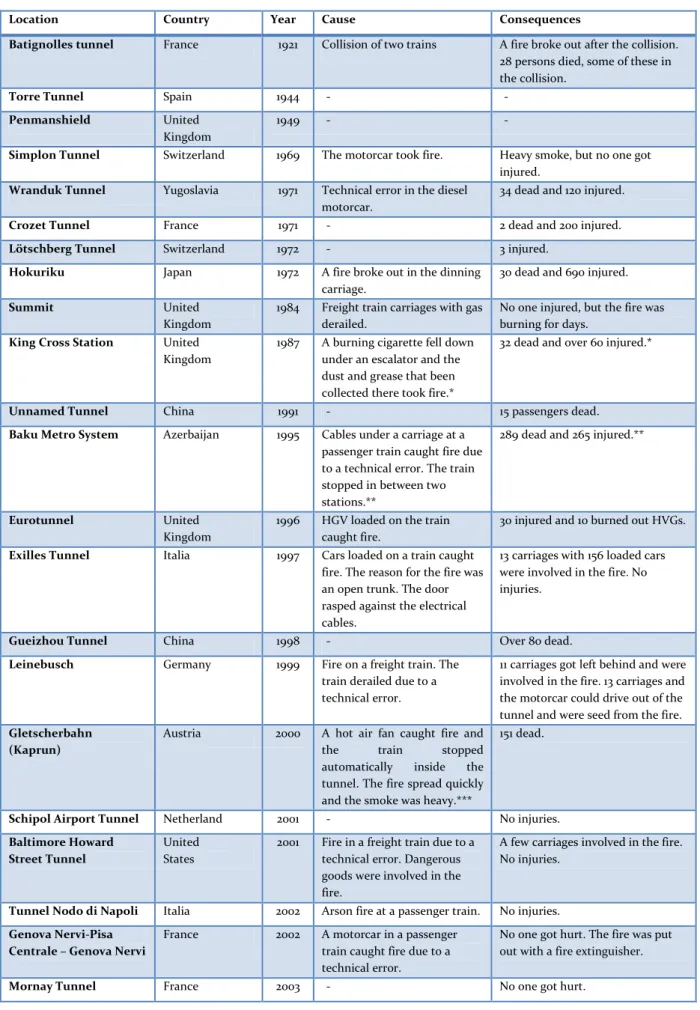
Table 1 below presents a summary of past fires in underground facilities related to rail
transport systems. The table is mainly taken from Ingason’s and Lönnermark’s report
Brandbelastning och brandscenarier för järnvägstunnlar (2004), but it has been supplemented
with more sources. The information that is not taken from Ingason’s and Lönnermark’s report is marked in the table.
Table 1: Examples of fire accidents in underground facilities and tunnels.
Location Country Year Cause Consequences
Batignolles tunnel France 1921 Collision of two trains A fire broke out after the collision. 28 persons died, some of these in the collision.
Torre Tunnel Spain 1944 - -
Penmanshield United Kingdom
1949 - -
Simplon Tunnel Switzerland 1969 The motorcar took fire. Heavy smoke, but no one got injured.
Wranduk Tunnel Yugoslavia 1971 Technical error in the diesel motorcar.
34 dead and 120 injured.
Crozet Tunnel France 1971 - 2 dead and 200 injured.
Lötschberg Tunnel Switzerland 1972 - 3 injured.
Hokuriku Japan 1972 A fire broke out in the dinning carriage.
30 dead and 690 injured.
Summit United
Kingdom
1984 Freight train carriages with gas derailed.
No one injured, but the fire was burning for days.
King Cross Station United Kingdom
1987 A burning cigarette fell down under an escalator and the dust and grease that been collected there took fire.*
32 dead and over 60 injured.*
Unnamed Tunnel China 1991 - 15 passengers dead.
Baku Metro System Azerbaijan 1995 Cables under a carriage at a passenger train caught fire due to a technical error. The train stopped in between two stations.**
289 dead and 265 injured.**
Eurotunnel United
Kingdom
1996 HGV loaded on the train caught fire.
30 injured and 10 burned out HVGs.
Exilles Tunnel Italia 1997 Cars loaded on a train caught fire. The reason for the fire was an open trunk. The door rasped against the electrical cables.
13 carriages with 156 loaded cars were involved in the fire. No injuries.
Gueizhou Tunnel China 1998 - Over 80 dead.
Leinebusch Germany 1999 Fire on a freight train. The train derailed due to a technical error.
11 carriages got left behind and were involved in the fire. 13 carriages and the motorcar could drive out of the tunnel and were seed from the fire.
Gletscherbahn (Kaprun)
Austria 2000 A hot air fan caught fire and the train stopped automatically inside the tunnel. The fire spread quickly and the smoke was heavy.***
151 dead.
Schipol Airport Tunnel Netherland 2001 - No injuries.
Baltimore Howard Street Tunnel
United States
2001 Fire in a freight train due to a technical error. Dangerous goods were involved in the
A few carriages involved in the fire. No injuries.
Daegu Metropolitan
Subway injured.*****
Simplon Tunnel Switzerland/ Italy
2011 A fire broke out a carriage carrying household goods. The flames spread to the following nine wagons due to the heat inside of the tunnel.****
A few people suffered from minor smoke inhalation.
* (SoS-rapport 1990:30, 1990) ** (Rohlén & Wahlström, 1996) *** (Larsson, 2004)
**** (Swiss Info, 2011)
***** (Lönnermark, Researcher - SP Technical Research Institute of Sweden, 2012)
3.4 Examples of Fire Tests made in Underground Facilities
In this section are two full scale fire tests, made in the 1990’s and 2010’s, presented. 3.4.1 EUREKA 499, 1990 – 1992
One of the larger fire tests carried out is the EUREKA test that was made between 1990 and 1992. Researchers from Austria, Finland, Germany, Italy, Norway, Sweden, Switzerland and the United Kingdom were involved.
Most of the fire tests involved in EUREKA were carried out in an abandoned tunnel near Hammerfest in Norway. Different kind of tests were made; for example car fires, train carriage fires, wooden crib fires, heptane pool fires, a fire with a simulated truck load and a HGV fully loaded with a cargo of furniture. Before these bigger tests in Norway were made a laboratory test and smaller tests in tunnels in Germany and Finland were carried out. In the laboratory test samples of tunnel lining was tested and in the tunnel tests in Germany and Finland were fire tests with wooden cribs made.
The objectives with EUREKA were to gather information about: » fire phenomena
» escape, rescue and firefighting possibilities » how the surrounding structure effects the fire » the reusing of the structure
» formation, distribution and precipitations of contaminants
3.4.2 METRO 2009, – 2012
Within the METRO project full scale fire and explosion tests were carried out in the Brunsbergs Tunnel in Värmland, Sweden. These tests were included in WP1 – Design Fires and WP5 – Extraordinary Strain on Constructions.
In the first test the ignition and further fire spread under the carriage was investigated. The initial fire source was a 500 kW heptane pool fire placed under the train. The fire ignited some cables at the train ATC unit, but self-extinguished after approximately 13.5 minutes. The wind speed inside the tunnel before the ignition was 2.0 to 2.5 m/s. The train model used in this test was an X1.
In the second test the same train carriage as in the first test was used. Baggage was placed in the train on the seats and in the corridors in the same way as it is expected that people would leave their bags at a rapid evacuation of a subway carriage. The amount of baggage was chosen so that it would correspond to that all seats in the carriage were occupied, but no standing passengers. It was assumed that 82 percent of the passengers have baggage with them that they would leave behind if they had to evacuate the subway carriage and the average weight of the bags were set to 5 kg. These assumptions come from a pre-study within METRO presented in the report Large-scale Commuter Train Fire Tests – Results from the METRO Project (2012). The fire in the carriage was started by a small amount of burnable liquid that was poured over one of the seats and ignited. In this test the fire increased into a fully developed fire.
Also in the third test a train carriage of the model X1 was used, but this time it was internally re-built to the model C20. The insulation in the walls and the surface layer of the walls and the ceiling were changed from Isoflex 36 mm and a burnable board to aluminium and the old seats were replaced. Baggage was placed in the same way as in the second test and the ignition of the carriage was performed in the same way. The fire turned into a fully developed fire as well but thanks to the improved interior design it took over an hour before it reached that state.
3.5 Concrete Structures
During fire the increased temperature cracks and loosens the connections between the cement paste and the ballast. This is because cement paste and ballast have different thermal dilation
when the temperature in the concrete raises the cement paste will get heavily deformed resulting in a structural degradation of the concrete. The degradation of the concrete increases with the thermal dilation of the ballast. (Anderberg & Pettersson, 1991)
When calculating the strength of concrete subjected to fire, all concrete with a temperature over 500 degrees Celsius is disregarded while the concrete with a temperature lower 500 degrees Celsius is assumed to have its full strength left. (Thor, 2012) It is mainly the flexural and tensile strength that decreases when the temperature in the concrete raises. The compressive strength of the concrete is not affected as much as the flexural and tensile strength. (Anderberg & Pettersson, 1991)
Explosive spalling means that large parts of the concrete are pushed out, which can result in that the reinforcement gets laid bare and the strength of the structure therefore gets reduced dramatically. The explosive spalling is caused by the vapour pressure that is built up when the moisture in the concrete heats up. When the vapour pressure gets to high the concrete breaks and explosive spalling can occur. Explosive spalling is mainly observed when newer, high-strength concrete is used. The reason why explosive spalling is more common with this kind of concrete is that this type of concrete is denser, making it more difficult for moisture to diffuse through the concrete surface. The moister content of the concrete has an obvious impact on the risk of spalling, but the fire itself also got an impact on the spalling risk. A fire spreading rapidly gives a greater temperature gradient in the concrete which increases the spalling risk. (Thor, 2012)
An example of a structure where the surrounding environment causes a higher risk of spalling is a construction placed in a tunnel. Often is high-strength concrete used in this kind of environments, in the same time as the moisture content is usually higher than in an above-ground structure. The risk of an intense fire is also bigger in a tunnel environment then in an ordinary compartment fire. (Thor, 2012)
The strength of steel decreases with increasing temperature. It is often the temperature increase in the reinforcement that decides a concrete structure’s strength during a fire. (Anderberg & Pettersson, 1991)
3.6 Regulations
In this section the building regulations applied in Sweden today are presented – Eurocodes – but also the regulations that were used before the introduction of Eurocodes – Boverkets
konstruktionsregler. These regulations apply to construction and alteration of buildings, but not for construction and alternation of structures such as tunnels. If subway stations are buildings or structures may be a matter of interpretation, but in the case study of this work have subway station been categorized as a building and the track tunnels have been categorized as structures. This means that the building codes have been used when calculation on the structures of the subway station.
3.6.1 Boverkets Konstruktionsregler (BKR)
On January the 1st 1994 Nybyggnadsreglerna cease to apply and Boverkets Byggregler (BBR) and
Boverkets Konstruktionsregler (BKR) became effective. With this shifting of regulations the
requirements changed from being detail steering to become functional steering. This meant that instead of specify in the regulations how to build to meet the requirements, so were the demands in BKR written to control the function of the chosen solution. What solution that was selected was less important as long as the function of the solution lived up to the required function.
The 1st of January 2010 was BKR withdrawn and replaced with Eurocodes.
3.6.2 Eurocode
In 1975 the European Commission (EC) adopted a work program for the field of construction with intention to reduce technical barriers for trading and to harmonize the technical specifications. Within this work program EC carried out rules for how to design structures. In a first approach the rules were meant to be an option to the member states’ national regulations in order to later replace them. (SS-EN 1992-1-2:2004)
With help from a leading committee with representatives from various member states led EC for fifteen years the implementation of the Eurocode program, which in 1980 led to the first generation of the European calculation rules. (SS-EN 1992-1-2:2004)
The EC and the European Free Trade Association (EFTA) decided in 1989 by an agreement between EC and the European Committee for Standardization (CEN) to transfer the preparation and publication of the Eurocodes to CEN though a series mandate to give them a future European Standard (EN). This meant that the Eurocodes became connected with all EU
requirements of EU directive 89/106/EEC.
» As a basis for drawing up contracts for construction and related engineering services. » As a basis for drawing up harmonized technical specifications for construction
products. (SS-EN 1992-1-2:2004)
The Eurocodes contains common rules for the design of carrying structures, parts in carrying structures and elements in both traditional and innovative nature. More unusual conditions for the construction and design are not covered. In these cases requires special expert investigations. (SS-EN 1992-1-2:2004)
National standards have been introduced, which contains information about the parameters that have been left open in the Eurocodes for national elections. The national selected parameters shall be applied in the design of facilities and building within the state. (SS-EN 1992-1-2:2004)
4. Analysis of a Carrying Column Exposed to Fire Placed at an
Underground Subway Station
In this case study a carrying column corresponding to a column placed at Hötorget’s subway station was analysed. The bearing capacity of the column when exposed to fire was determined. The column was analysed in its current condition and in the condition it would have been in if it would have been built between 1994 and 2010, i.e. according to Boverkets konstruktionsregler.
As a final step in this case study a new column was designed. The new column corresponds to what the columns at the platform of the current subway station would look like if the station was built after today’s regulations.
4.1 Comparison between the EUREKA- and METRO test
When comparing the fire process in the EUREKA F2St and METRO (test 3) tests it is clear that the METRO fire was larger than the EUREKA fire. The temperatures reached by the METRO fire were much higher than the temperatures in the EUREKA test.
What distinguishes the EUREKA test from the METRO test are the sizes and numbers of ventilation openings and amount of burnable material in the carriages. The METRO test carriage was loaded with baggage and therefore had a higher fire load. The higher fire load had influence in the initial fire state, but not after the flashover inside the carriage. When the fire reaches the flashover state the effects and temperatures is more or less the same independent of the fire load. Since the fire in the carriage is ventilation controlled is the fire load just controlling for how long time the fire is going to burn.
When choosing the METRO as the reference fire an assumption is made that the train passengers were carrying luggage on to the train, which they left in the train when evacuating.
4.2 Setup of the Scenario
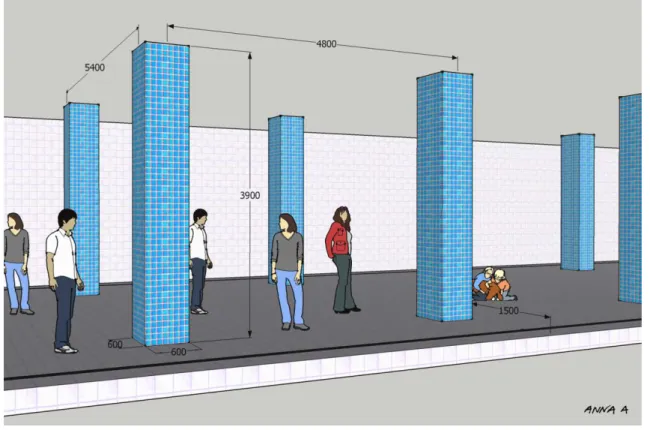
The subway station that was chosen as a reference station for this work was Hötorget’s subway station. The reason why this station was chosen is that at this station the carrying columns at the platform are located close to the tracks. It is just 1.5 m from the columns to the platform edge. This means that if a burning train rolls into the station these columns will be highly exposed to the fire.
The columns at the platform of Hötorget’s subway station are concrete columns clad with tiles. The columns have the dimension 600 x 600 mm and they are 3 900 mm high, se Figure 7. The tiles are assumed to be 10 mm thick, but the calculations have been made for a concrete section of 600 x 600 mm anyway since tiles can be considered having the same character as concrete.
Figure 7: Hötorget’s subway station.
No construction drawings of the columns have been found, so the exact design of the columns have not been established. To get an idea of what the columns could look like inside a construction engineer, Åke Bjurholm (Grontmijr), with many years of experience in the business was consulted. Bjurholm considers it likely that a concrete of the quality K30 were used when making the columns, and according to him the concrete growth over the years to a concrete quality equivalent to K50. Bjurholm also estimate that the load capacity of the columns are around 4 000 kN, which is supported by our own calculations, se Appendix A. In the calculations made within this work the concrete cover layer of the column is set to 40 mm. This assumption was made with the report Betongkonstruktioners beständighet – En
where it stops. The doors open for travellers to evacuate and stay open. The evacuees are assumed to leave most of their language behind when leaving the train.
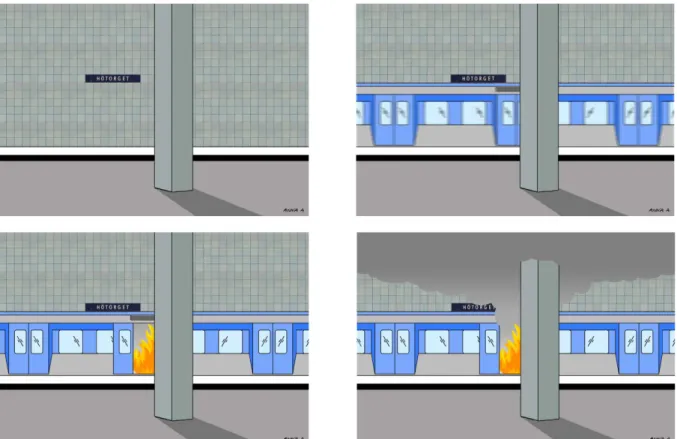
One of the stations carrying columns is placed in front of an opened door section. This column is the reference column in the calculations made within this work. The fire is not extinguished, but left to develop into a fully developed fire. The fire does not spread to any of the other carriages.
Figure 8 below shows the setup of the scenario.
Figure 8: The setup of the scenario. A burning train comes in to a underground subway station. The door open and
people evacuate. The doors stay open and the smoke starts to fill up the station.
4.3 Calculations
In this section the calculations made within this work is presented. As a first step the thermal conduction was calculated, both analytically and numerically. The results of these calculations were compiled and converted from one-dimensional values to two-dimensional values. After the conversion the values got compared with the results from a FEM-analysis made with the same input data as for the handmade calculations. As a final step the controls of the columns were made and a new column was design according to Eurocode.
4.3.1 Analytic Calculation of Thermal Conduction
To study the columns bearing capacity when exposed to fire the thermal conduction equations with error functions from compendium Analytisk lösning av värmeledningsekvationen (1990) was used. These equations are widely spread within fire physics and have a significant role when studying various processes like ignition, flame spread and – like in this case – a structures bearing capacity when exposed to fire.
The thermal conduction equations were used to calculate how the heat is transported into the material and thereby find out at what depth in the column the concrete is 500 °C. With this knowledge it was possible to estimate how much of the concrete cross section is still carrying after being exposed to the fire and how much of the cross section should be regarded as unusable.
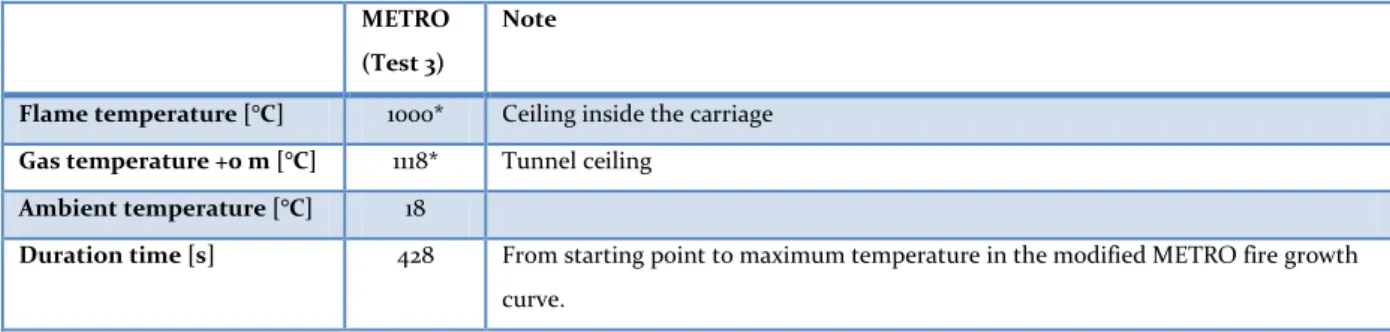
In Table 2 and 3 below are the input data used in the calculations presented.
Table 2: Data used in the calculations
METRO (Test 3)
Note
Flame temperature [°C] 1000* Ceiling inside the carriage
Gas temperature +0 m [°C] 1118* Tunnel ceiling
Ambient temperature [°C] 18
Duration time [s] 428 From starting point to maximum temperature in the modified METRO fire growth curve.
* (Lönnermark, Lindström, Zhen Li, Ingason, & Kumm, 2012)
In the FEM-analyse carried out within this work, see section 4.3.5 FEM-analyse, it can be seen that the 500 °C boarder gets deepest into the column when the fire temperature is at its highest. Before using the METRO fire growth curve in the FEM-analyse it was modified to reduce the amount of data for the program. The slow start of the fire growth curve were cut off and thereby only the end of the fire growth curve, were the fire grows bigger, was used in the modelling. In order to make the handmade calculations comparable with the results of the FEM-analyse the same modified METRO fire growth curve was used as basis. The duration time in the handmade calculations is therefore set to the time it took for the fire to reach its
Figure 9: The original METRO fire growth curve.
Figure 10: Modify METRO fire growth curve. The modification that has been done is that the first 6 639 seconds of
the original METRO fire growth curve have been cut off. Accept from this modification the fire growth curves are identical.
When calculating the thermal conduction analytically a simplification is made in which the temperature is constant. This means that in these calculations the column is assumed to be
exposed to a fire with a fire growth curve corresponding to the fire growth curve presented in
Figure 11 below.
Figure 11: Fire growth curve for analytical calculation of thermal conduction Table 3: Data used in the calculations
Material values Concrete Note
Thermal conductivity [W/mK] 1,7
Density [kg/m3] 2300 Heaviness of concrete.
Specific heat capacity [J/kgK] 800
When using the thermal conduction equations two cases can be chosen; direct impact or radiation impact. Direct impact means that the studied object is subjected to a direct effect of the fire gases rubbing against the structure. Heat is thereby transferred to the structure by convection and radiation. Radiation impact means that the studied object is heated by radiation from a radiating source located at a certain distance from the structure. Both of these cases were calculated.
inertia. The surface of the concrete therefor quickly gets the same temperature as the fire gases. The heat will not penetrate the material, but remain at the surface and thereby heat it up instead of directly being led into the material.
The value of 𝛼𝑚 was calculated according to Equation 2 below.
𝛼𝑚=𝜌∙𝑐𝑘 (2)
To calculate the thermal conduction with radiation impact without h Equation 3 was used.
𝑇(𝑥,𝑡)=𝑞 " ̇ 𝑘�2 ∙ � 𝛼𝑚𝑡 𝑘𝜌𝑐𝑒 −4𝛼𝑚𝑡𝑥2 − 𝑥 ∙ 𝑒𝑒𝑒𝑐 ��4𝛼𝑥 𝑚𝑡�� + 𝑇𝑎 (3)
The 𝛼-value was calculated according to Equation 2 above, but to use Equation 3 the heat radiation was also required. Heat radiation is transmission of thermal energy through electromagnetic waves. Energy from a body with a certain temperature propagates in the space as electromagnetic waves and gets absorbed by a receiving media. In other words, heat radiation is an energy exchange between two or more media with different temperatures. (Jönsson & Lundqvist, 2005)
Since the radiation source in this case was rectangular, see Figure 12, could the incident radiation be calculated by using view factors.
Figure 12: Illustration of the prerequisites when calculating the heat radiation.
The view factor was collected from Table B1, see Appendix B, after calculating the α-value and the S-value according to Equation 4 and 5 below. To get the most representative value for the view factor interpolation was used for non-represented values that are in between two values in the table.
𝛼 =𝐿1∙𝐿2
𝐷 (4)
𝑆 =𝐿1
𝐿2 (5)
To get the total view factor for the radiating surface the addition law, see Equation 6, was used. In this case it meant that the calculated view factor for area 1 was multiplied with four since surface 1, 2, 3 and 4 were equal.
Φ𝑥= Φ1+ Φ2+ Φ3+ Φ4 (6)
door was assumed to be open, so the heat radiation came directly from the flame. Since the carriage is assumed to be burning flames will fill up the whole door cross-section area. Therefore the radiating area is set to the door opening area. Making this assumption means that the calculation was made for a worst case scenario.
𝑞′′= 𝜀 ∙ 𝜎 ∙ Φ ∙ (𝑇
14− 𝑇04) (7)
The heat radiation values that were calculated by using above presented equations are presented in Table 4 below.
Table 4: Heat radiation
Heat Radiation [kW/m2] Note
METRO test 3 48 Equation 7
To calculate the thermal conduction without h is a simplification. By leaving out h no account was taken to the heat transfer coefficient, which means that no account was taken of the experimental geometry, fluid properties, flow characteristics and temperature differences. To obtain values more in line with reality new calculations were supposed to be made where the thermal conduction was calculated with respect to h. Thermal conduction with radiation impact with h cannot be calculated analytically though, and when calculations were made for thermal conduction with direct impact with h the equation did not work for the current scenario.
The equations used to calculate the thermal conduction with direct impact with h was
Equation 8 below. 𝑇(𝑥,𝑡)−𝑇0 𝑇𝑔−𝑇0 = 1 − 𝑒𝑒𝑒 � 𝑥 2√𝛼∙𝑡� − 𝑒 �ℎ∙𝑥𝑘+ℎ2∙𝛼∙𝑡𝑘2 � ∙ �1 − 𝑒𝑒𝑒 �2√𝛼∙𝑡𝑥 +ℎ√𝛼∙𝑡𝑘 �� (8)
The heat transfer coefficient was calculated as follows.
ℎ = ℎ𝑟+ ℎ𝑐 (9)
where the heat transfer coefficient for the radiation part is
ℎ𝑟 =𝜖𝑇𝑟𝑔∙5,67−𝑇𝑠𝑐∙ ��100𝑇𝑔� 4 − �𝑇𝑠𝑐 100� 4 � (10)
In Equation 10 the temperature of the surface of the column (Tsc) is assumed to be the same as
According to Eurocodes (SS-EN 1991-1-2) the heat transfer coefficient for the convective part (ℎ𝑐) can be set to 25 W/m2K for a standard fire or 35 W/m2K for a natural fire. There are
equations that can be used to calculate the exact value of the heat transfer coefficient for the convective part, but when using the equations the effect of the value is very small. Therefore a fixed value was used here and the heat transfer coefficient for the convective part is therefor set to 35 W/m2K.
In Table 5 below is the calculated total heat transfer coefficient METRO presented.
Table 5: Calculated Heat Transfer Coefficient
Heat Transfer Coefficient [W/m2K] Note
METRO test 3 79 Equation 9
When the values were used in Equation 8 and the depth into the column at 500 °C should be collected it appeared that this equation worked neither for the purpose of this scenario. The marked part of the equation, see Figure 13 below, became so large that the depth into the column resulted in negative figures.
To get a positive number out of the equation the marked parts of the equation, see Figure 14 below, should be less than 1.
4.3.2 Numerical Calculation of Thermal Conduction
Another way to estimate the thermal conduction is to make numerical calculations. These 𝑇(𝑥,𝑡)− 𝑇0 𝑇𝑔− 𝑇0 = 1 − 𝑒𝑒𝑒 � 𝑥 2√𝛼 ∙ 𝑡� − 𝑒 �ℎ∙𝑥𝑘 +ℎ2𝑘∙𝛼∙𝑡2 � ∙ �1 − 𝑒𝑒𝑒 � 𝑥 2√𝛼 ∙ 𝑡+ ℎ√𝛼 ∙ 𝑡 𝑘 �� 𝑇(𝑥,𝑡)− 𝑇0 𝑇𝑔− 𝑇0 = 1 − 𝑒𝑒𝑒 � 𝑥 2√𝛼 ∙ 𝑡� − 𝑒 �ℎ∙𝑥𝑘 +ℎ2𝑘∙𝛼∙𝑡2 � ∙ �1 − 𝑒𝑒𝑒 � 𝑥 2√𝛼 ∙ 𝑡+ ℎ√𝛼 ∙ 𝑡 𝑘 ��
Figure 13: Thermal conduction with direct impact with h
this case represented by the initial temperature at Hötorget’s subway station.
Figure 15: Numerical conduction of thermal conduction in principle
The thermal conduction through the structure is then calculated for one layer at the time at different time steps. All layers are calculated for each time step and then the next time step is calculated. To calculate the second time step the layers temperature calculated in time step one is used, and so on.
The temperature of the fire side was adjusted to the time steps by using the temperature of the current time read out from the modified METRO fire growth curve, se section 4.3.1 Analytic
Calculation of the Thermal Conduction. In other words, at time step t=150 s the temperature
from the modified METRO fire growth curve at the time 150 s was used.
Since the fire temperature is not set to constant in the numerical calculations the simplification made in the analytic calculations, where the temperature is set to constant, is not needed here. Therefor the numerical calculations are assumed to be exposed to a fire growth curve corresponding to the fire growth curve presented in Figure 16 below.
Figure 16: Fire growth curve for numerical calculations of thermal conduction.
For the numerical calculations Equation 11 and 12 below were used. To calculate the first layer in every time step Equation 11 has been used and 𝑇1 was excluded and thereby calculated for
the layers in the different time steps. The rest of the layers have been calculated with
Equation 12. The values used in the calculations can be seen in Table C1 in Appendix C.
∆𝑥1∙ 𝑐 ∙ 𝜌 ∙∆𝑇∆𝑡1=�𝑇1𝑔−𝑇1� ℎ+∆𝑥12𝜆1 −(𝑇1−𝑇2) ∆𝑥1 2𝜆1+∆𝑥22𝜆2 (11) ∆𝑥𝑛∙ 𝑐 ∙ 𝜌 ∙∆𝑇∆𝑡𝑛=∆𝑥𝑛−1�𝑇𝑔−𝑇𝑛� 2𝜆𝑛−1+∆𝑥𝑛2𝜆𝑛 −(𝑇𝑛−𝑇𝑛+1) ∆𝑥𝑛 2𝜆𝑛+2𝜆𝑛+1∆𝑛+1 (12)
Figure 17: Temperature in the column at distance x at time t.
4.3.3 Compilation of the Thermal Conduction Calculations
Table 6 below shows an overview of the results of the thermal conduction calculations made
within this work.
Table 6: Thermal conduction
Thermal conduction equations describing the distance into the material for a 500°C isotope
Distance [mm]
Note Thermal conduction with direct impact without h 22
Thermal conduction with direct impact with h Error
Thermal conduction with radiation impact without h 5
Numerical calculation < 1 Equations 11 & 12
4.3.4 Conversion from one-dimensional to two-dimensional values
The calculated values of the thermal conduction are one-dimensional, which means that they are calculated for one-sided fire impact. To convert them from one-dimensional to two-dimensional values, representing a corner with fire on both sides requires that the fire from the METRO test is set in relation to the standard fire growth curve. The reason way this conversion is necessary is that both the graphs in SS EN 1992-1-2 Annex A and Ulf Wickström’s equations, which can be used to convert a one-dimensional case into a two-dimensional case, are based on the standard fire growth curve.
Within this work Ulf Wickström’s equations have been used. Equation 13, 14, 15 and 16 is taken from Methods for Predicting Temperatures in Fire-exposed Structures (2008) and Application of
the Standard Fire Curve for Expressing Natural Fires for design Purposes (1986).
A first step was to, by using Equation 13, calculate at what temperature in the standard fire gwoth curve it gets 500 °C in the column at the depths calculated for the METRO fire.
𝑇𝑠 =𝜂𝑤𝑇𝑐∙𝜂𝑥 (13)
where
𝜂𝑤 = 1 − 2,26 ∙ 𝑡−0,88 (14)
𝜂𝑥 = 0,18 ∙ 𝑙𝑛 �𝑥𝑡2� − 1,547 (15)
When the METRO fire growth curve was set in relation to the standard fire growth curve the one-dimensional values could be converted into two-dimensional values. Equation 16 below were used, and by trying with different depth it could be estimated at what depth inside the column it gets 500 °C when the structure is affected from two-dimensional impact. In other words, different depth was tested until 𝑇𝑐 got 500 °C.
𝑇𝑐 = [𝜂𝑤(𝜂𝑥+ 𝜂𝑤− 2 ∙ 𝜂𝑥∙ 𝜂𝑤)]𝑇𝑠 (16)
Table 7 below presents the depth into the column were it is 500 °C after they were converted
from one-dimensional values to two-dimensional values.
Table 7: Thermal conduction, two-dimensional values
Thermal conduction equations describing the distance into the material for a 500°C isotope
Distance [mm]
Note Thermal conduction with direct impact without h 29
Thermal conduction with direct impact with h Error
Thermal conduction with radiation impact without h 13
Numerical calculation 5
The results of the analysis are presented in Figure 18 below. The figure does not show the whole cross section of the column, but only one of four corners, i.e. one quarter of the column cross section. The frame is taken 450 seconds into the modeling, which was the time that the temperature reached its peak in the FEM-analyze and the 500 °C boarder went deepest into the column.
Figure 18: Screen-shot from the FEM-analyze 450 seconds in to the simulation. The figure shows a quarter of the
columns cross-section.
Figure 18 shows that only a few millimeters of the columns cross section shall be considered as
unusable due to a fire corresponding to the METRO fire. 4.3.6 Control of Column
As both the numerical calculation, which are considered more precise than the analytical calculations, and the FEM-analyse shows that only a few millimetres of the columns cross section must be considered unusable the control of the columns gets unnecessary. A fire corresponding to the METRO fire will only have a negligible impact on the column.
4.3.7 Conversion Factor
The calculation process to design a column according to Eurocodes differs compared to the calculation process to design a column according to BKR. The difference is that the influence of the selected safety class shows as a coefficient in the equations used for calculating the loads when using Eurocodes and when using BKR the effect of the safety class is included in the equations used to calculate the strength of the material. To be able to use the loads which were generated by the BKR-calculations when calculating the new column according to Eurocodes the loads had to be translated from BKR proportions to Eurocode proportions. This was done by developing a conversion factor that translates BKR loads to Eurocode loads. How this factor has been calculated can be seen in Appendix D.
4.3.8 Designing of a new Column
A new column was designed after today’s regulations, Eurocode (Swedish Annex). The idea was to design the column so it could withstand the damage caused by a fire corresponding to the fire that occurred in the full scale test within METRO tests, but since it was shown in the previous calculations that the impact of the fire was so low the column was designed ultimate limit state instead. The aim of this calculation was now to try to slim down the column’s cross section.
The column was design with the same prerequisites as the existing columns are assumed to be design after. During the calculations it turned out that the concrete quality class used in the previous calculations were too poor to cope with the exposure class, so in the second and the third run a better concrete class were used. For the fourth run the utilization ratio was set to 60 percent, same as the column in the verification calculation in Appendix A.
The calculations done to designing the new column was made with the computer software
Concrete Column 6.3.001 by Strusoft AB.
The calculations can be seen in Appendix E.
4.4 Results of the Study
A carrying column corresponding to a column placed at Hötorget’s subway station can withstand the effect and temperature of a fire corresponding to the effects and temperatures
5. Discussion and Conclusions
When comparing the handmade calculations with the FEM-analyse it can be seen that the numerical calculations give a better result than the analytical calculations. We think that the reason for this is that the numerical calculations were made with fewer simplifications than in the analytical ones. Instead of making the temperature constant, as it was done in the analytical calculations, different temperatures were used for each time step in the numerical calculations. When using the numerical calculations the changing of h is also taken into account. It is changing with the different time steps. When h is taken into account in the analytical calculations h is set to a constant value.
When comparing the numerical and the analytical calculations made within this work, it gives a slightly misleading picture since we have made the analytical calculations without taking account of h. If we had been able to use Equation 8 which includes h when calculating the thermal conduction analytically the results might not have differ that much.
When comparing the analytical calculations it was shown that the thermal conduction with direct impact gave a better result than the thermal conduction with radiation impact. We believe this is due to the high calculated value of the heat radiation. The reason for the high value could be that our radiating surface is so great and that the emission value is set to 1. If another assumption had been made and the calculation would have been made as if the doors would be closed and the windows not broken we would have a smaller radiating surface and a lower emissivity. This would lead to a lower radiation value, which consequently had led to a better value for the analytical calculations with radiation impact.
If the fire had last longer than the METRO fire did, we might get problems with the analytical calculations of thermal conduction with direct impact as well. The METRO fire reached high temperatures, but only over a short period since it was only one carriage set on fire. In reality it is likely that the fire will spread to more than one carriage if a train is burning, so that the column would be affected by the fire and hot gases for a longer time.
The numerical calculations might be able to provide even better results if more time steps are made. Within this work we chose not to make more time steps than four, although a more precise calculation with more time steps might have resulted in values even closer to the output of the FEM-analyse.