http://www.diva-portal.org
This is the published version of a paper published in Journal of Rehabilitation Medicine.
Citation for the original published paper (version of record):
Magnusson, L., Ramstrand, N., Fransson, E., Ahlström, G. (2014)
Mobility and satisfaction with lower-limb prostheses and orthoses among users in Sierra Leone:
A cross-sectional study.
Journal of Rehabilitation Medicine, 46(5): 438-446
http://dx.doi.org/10.2340/16501977-1780
Access to the published version may require subscription.
N.B. When citing this work, cite the original published paper.
Permanent link to this version:
ORIGINAL REPORT
Objectives: To investigate patients’ mobility and satisfaction with their lower-limb prosthetic or orthotic device and re-lated service delivery in Sierra Leone; to compare groups of patients regarding type and level of assistive device, gender, area of residence, income; and to identify factors associated with satisfaction with the assistive device and service. Methods: A total of 139 patients answered questionnaires, including the Quebec User Evaluation of Satisfaction with Assistive Technology questionnaire (QUEST 2.0).
Results: Eighty-six percent of assistive devices were in use, but half needed repair. Thirty-three percent of patients re-ported pain when using their assistive device. Patients had difficulties or could not walk at all on: uneven ground (65%); hills (75%); and stairs (66%). Patients were quite satisfied with their assistive device and the service (mean 3.7 out of 5 in QUEST), but reported 886 problems. Approximately half of the patients could not access services. In relation to mobility and service delivery, women, orthotic patients and patients using above-knee assistive devices had the poorest results. The general condition of the assistive device and pa-tients’ ability to walk on uneven ground were associated with satisfaction with the assistive devices and service.
Conclusion: Patients reported high levels of mobility while using their device although they experienced pain and dif-ficulties walking on challenging surfaces. Limitations in the effectiveness of assistive devices and limited access to follow-up services and repairs were issues desired to be addressed. Key words: prosthesis; orthosis; assistive device; Sierra Leone; satisfaction; disability; rehabilitation.
J Rehabil Med 2014; 46: 438–446
Correspondence address: Lina Magnusson, Department of Re-habilitation, School of Health Sciences, Jönköping University and Swedish Institute for Disability Research, PO Box 1026, SE-551 11, Jönköping, Sweden. E-mail: Lina.Magnusson@ hhj.hj.se
Accepted Nov 1, 2013; Epub ahead of print Mar 24, 2014 INTRODUCTION
Violence during the civil war in Sierra Leone between 1991 and 2002 resulted in an increased number of amputees in need of prostheses (1, 2). A strategy of the war in Sierra Leone was
machete-style amputations of inhabitants. In addition, low vac-cination coverage led to polio outbreaks before and during this war, resulting in persons in need of assistive devices (2, 3). At the end of the war, the group in need of prostheses and orthoses was estimated at 10,000 people (4), with approximately 5000 new upper-limb amputees (5) and 1,000 new lower-limb am-putees due to war-related injuries (4). In Sierra Leone persons with disability have poor access to healthcare and appropriate rehabilitation services (6, 7). Unemployment is higher among people with disabilities compared with able-bodied individuals. Approximately 70% of households with a person with dis-abilities have no income, compared with approximately 30% of households comprising non-disabled persons (8).
To facilitate personal mobility the Convention of Rights for Persons with Disabilities (CRPD) promotes the availability, knowledge and use of assistive devices in rehabilitation pro-grammes, including prosthetic and orthotic services (Articles 26 and 20) (9, 10). Major efforts have been made over the past decade by international organizations to provide prosthetic and orthotic services in Sierra Leone (11). To-date no studies have investigated whether patients who require prostheses or orthoses in Sierra Leone are satisfied with their assistive de-vices and the serde-vices received, nor have any studies assessed their mobility. Previous research in a low-income context has demonstrated that orthotic patients have less access to services than prosthetic patients (12). The International Committee of the Red Cross low-cost technology for orthotic devices has also been evaluated less frequently than for prosthetic devices (13), even though the services are provided by the same profession (prosthetist/orthotists). Furthermore, certain groups are known to be marginalized in Sierra Leone; for example, women have poorer access to education (14), and people living in rural areas struggle to afford transport to access prosthetic and orthotic services (15). Group comparisons related to these areas are therefore of interest.
This study aimed to investigate lower-limb prosthetic and orthotic patients’ mobility and satisfaction with their assistive device and related service delivery in Sierra Leone. A further aim was to compare groups of patients regarding type and level of assistive device (below-knee or above-knee device), gender, area of residence, income, and to identify factors as-sociated with satisfaction with assistive devices and service.
MObILITy AND SATISFACTION wITh LOwER-LIMb PROSThESES AND
ORThOSES AMONG USERS IN SIERRA LEONE: A CROSS-SECTIONAL STUDy
Lina Magnusson, MSc
1,2, Nerrolyn Ramstrand, PhD
1, Eleonor I. Fransson, PhD
3,4and
Gerd Ahlström, PhD
5From the 1Department of Rehabilitation, 2Swedish Institute for Disability Research 3Department of Natural Science
and Biomedicine, School of Health Sciences, Jönköping University, Jönköping, 4Institute of Environmental Medicine,
Karolinska Institutet, Stockholm and 5Swedish Institute for Health Sciences, Department of Health Sciences, Faculty of
439 Mobility and satisfaction among prosthetic and orthotic users In this study, use of the term “assistive device” refers only to
lower-limb prosthetic and/or orthotic devices. METhODS
A cross-sectional study based on a questionnaire including prosthetic and orthotic patients’ responses.
Setting
Sierra Leone has 4 rehabilitation centres that provide prosthetics and orthotic services. This study was performed in collaboration with staff at these local organizations. Three of the centres are located in large cities, Freetown, bo and Makeni, while the forth, Koidu, covers a large rural area including the diamond district that was occupied by the rebels during the war and where many people were amputated. Non-governmental organizations (NGOs) contributed funding to all centres. The centres in Bo, Freetown and Koidu were officially handed over to the government in 2009 (11) with a 3-year agreement that the NGOs would gradually decrease support for running costs and plac-ing international orders durplac-ing this handover period. After 2011, the NGOs agreed to continue supporting outreach activities. At the time the study was conducted one qualified prosthetist/orthotist (Interna-tional Society of Prosthetics and Orthotics/world health Organization (ISPO/whO) category II) (16) worked at each rehabilitation centre. Other staff included technicians trained on the job, or staff who had one year of education (ISPO/whO category III) (16).
Sampling
Patients were recruited from the local registers of all 4 rehabilitation centres. Inclusion criteria were: 15 years of age or older, with a lower limb disorder and having received prosthetic and/or orthotic services between April 2009 and December 2010. A total of 553 patients fulfilled the inclusion criteria. Since only a few telephone numbers were available, local rehabilitation staff assisted in contacting patients through visits to homes, schools, workplaces, via community organiza-tions and through key people.
Patients
A total of 139 eligible patients (39 (28%) females and 100 (72%) males) were located and invited to participate in the study. The mean age of patients was 34 years (age range 15–81 years). Patients represented all 4 rehabilitation centres; their characteristics are shown in Table I. No statisti-cally significant differences were found between patients in the register who participated in the study (n = 139) and those who did not (n = 411) regarding sex, type and level of assistive device. however, the relative number of patients representing the Freetown region was slightly lower than for other regions. based on the patient register it was not possible to determine whether patients lived in urban or rural settings.
Questionnaire
The questionnaire has been used previously in Malawi (17). Questions related to demographics, general characteristics, mobility and daily activities were constructed by the authors after reviewing relevant checklists and questionnaires that have been used previously to evalu-ate mobility and outcomes in patients using assistive devices (18–20). The Quebec User Evaluation of Satisfaction with Assistive Technol-ogy (QUEST 2.0) questionnaire (21, 22) was used for evaluation of patients’ satisfaction with their assistive device and the service they received. This questionnaire was selected as it has previously been demonstrated to be a valid measure of satisfaction with assistive devices and services (22) and was deemed appropriate for use in a low-income context. Four questions about satisfaction with empirical relevance to prosthetic and orthotic services were also added. Patients could also add their own comments.
The questionnaire was translated (23) from English to Krio by 3 teachers working at the Sierra Leonean language department, Freetown Teachers College. The teachers performed initial translations indepen-dently and then discussed any discrepancies with the first author and two NGO staff who worked with disability issues. The questionnaire was back-translated from Krio to English by a fourth translator. The back-translation was compared with the original English version and discussed by the two NGO staff and the first author.
Data collection
Ethical clearance was obtained from the National Scientific Ethical Review Committee in Sierra Leone. Permission was also obtained from the town chiefs and health centres within the chiefdoms. writ-ten informed consent was obtained from all patients (24). because of low literacy levels the questionnaire was read aloud. The first author (LM) read the questionnaire to 62 patients in English, while an inter-preter read it to 77 patients in Krio or translated it to another tribal language (Kono, Themne and Limba) with the first author present. Sessions took place in January to February 2011 in patients’ homes or villages (n = 32), in schools, workplaces, training centres (n = 31), sports grounds (n = 5), or at the rehabilitation centre (n = 71). For all patients, the general condition of assistive devices was evaluated by the Table I. Patients’ demographics and characteristics (n = 139)
Patients n (%) Region of residence Freetown areaa 54 (39) Makeni area 32 (23) bo area 22 (16) Koidu area 20 (14)
Other areas and undefined areas 7 (5)
Giama bongoo Chiefdom 3 (2)
Sandor Chiefdom 1 (1) Rural/urban areas Living in cities 86 (62) Living in villages 53 (38) Tribes Mende 27 (19) Temne 46 (33) Kono 15 (11) Limba 14 (10) Fullah 7 (5) Madingo 7 (5) Krio 5 (4) Koranko 5 (4) Susu 5 (4) Kissi 4 (3) Loko 2 (1) Sherbo 1 (1) Nigerian 1 (1) Religion Christian 82 (59) Muslim 57 (41) Income level No income 49 (36) Sometimes income 64 (47)
Regular income from employment 24 (17) Type of disability
Syme’s or trans-tibial amputee 48 (35)
Trans-femoral amputee 31 (22)
Ankle-foot orthosis user 2 (1) Knee-ankle-foot orthosis user 58 (42) aIncluding heastings (n = 10), Cabalatown (n = 2) and Grafton (n = 7).
first author, LM, a certified prosthetist/orthotist. The general condition of assistive devices was classified as: never used; broken cannot be used; in use but needs repair; or in use good condition.
Data analysis
In the planning phase power calculations were conducted for QUEST 2.0 satisfaction with assistive device and service scores. The power calculations indicated that approximately 160 patients should be in-cluded in order to detect a mean difference of 0.3 between two groups with a power of 80%, when using an estimated standard deviation based on previous research on QUEST (21, 22, 25, 26).
Descriptive statistics were used to summarize results. χ2 tests were utilized when comparing proportions between groups. The response alternative for the assistive device condition “Never used” (4 responses) was not included when comparing characteristics of the assistive device. This was done in order to create a large enough group for statistical analysis. In addition, the 4 response options “Always” and “Often”, and “Seldom” and “Never” were collapsed into two. Alternatives “Yes, with difficulty” and “No, not at all” were combined into one due to small numbers when comparing mobility. Mann-whitney U tests (2-sided) and Kruskal-wallis tests were used when comparing distributions of age, time (in h) using the assistive device, and satisfaction between groups. p-values less than 0.05 were considered to be statistically significant. Only statistically significant differences between groups are reported in the results. SPSS 19 was used for statistical analyses. Manifest content analysis was conducted on comments related to problems and limitations (27).
To explore which factors were associated with satisfaction with as-sistive device and services, linear regression analyses were conducted with satisfaction with assistive device and services as dependent vari-ables. First, simple linear regression analyses of 21 variables were conducted separately for the two outcomes. Variables with p-values less than 0.1 were included in a first multiple regression analysis. In an iterative manner, those variables in the first multiple regression analysis that indicated significant associations (p < 0.1) were added to a second multiple linear regression analysis. In the final stage, only the variables with p < 0.05 were entered into the final multiple regression model. Since the variables “assistive device causes pain” and “wounds/skin irritations” were strongly correlated they were col-lapsed into a single variable in the regression models in order to avoid problems with collinearity.
RESULTS Assistive devices
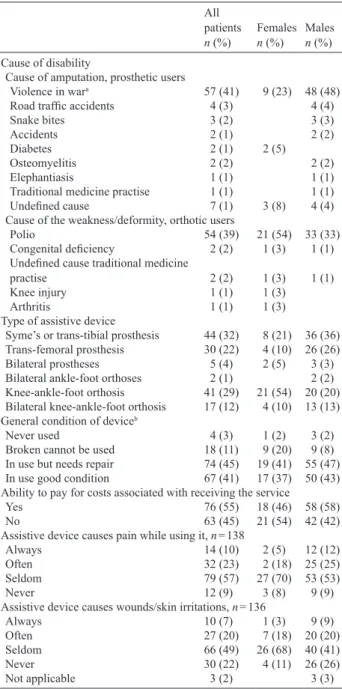
Of 139 patients, 58% were prosthetic users and 42% were or-thotic users (Table II). The most common causes of disability were violence and polio. Patients used their assistive devices for a mean of 9 h a day (range 0–14 h). Eighty-six percent of assistive devices were in use by patients; however, approxi-mately half of these assistive devices needed repairs. Fourteen percent were either completely broken or never used. Only 17% of patients had a regular income, 11% of the women and 20% of the men. Forty-five percent could not pay the costs related to receiving or repairing an assistive device. One-third of the patients “always or often” experienced pain or wounds related to use of the device (Table II).
Forty-one percent (n = 55) preferred to use crutches rather than a prosthetic or orthotic device, 35% (n = 48) used crutches together with their device, and 24% (n = 32) did not use crutches. Eighty-nine percent of patients (n = 123) had no spare prosthetic or orthotic device, and 20% (n = 28) had a wheelchair.
Mobility and experienced difficulties
Table III presents patients’ responses to questions concerning mobility. The majority of patients could walk more than 1 km when using their prosthetic or orthotic device. Less than half could manage this distance without using their prosthesis or orthosis. The majority could move around in their home and
Table II. Cause of disability, type and condition of assistive device and
pain (n = 139)
All patients
n (%) Females n (%) Males n (%)
Cause of disability
Cause of amputation, prosthetic users
Violence in wara 57 (41) 9 (23) 48 (48) Road traffic accidents 4 (3) 4 (4)
Snake bites 3 (2) 3 (3)
Accidents 2 (1) 2 (2)
Diabetes 2 (1) 2 (5)
Osteomyelitis 2 (2) 2 (2)
Elephantiasis 1 (1) 1 (1)
Traditional medicine practise 1 (1) 1 (1) Undefined cause 7 (1) 3 (8) 4 (4) Cause of the weakness/deformity, orthotic users
Polio 54 (39) 21 (54) 33 (33)
Congenital deficiency 2 (2) 1 (3) 1 (1) Undefined cause traditional medicine
practise 2 (2) 1 (3) 1 (1)
Knee injury 1 (1) 1 (3)
Arthritis 1 (1) 1 (3)
Type of assistive device
Syme’s or trans-tibial prosthesis 44 (32) 8 (21) 36 (36) Trans-femoral prosthesis 30 (22) 4 (10) 26 (26) bilateral prostheses 5 (4) 2 (5) 3 (3) bilateral ankle-foot orthoses 2 (1) 2 (2) Knee-ankle-foot orthosis 41 (29) 21 (54) 20 (20) bilateral knee-ankle-foot orthosis 17 (12) 4 (10) 13 (13) General condition of deviceb
Never used 4 (3) 1 (2) 3 (2)
broken cannot be used 18 (11) 9 (20) 9 (8) In use but needs repair 74 (45) 19 (41) 55 (47) In use good condition 67 (41) 17 (37) 50 (43) Ability to pay for costs associated with receiving the service
yes 76 (55) 18 (46) 58 (58)
No 63 (45) 21 (54) 42 (42)
Assistive device causes pain while using it, n = 138
Always 14 (10) 2 (5) 12 (12)
Often 32 (23) 2 (18) 25 (25)
Seldom 79 (57) 27 (70) 53 (53)
Never 12 (9) 3 (8) 9 (9)
Assistive device causes wounds/skin irritations, n = 136
Always 10 (7) 1 (3) 9 (9)
Often 27 (20) 7 (18) 20 (20)
Seldom 66 (49) 26 (68) 40 (41)
Never 30 (22) 4 (11) 26 (26)
Not applicable 3 (2) 3 (3)
aGunshot (n = 37), landmine (n = 7), armbush (n = 5), machete attack (n = 5), bomb (n = 3).
bAssessment made by certified prosthetist and orthotist, author LM. Twenty-four patients had assistive devices for both right and left legs, resulting in a total of 163 assistive devices for 139 patients.
Traditional medicine is practices based on the theories, beliefs, and experiences indigenous to different cultures and used in the maintenance of health or treatment of illness.
441 Mobility and satisfaction among prosthetic and orthotic users
rise from a chair, even though they experienced difficulties in doing so. Difficulties were reported while walking on uneven ground or up and down hills. Only a few patients could not walk on stairs or get into a car or bus, even though approximately half experienced difficulties while performing these activities. Forty percent of patients reported that they could not access the workshop or rehabilitation services due to distance, costs, availability of transport or lack of a personal assistant (Table III). Satisfaction with assistive device and service
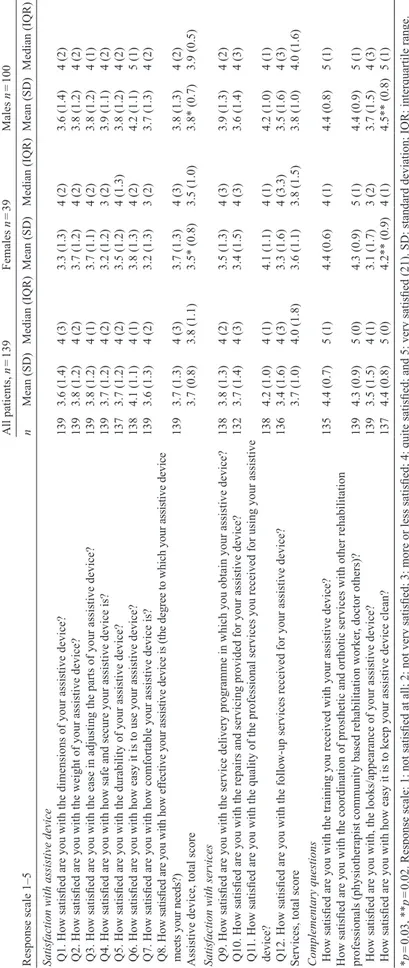
based on QUEST, the total mean score for satisfaction with assistive devices, as well as for service, was 3.7 (Table IV).
Scores for all complementary questions on satisfaction were high.
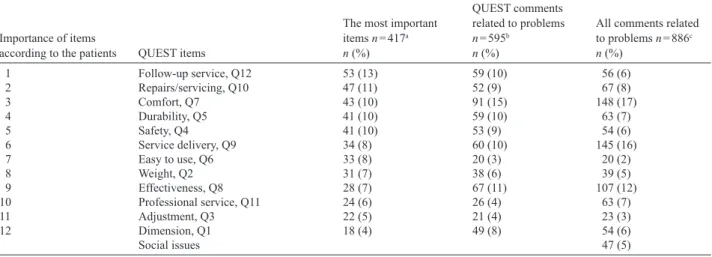
Eighty percent of patients indicated that staff gave them the opportunity to express their views about their device and 83% trusted and had confidence that their prosthetist/orthotist was capable of delivering a quality service. Participants were asked to choose what they considered to be the 3 most important items included in QUEST. They reported that provision of follow-up services was most important, followed by access to repairs/ servicing and comfort (Table V).
The patients made 886 comments related to problems with their assistive devices or service delivery (Table V). The main problems were pain experienced when using their assistive device (148 comments from 78 respondents), problems related specifically to service delivery, including the fact that they could not afford the fees (145 comments from 94 respondents), and limitations in the effectiveness of their assistive device (107 comments from 69 respondents).
Sub-group comparisons
Orthotic vs prosthetic users. Orthotic patients reported sig-nificantly more difficulty in walking and moving around, with the exception of walking on hills. Compared with prosthetic patients, patients using orthoses had more difficulty or were unable to rise from a chair (45% vs 17%, p < 0.001), move around their home (37% vs 8%, p < 0.001), walk on uneven ground (78% vs 56%, p = 0.01) and walk on stairs (86% vs 52%, p = 0.001). The orthotic group reported difficulties or inability to get into a car, (63% vs 35%, p = 0.001) or bus (71% vs 35%, p < 0.001). They were also significantly less satisfied with the service provided than were prosthetic patients (mean 3.4 vs 4.0, p = 0.001) and less satisfied with the appearance of their device (median 3.5 vs 4.0, p = 0.03). It was more common to use crutches together with an orthotic device than together with a prosthetic device (51% vs 24%, p = 0.003). Orthotic patients used wheelchairs (33% vs 9%, p < 0.001) more often than prosthetic users. Orthotic patients were, on average, younger than prosthetic patients (mean age 29 vs 38 years, p = 0.001). Forty-eight percent of orthotic patients had no income com-pared with 27% of prosthetic patients (p = 0.04). They also had less possibility to access services (p < 0.001).
Level of assistive device. Patients with above-knee assistive de-vices had more difficulties walking and moving around. Compared with patients using below-knee assistive devices patients using above-knee assistive devices experienced more difficulties or were unable to rise from a chair (36% vs 17%, p = 0.02), move around their home (30% vs 2%, p < 0.001), walk on uneven ground (76% vs 47%, p = 0.001), walk up and down hills (84% vs 63%, p = 0.07), and walk on stairs (76% vs 49%, p = 0.01). Patients using above-knee assistive devices also experienced more difficulties or were unable to get into a car (54% above-knee vs 33% below-knee, p = 0.02) or bus (63% vs 31%, p = 0.01). They were less satisfied with their assistive device (mean 3.6 vs 4.0, p = 0.004) and the services received (mean 3.6 vs 4.0, p = 0.01) than patients with below-knee assistive devices. They were also less satisfied with
Table III. Mobility of prosthetic and orthotic patients (n = 139) Patients
n (%)
walking distance without assistive devicea, n = 138
Not at all, 0 m 30 (22)
A few metre 32 (23)
Approximately 100 m 22 (16)
Approximately 1 km or more 54 (39) walking distance with assistive device, n = 136
Not at all, 0 m 5 (4)
A few metre 7 (5)
Approximately 100 m 25 (18)
Approximately 1 km or more 101 (73) Ability to rise from a chair, n = 137
Yes, without any difficulty 97 (71)
Yes, with difficulty 39 (28)
No, not at all 1 (1)
Ability to move around in my home, n = 136
Yes, without any difficulty 108 (79)
Yes, with difficulty 28 (21)
No, not at all 0 (0)
Ability to walk on uneven ground/roads, n = 137
Yes, without any difficulty 46 (34)
Yes, with difficulty 77 (56)
No, not at all 13 (9)
Not applicable 1 (1)
Ability to walk up and down a hill, n = 136
Yes, without any difficulty 31 (23)
Yes, with difficulty 82 (60)
No, not at all 20 (15)
Not applicable 3 (2)
Ability to walk on stairs, n = 136
Yes, without any difficulty 45 (33)
Yes, with difficulty 84 (62)
No, not at all 6 (4)
Not applicable 1 (1)
Ability to get in and out of a car, n = 135
Yes, without any difficulty 70 (52)
Yes, with difficulty 62 (46)
No, not at all 3 (2)
Ability to get in and out of a bus, n = 135
Yes, without any difficulty 62 (46)
Yes, with difficulty 62 (46)
No, not at all 4 (3)
Not applicable 7 (5)
Possibility to access the workshop, n = 135
Completely true 80 (59)
Sometimes true 37 (27)
Completely false 18 (13)
awith no assistive device, or with crutches only.
the coordination of rehabilitation professionals than patients using below-knee assistive devices (median 4.0 vs 5.0, p = 0.04). It was more com-mon that above-knee assistive devices were not used because they were completely broken (18% above-knee vs 2% below-knee, p = 0.02) and used for a shorter time each day (mean 8 h above-knee vs 11 h below-knee, p = 0.001). It was more com-mon for patients using above-knee assistive de-vices to use crutches instead of a device than it was for those using below-knee assistive devices (46% above-knee vs 32% below-knee, p = 0.04). Use of crutches together with a prosthetic or orthotic device was also more common in patients using above-knee assistive devices (40% above-knee vs 28% below-knee, p = 0.004). Patients using above-knee assistive devices were significantly younger than those using below-knee assistive devices (mean age 30 years vs 42 years, p < 0.001). Forty-five percent of patients using above-knee assistive devices had no income compared with 19% of those using below-knee assistive devices (p = 0.01).
Demographic aspects related to assistive de-vice and serde-vice. Regarding gender, females reported fewer possibilities to access workshops than males. Thirty-four percent of females and 5% of males had no access to services, while 11% of females and 34% of males had access sometimes (p < 0.001). Females more often experienced difficulties or were unable to move around in their home (34% vs 15%, p = 0.01), walk on uneven ground (79% vs 61%, p = 0.05), and on hills (89% vs 72%, p = 0.03). Females were less satisfied with their device than males (mean 3.5 vs 3.8, p = 0.03). They were also less satisfied with how easy it was to keep the device clean (median 4.0 vs 5.0, p = 0.02).
Patients living in urban areas had signifi-cantly more difficulties walking on stairs than did patients living in rural areas (73% vs 57%, p = 0.046). Patients living in rural areas reported more often no possibilities to access services than patients in living in urban areas (69% vs 46 %, p <0.001). Patients in rural areas were less satisfied with the coordination of prosthetic and orthotic services with other rehabilitation pro-fessionals (e.g. physiotherapists, community-based rehabilitation workers and doctors) than were patients living in urban areas (median 4.0 vs 5.0, p = 0.01). Patients living in rural areas used wheelchairs more often than those in urban areas (31% vs 14%, p = 0.02).
The results for level of income show that patients with regular income used their assis-tive devices for more hours per day (mean 11
Table IV
. Results of patients’
level of satisfaction with assistive device and service
Response scale 1–5 All patients, n = 139 Females n = 39 Males n = 100 n Mean (SD) Median (IQR) Mean (SD) Median (IQR) Mean (SD) Median (IQR)
Satisfaction with assistive device Q1. How satisfied are you with the dimensions of your assistive device?
139 3.6 (1.4) 4 (3) 3.3 (1.3) 4 (2) 3.6 (1.4) 4 (2)
Q2. How satisfied are you with the weight of your assistive device?
139 3.8 (1.2) 4 (2) 3.7 (1.2) 4 (2) 3.8 (1.2) 4 (2)
Q3. How satisfied are you with the ease in adjusting the parts of your assistive device?
139 3.8 (1.2) 4 (1) 3.7 (1.1) 4 (2) 3.8 (1.2) 4 (1)
Q4. How satisfied are you with how safe and secure your assistive device is?
139 3.7 (1.2) 4 (2) 3.2 (1.2) 3 (2) 3.9 (1.1) 4 (2)
Q5. How satisfied are you with the durability of your assistive device?
137 3.7 (1.2) 4 (2) 3.5 (1.2) 4 (1.3) 3.8 (1.2) 4 (2)
Q6. How satisfied are you with how easy it is to use your assistive device?
138 4.1 (1.1) 4 (1) 3.8 (1.3) 4 (2) 4.2 (1.1) 5 (1)
Q7. How satisfied are you with how comfortable your assistive device is?
139 3.6 (1.3) 4 (2) 3.2 (1.3) 3 (2) 3.7 (1.3) 4 (2)
Q8. How satisfied are you with how ef
fective your assistive device is (the degree to which your assi
stive device
meets your needs?)
139 3.7 (1.3) 4 (3) 3.7 (1.3) 4 (3) 3.8 (1.3) 4 (2)
Assistive device, total score
3.7 (0.8) 3.8 (1.1) 3.5* (0.8) 3.5 (1.0) 3.8* (0.7) 3.9 (0.5)
Satisfaction with services Q9. How satisfied are you with the service delivery programme in which you obtain your assistive device?
138 3.8 (1.3) 4 (2) 3.5 (1.3) 4 (3) 3.9 (1.3) 4 (2)
Q10. How satisfied are you with the repairs and servicing provided for your assistive device?
132 3.7 (1.4) 4 (3) 3.4 (1.5) 4 (3) 3.6 (1.4) 4 (3) Q1
1. How satisfied are you with the quality of the professional services you received for using your assistive
device? 138 4.2 (1.0) 4 (1) 4.1 (1.1) 4 (1) 4.2 (1.0) 4 (1)
Q12. How satisfied are you with the follow-up services received for your assistive device?
136 3.4 (1.6) 4 (3) 3.3 (1.6) 4 (3.3) 3.5 (1.6) 4 (3)
Services, total score
3.7 (1.0) 4.0 (1.8) 3.6 (1.1) 3.8 (1.5) 3.8 (1.0) 4.0 (1.6)
Complementary questions How satisfied are you with the training you received with your assistive device?
135 4.4 (0.7) 5 (1) 4.4 (0.6) 4 (1) 4.4 (0.8) 5 (1)
How satisfied are you with the coordination of prosthetic and orthotic services with other rehabilitation professionals (physiotherapist community based rehabilitation worker
, doctor others)? 139 4.3 (0.9) 5 (0) 4.3 (0.9) 5 (1) 4.4 (0.9) 5 (1)
How satisfied are you with, the looks/appearance of your assistive device?
139 3.5 (1.5) 4 (1) 3.1 (1.7) 3 (2) 3.7 (1.5) 4 (3)
How satisfied are you with how easy it is to keep your assistive device clean?
137 4.4 (0.8) 5 (0) 4.2** (0.9) 4 (1) 4.5** (0.8) 5 (1) *p = 0.03, ** p =
443 Mobility and satisfaction among prosthetic and orthotic users
h) than patients with occasional income (mean 9 h), or no income (mean 7 h, p = 0.001). Patients with no income (43%) and those with regular income, (44%) reported that their as-sistive device caused them pain more frequently than those who sometimes had an income (22%, p = 0.04). Patients with no income were younger (mean age 28 years) than those with
occasional income (mean age 39 years) or regular income (mean age 37 years, p < 0.001).
Variables associated with satisfaction with assistive devices and services. Of the 21 initial variables, 17 demonstrated a signifi-cant association with satisfaction with assistive device (p < 0.1),
Table VI. Variables included in regression analysis
Independent variables included in simple regression analysis
Satisfaction with assistive device p-value Satisfaction with service p-value
Sex (female; male) 0.030a 0.245
Age 0.077a 0.722
Rural/Urban areas (Living in cities; Living in villages) 0.406 0.075a Level of income
(No income; Regular income from employment) 0.053a 0.714
(No income; Sometimes income) 0.044a 0.833
Ability to pay for costs associated with receiving the service appliances, accommodation travel (yes; No) 0.008a < 0.001a
Type of assistive device (Prosthesis; Orthosis) 0.103 0.001a
Level of assistive devices (below-knee assistive devices; Above-knee assistive devices) 0.006a 0.013a General condition of device
(In use good condition; broken cannot be used)
(In use but needs repair; broken cannot be used) < 0.001
a
0.194 < 0.001 a 0.017a
hours assistive device is used per day < 0.001a 0.028a
Do you use crouches? (Yes, instead of device and Yes, together with device; No) 0.025a 0.120 Do you use a wheelchair? (Yes, instead of device and Yes, together with device; No) 0.384 0.383 walking distance without assistive device (Not at all and Few m; Approximately 100 m and Approximately 1 km or
more) 0.489 0.805
walking distance with assistive device (Not at all and Few m; Approximately 100 m and Approximately 1 km or
more) 0.007a 0.613
Ability to rise from a chair (Yes, without any difficulty and Yes, with difficulty; No, not at all) 0.045a 0.945 Ability to move around in my home (Yes, without any difficulty and Yes, with difficulty; No, not at all) 0.001a 0.006a Ability to walk on uneven ground/roads (Yes, without any difficulty and Yes, with difficulty; No, not at all) 0.001a 0.001a Ability to walk up and down a hill (Yes, without any difficulty and Yes, with difficulty; No, not at all) 0.001a 0.317 Ability to walk on stairs (Yes, without any difficulty and Yes, with difficulty; No, not at all) < 0.001a 0.012a Ability to get in and out of a car (Yes, without any difficulty and Yes, with difficulty; No, not at all) < 0.001a 0.003a Ability to and get in and out of a bus (Yes, without any difficulty and Yes, with difficulty; No, not at all) 0.006a 0.005a Assistive device causes pain and or wounds/skin irritations while using it (Always and Often; Seldom and Never) 0.001a 0.831 aVariables showing a significant association with the dependent variables in simple regression analysis p < 0.10, these variables were entered into first multiple regression analysis.
Table V. The most important items in the Quebec User Evaluation of Satisfaction with Assistive Technology (QUEST) questionnaire and comments
related to problems according to the patients
Importance of items
according to the patients QUEST items
The most important items n = 417a n (%) QUEST comments related to problems n = 595b n (%)
All comments related to problems n = 886c n (%) 1 Follow-up service, Q12 53 (13) 59 (10) 56 (6) 2 Repairs/servicing, Q10 47 (11) 52 (9) 67 (8) 3 Comfort, Q7 43 (10) 91 (15) 148 (17) 4 Durability, Q5 41 (10) 59 (10) 63 (7) 5 Safety, Q4 41 (10) 53 (9) 54 (6) 6 Service delivery, Q9 34 (8) 60 (10) 145 (16) 7 Easy to use, Q6 33 (8) 20 (3) 20 (2) 8 weight, Q2 31 (7) 38 (6) 39 (5) 9 Effectiveness, Q8 28 (7) 67 (11) 107 (12) 10 Professional service, Q11 24 (6) 26 (4) 63 (7) 11 Adjustment, Q3 22 (5) 21 (4) 23 (3) 12 Dimension, Q1 18 (4) 49 (8) 54 (6) Social issues 47 (5)
aPatients were asked to choose the 3 most important QUEST items. bComments related to problems/limitations in the QUEST questionnaire part. cAll comments related to problems in all parts of the questionnaire.
while 11 variables demonstrated a significant association with satisfaction with service (p < 0.1) in simple linear regression analyses (Table VI). Variables that were selected for the final multiple regression model for satisfaction with assistive device (p < 0.05) were: general condition of device, pain and/or wounds, ability to walk on uneven ground and ability to get in and out of a car. Variables that were significantly associated (p < 0.05) with satisfaction with service and included in the final multiple regression model for that outcome were: general condition of device, ability to walk on uneven ground, and ability to pay for costs associated with receiving the service, accommodation, travel and general condition of the device (Table VII).
DISCUSSION
Overall, patients were quite satisfied with their prosthetic and orthotic devices and with the services provided, but experi-enced pain related to their device and limitations in desired activities. The majority of patients could physically transport themselves to the prosthetic and orthotic workshop; however, 45% reported difficulties in doing so. Access to services was further limited by lack of finances to pay fees for service provi-sion. Differences were observed between subgroups of patients regarding both satisfaction and mobility. Of interest was that orthotic patients had poorer results than prosthetic patients. Patients using above-knee assistive devices had poorer results than patients using below-knee assistive devices. women had poorer results than men.
while it is estimated that 10,000 people in Sierra Leone are in need of prosthetic and orthotic devices (4), the register used to recruit patients for this study, which included all prosthetic and orthotic facilities, included only 553 patients who were over 15 years of age and required a lower-limb prosthesis or orthosis.
This suggests that only a small proportion of those estimated to require prosthetic and orthotic services actually receive them. Possible explanations are inaccurate statistics, that people have simply not received any service or that they have not survived. The majority of patients had the ability to move around their home and on level surfaces, but had difficulties walking on uneven ground, on stairs and slopes. The ability to walk on uneven ground and slopes is essential in both rural and urban Sierra Leone as the walking surfaces are unpaved and the rainy season creates rough surfaces. Ability to walk on uneven ground was found to be associated with both satisfaction with assistive device and services. This was evident in both regres-sion analyses and in the qualitative comments made regarding limitations related to the use of the device. Considering that the environment in Sierra Leone is underdeveloped, with roads that are largely unpaved and rudimentary staircases, this finding suggests that attention needs to be focused on a device design that is appropriate to the setting and facilitates walking on uneven ground. This was also observed in a study conducted in Malawi (17). It is noteworthy that the same polypropylene technology developed by the International Committee of the Red Cross is used to produce assistive devices in both coun-tries. To facilitate mobility of patients on challenging surfaces, service providers should consider the design of the device (28–30), dynamic alignment (31) and patient training. while the majority of patients could walk long distances with their device, 41% reported that they often used crutches instead of their device. This may be due to the fact that more than half of the assistive devices needed repairs and that patients ex-perienced pain while using them. Assistive devices were not suitable for the high levels of mobility desired by patients. Pain and/or wounds were also associated with lower satisfac-tion with assistive devices. In order to address these issues in
Table VII. Factors associated with of Quebec User Evaluation of Satisfaction with Assistive Technology (QUEST) questionnaire total score for
satisfaction with assistive device and satisfaction with service in Sierra Leone
b 95% CI p-value
Model satisfaction with assistive devicea
Constant/Intercept 2.88 2.53 to 3.24
1 General condition of device
[In use good condition (1); broken cannot be used (0)]
[In use but needs repair (1); broken cannot be used (0)] 0.610.19 –0.16 to 0.540.26 to 0.97 0.0010.278 2 Pain and/or wounds [Seldom Never (1); Always Often (0)] 0.33 0.11 to 0.55 0.004 3 Ability to walk on uneven ground/roads
[Yes, without difficulties (1); Yes, with difficulty; No, not at all (0)] 0.42 0.18 to 0.66 0.001 4 Ability to get in and out of a car
[Yes, without difficulties (1); Yes, with difficulty; No, not at all (0)] 0.33 0.11 to 0.55 0.004 Model satisfaction with serviceb
Constant/Intercept 2.72 2.29 to 3.15
1 General condition of device
[In use good condition (1); Never used and broken cannot be used (0)]
[In use but needs repair (1); Never used and broken cannot be used (0)] 0.880.27 –0.21 to 0.760.37 to 1.39 0.0010.270 2 Ability to walk on uneven ground/roads
[Yes, without difficulties (1); Yes, with difficulty; No, not at all (0)] 0.59 0.27 to 0.90 < 0.001 3 Ability to pay for costs associated with receiving the service appliances, accommodation travel
[yes (1); No (0)] 0.59 0.28 to 0.90 < 0.001
aSatisfaction with assistive device adjusted R2 = 33%, F-ratio = 11. bSatisfaction with service adjusted R2 = 34%, F-ratio = 16. 95% CI: 95% confidence interval.
445 Mobility and satisfaction among prosthetic and orthotic users the design of an assistive device, it is important that personnel
receive further training. Regression analyses demonstrated that the condition of the device was a factor associated with both satisfaction with the device and with service. This finding is consistent with results from QUEST, Table V and a previous study in Malawi (17), which indicated that follow-up services and access to repairs were considered as most important. It is interesting to note that the ability to pay for costs associated with receiving services was a factor that also contributed to satisfaction with prosthetic and orthotic service delivery. It is likely that a lack of finances is a major reason affecting access to follow-up services and repairs.
The cause of disability for the majority of orthotic patients was polio. This group were less satisfied, had less ability to walk and move around, had a lower income and experienced more difficulties accessing services than prosthetic patients. Polio patients in Sierra Leone have low status, are assigned less value (5, 15) and experience social exclusion from society (11). The severity of disability can also have affected results since orthotic patients more often have a disability involving the en-tire lower extremity. Previous prosthetic and orthotic research in developing countries has primarily focused on prosthetic patients (10, 13, 32). Our results indicate that more attention should be given to orthotic patients and orthosis design.
Female patients were clearly less mobile and less satisfied with their assistive devices than male patients, they reported fewer possibilities to access prosthetic and orthotic services, less ability to move around in their homes and less ability to walk on challenging surfaces. Female patients were also less satisfied with how easy it was to keep their device clean. A large proportion of females were polio patients, using orthotic devices which may have influenced the results. Females also have less educational opportunities (14) and previous research reported that 50% of females in contrast to 34% of males with disabilities in Sierra Leone had never attended school (8). women with disabilities in Sierra Leone have also been shown to have less access to public health care (7).
While patients in Sierra Leone reported being quite satisfied with their device they did report numerous problems with both their device and the service they received. It is important to recognize that satisfaction can be affected by expectations, previous experiences, life conditions and healthcare values (33). It is likely that patients in the present study had relatively low expectations, and subsequently it is important that reported satisfaction is not used as the sole quality indicator.
It was demonstrated that persons living in rural areas experi-enced more difficulties when walking on stairs than those from urban areas. This result should be considered with caution as it is possible that stairs are not particularly common in rural areas. An analysis was performed on patients who use above-knee assistive devices vs those who use below-knee assistive de-vices. In both categories prosthetic and orthotic patients were combined in the analysis. It can be debated that the functional limitation experienced by users of above-knee assistive devices and below-knee assistive devices are different. Unfortunately our data-set is too small to allow for separate comparisons of
below- and above-knee amputees and below- and above-knee orthotic devices.
Krio is mainly a spoken language and it was a challenge to translate several words in the questionnaire. The translation process included many discussions and when no specific word was available a phrase was used instead. The result was a ques-tionnaire that patients understood well and they could answer all questions despite low literacy levels. Patients in the present study were largely recruited via key contacts and home visits. Very few patients had a telephone number listed in their files. It is subsequently unlikely that the method of recruitment has resulted an overrepresentation of people with telephones who could potentially be socioeconomically better off.
It is noteworthy that multiple statistical tests were carried out when comparing groups, which increases the likelihood of type 1 errors. For this reason, weak or solitary significances should be considered with some caution and our conclusions are thus based on the overall patterns of significant differences. Statistically significant differences between groups indicated that we had enough power to detect clinically relevant group differences.
In conclusion patients reported high levels of mobility while using their device although they experienced pain and difficulties walking on challenging surfaces. Patients were quite satisfied with their assistive device and with the services provided but at the same time reported many problems. Lower satisfaction with assistive devices was associated with pain and/or wounds and ability, condition of the device, ability to walk on uneven ground and to get in and out of a car. Lower satisfaction with service was associated with the condition of the device, ability to walk on uneven ground and ability to pay for costs associated with the service. Orthotic patients, women and patients using above-knee assistive devices had the poorest results. Limitations in the effectiveness of assistive devices and issues with service delivery programmes, such as limited access to follow-up services and repairs, were also issues desired to be addressed by professionals within the rehabilitation field as well as health policymakers. Implementation of the Conven-tion of Rights for Persons with Disabilities regarding personal mobility and access to rehabilitation service requires urgent attention in Sierra Leone.
Recommendations
Patients’ self-reports of mobility and satisfaction with assistive devices revealed that the design and manufacture of prosthetic and orthotic low-cost technology needs be improved in order to facilitate or enable ambulation on challenging surfaces and to reduce pain and wounds. Quality of assistive device and service delivery can be enhanced by addressing the level of staff education, where a higher proportion of staff providing the services should have a minimum of 3 years education. Attention needs to be directed towards access to follow-up services and repairs and to address the general condition of assistive devices. Interventions targeting females and orthotic patients should be implemented in order to reduce discrimina-tion against these groups.
ACKNOwLEDGEMENTS
The authors gratefully acknowledge assistance provided by handicap International Sierra Leone and the headquarter rehabilitation technical unit which provided administrative and logistic support. The authors would like to thank yann Cornic, Sophie Dechaux, Ibrahim Richard bangura, Arthur Saidu, Abdul Rahman A Sannoh and Isabelle Urseau. The authors would also like to acknowledge staff at rehabilitation centres who provided support with patient recruitment. Mosa Mansaray bo Regional Rehabilita-tion Centre, Abu Amara and Mary bangura Koidu Governmental hospital Rehabilitation Unit, bambino Suma, Prosthetic Outreach Foundation, Government hospital Makeni Rehabilitation Department and Staff at National Rehabilitation Centre Freetown. Funding for this research was provided by the School of health Sciences, Jönköping University and Sparbanken Alfa’s Scholarship.
REFERENCES
1. Sierra Leone. Ministry of health Sanitation. Directorate of Plan-ning Information. Assessment of disabilities in the western area. Freetown, Ministry of health Sanitation, Directorate of Planning Information; 1999.
2. Kamara JAL, williams MLJ, Turay S, Sengeh P. Republic of Sierra Leone 2004 population and housing census: analytical report on mortality and disability: status of the population. Sierra Leone Statistics: Freetown; 2006.
3. world health Organization. whO vaccine-preventable diseases: monitoring system 2012 global summary [Internet] 2012 [cited 2012 Sep 6]. Available from: http://apps.who.int/immunization_ monitoring/en/globalsummary/timeseries/tscoveragebycountry. cfm?C=SLE.
4. United Nations. United Nations consolidated inter-agency appeal for Sierra Leone January–December 2000. Geneva: Office for the Coordination of humanitarian Affairs Complex Emergency Response branch (CER-b); 1999.
5. O’Sullivan C, MacLachlan M. Childhood disability in burkina Faso and Sierra Leone: an explortory analysis. Disability & in-ternational development: towards inclusive global health. New york: Springer; 2009.
6. Santos-Zingale M, McColl M. Disability and participation in post-conflict situations: the case of Sierra Leone. Disabil Soc 2006; 21: 243–257.
7. Trani J-F, browne J, Kett M, bah O, Morlai T, bailey N, et al. Access to health care, reproductive health and disability: a large scale survey in Sierra Leone. Soc Sci Med 2011; 73: 1477–1489. 8. Trani J-F, bah O, bailey N, browne J, Groce N, Kett M. Disabil-ity in and around urban areas of Sierra Leone. London: Leonard Cheshire Disability; 2010.
9. United Nations. Convention on the Rights of Persons with Dis-abilities and optional protocol. 2007 [cited 2012 Jul 13]. Available from: www.un.org/esa/socdev/enable/conventioninfo.htm. 10. borg J, Lindström A, Larsson S. Assistive technology in developing
countries: national and international responsibilities to implement the Convention on the Rights of Persons with Disabilities. Lancet 2009; 374: 1863–1865.
11. Government of Sierra Leone. Ministry of health and Sanitation and handicap International. Policy guidelines: pysical and reha-bilitation medicine in Sierra Leone. Government of Sierre Leone: Freetown; 2011.
12. Lambert M-L, Francois I, Salort C, Slypen V, bertrand F, Tonglet R. household survey of locomotor disability caused by poliomy-elitis and landmines in Afghanistan. bMJ 1997; 315: 1424–1425. 13. borg J, Lindström A, Larsson S. Assistive technology in develop-ing countries: a review from the perspective of the Convention on the Rights of Persons with Disabilities. Prosthet Orthot Int
2011; 35: 20–29.
14. Maclure R, Denov M. Reconstruction versus transformation: post-war education and the struggle for gender equity in Sierra Leone. Int J Educ Dev 2009; 29: 612–620.
15. Magnusson L, Ahlström G. Experiences of providing prosthetic and orthotic services in Sierra Leone – the local staff’s perspective. Disabil Rehabil 2012; 34: 2111–2118.
16. world health Organization, International Society of Prosthetics and Orthotics. Guidelines for training personnel in developing countries for prosthetics and orthotics services. Geneva: whO and ISPO; 2005. Available from: http://whqlibdoc.who.int/publica-tions/2005/9241592672.pdf.
17. Magnusson L, Ahlström G, Ramstrand N, Fransson EI. Malawian prosthetic and orthotic users’ mobility and satisfaction with their lower-limb assistive device. J Rehabil Med 2013; 45: 385–391. 18. hellbom G, Öberg b, beekum Tv, Oortwijn w, brodin h,
Lorent-sen O, et al. DE 3101 EATS Efficiency of Assistive Technology and Services brussels: Telematics Applications Programme Sector Disabled and Elderly; 2000. Final Report. Appendices.
19. Gauthier-Gagon C, Grise MC. Tools for outcome measurement in lower limb amputee rehabilitation. Montreal: Universite de Montreal; 2001.
20. heinemann Aw, bode RK, O’Reilly C. Development and meas-urement properties of the Orthotics and Prosthetics Users’ Survey (OPUS): a comprehensive set of clinical outcome instruments. Prosthet Orthot Int 2003; 27: 191–206.
21. Demers R, weiss-Lambrou b, bernadette S. Quebec User Evalua-tion of SatisfacEvalua-tion with assistive Technology QUEST version 2.0 an outcome measure for assistive technology device. webster, Ny: Institute for Matching Persons and Technology; 2000.
22. wessels RD, De witte LP. Reliability and validity of the Dutch version of QUEST 2.0 with users of various types of assistive devices. Disabil Rehabil 2003; 25: 267–272.
23. world health Organization. Process of translation and adaptation of instruments. 2007 [cited 2012 March 26]. Available from: http:// www.who.int/substance_abuse/research_tools/translation/en/. 24. world health Organization. Research ethics committees: basic
consepts for capacity building. Geneva: whO; 2009 [cited 2012 July 13]. Available from: www.who.int/ethics/publications/en/. 25. Demers L, Monette M, Lapierre y, Anorln DL, wolfson C.
Reli-ability, validity, and applicability of the Quebec User Evaluation of Satisfaction with assistive Technology (QUEST 2.0) for adults with multiple sclerosis. Disabil Rehabil 2002; 24: 21–30. 26. Chan SC, Chan AP. User satisfaction, community participation and
quality of life among Chinese wheelchair users with spinal cord injury: a preliminary study. Occup Ther Int 2007; 14: 123–143. 27. Krippendorff K. Content analysis as introduction to its
methodol-ogy. 2nd ed. London: Sage Publications; 2004.
28. Radtka SA, Oliveira Gb, Lindstrom KE, borders MD. The kin-ematic and kinetic effects of solid, hinged, and no ankle–foot orthoses on stair locomotion in healthy adults. Gait Posture 2006; 24: 211–218.
29. Alimusaj M, Fradet L, braatz F, Gerner hJ, wolf SI. Kinematics and kinetics with an adaptive ankle foot system during stair am-bulation of transtibial amputees. Gait Posture 2009; 30: 356–363. 30. Su P-F, Gard SA, Lipschutz RD, Kuiken TA. The effects of in-creased prosthetic ankle motions on the gait of persons with bilateral transtibial amputations. Am J Phys Med Rehabil 2010; 89: 34–47. 31. Sin Sw, Cowe DhK, Cheng JCy. Significance of non-level
walking on transtibial prosthesis fitting with particular reference to the effects of anterior-posterior alignment. J Rehabil Res Dev 2001; 38: 1–6.
32. Andrysek J. Lower-limb prosthetic technologies in the developing world: a review of literature from 1994–2010. Prosthet Orthot Int 2010; 34: 378–398.
33. Pascore CG. Patient satisfaction in primary health care: a literature review and analysis. Eval Program Plann 1983; 6: 185–210.