VTlnotat
Nummer: V 71 -
Datum: 1988-09-15
Titel: FATIGUE CHARACTERISTICS OF ASPHALT CONCRETE MIXTURES
Författare: Sawfat F. Said
Avdelning: Vägavdelningen
Projektnummer: 4130503-8
Projektnamn: Bitumenbundna materials mekaniska egenskaper
Uppdragsgivare: Vägverket
Distribution:KYbegränsad/
(db e
s
Statens väg- och trafikinstitut
Veatg-och Trafik-
Pa:58101 Linköping. Tel. 013-204000. Telex50125 VTISGIS. Telefax013-14 1436
Väg-och Trafikinstitutet Projekt nr. 4130503-8
FATIGUE CHARACTERISTICS OF ASPHALT CONCRETE MIXTURES
TABLE OF CONTENTS . -0
N
N
P
N
N
N
N
b -i -O -D -h -t _ m r r wh o LP
PP
NN
PN
N
W N * -N k-F
ABSTRACT IntroductionFactors Influencing Fatigue Resistance Mix variables Bitumen Aggregate influence Filler Void content Stiffness Environmental variables Temperature Moisture content Test condition Loading mode
Fatigue life definition Loading history
Testing Apparatus
Discussion and conclusions References
ABSTRACT
This report presents the state of the art in investigating fatigue cracking of asphalt mixtures, due to repeated load applications in the laboratory. A review of research relating to bitumen content and type, aggregate, filler, void content, mix stiffness, temperature, and mois-ture content is presented. The effect of test conditions such as controlled-stress or controlled-Strain mode, rest period, and simple or compound loading upon the fatigue reSponse of asphalt concrete is illustrated. Fatigue test apparatus such as two-, three-, and four- point bending test, wheel tracking machine, indirect tensile test, triaxial, direct tension, and push-pull test are reviewed.
It is concluded from the comparisons between different apparatus that the test apparatus has a minor effect on fatigue results. Therefore it is reasonable to use the apparatus which is most economical and practical. An acceleration in fatigue testing (for example, testing at high loading speed with large stresses and/or without rest periods) could give unreliable fatigue results if the effect of such variables is not already
known. Therefore the test conditions must be chosen with care.
Neither the controlled-stress test nor the controlled-strain test can simulate the actual compound loading conditions that occur in the field. Nevertheless, the controlled-stress test is more reliable and practical
than the controlled-strain test.
More attention is desirable concerning the superposition effect of the variables influencing the fatigue resistance of the asphalt materials, which could induce a dramatic change in fatigue life.
INTRODUCTION
With the deve10pment in analytical design of pavement
structure, there is an increasing demand for knowledge of
mechanical porperties of the various pavements' elements. One of these pr0perties is the fatigue resistance of the aSphalt concrete mixtures, in order to use this in analytical flexible pavement design methods.
This stydy presents the state of the art in investigating fatigue cracking of aSphalt concrete mixtures due to repeated load applications in a laboratory.
Mix variables such as bitumen type and content affect the fatigue character to a high degree. The influence of aggregate grade, texture and type could result in a different fatigue resistance for asphalt concrete. Filler content has shown an optimum value for maximum fatigue life. A change in void content of a mix is a consequence of changes in compaction level, binder content or aggregate gradation. A minor change in void content may induce a large change in fatigue life of asphalt concrete.
The effects of environmental variables such as temperature, which has a vital role, and moisture on fatigue life have been illustrated. An attempt has been made to clarify the essential effect of test conditions for fatigue response of asphalt materials. The fatigue results are a function of the loading mode. The fatigue life found in controlled-strain mode may be several times the fatigue life found in controlled-stress mode at the same strain level. The loading history such as rest period, simple or compound loading, Speed of loading and loading pattern effects on test results has been demonstrated.
Various types of test apparatus used in fatigue tests and their differences have been reviewed. These include bending tests, wheel tracking machine, indirect tensile test, triaxial cylinder, direct tension and push-pull test.
2.1 2.1.1
Mix Variables Bitumen
Bitumen type and content are the most important mix variables which influences the mechanical pr0perties of asphalt concrete mixtures through its content and grade.
Bitumen content
The effect of bitumen content on fatigue character and stiff-ness modulus of aSphalt mixtures has been investigated by Monismith et al (l,2,3), Pell et al (4,5,6,7), Adedimila ör
Kennedy (8) and Barksdale ö: Miller (9). These investigations
indicated that there is an optimal asphalt content for fatigue
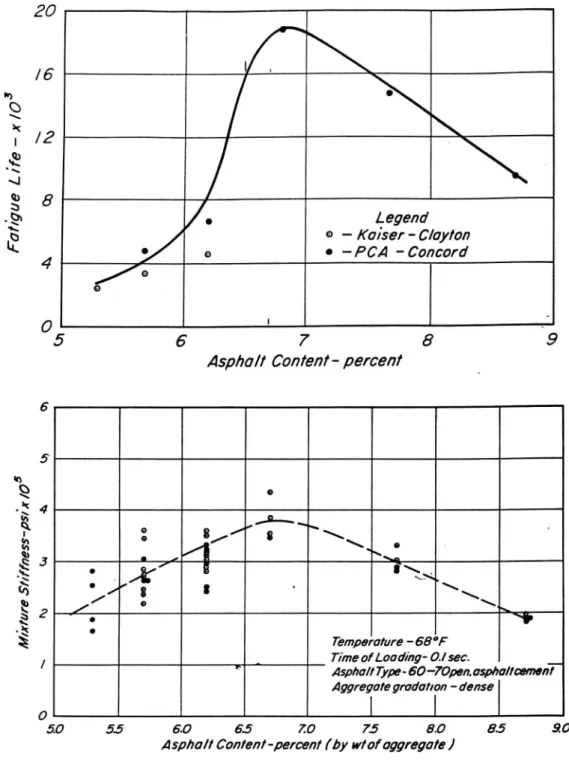
life and stiffness modulus of mixes. Figure (l) indicates that
maximum fatigue life occurs at the asphalt content resulting in the highest stiffness of the mixture, tested by flexure method at constant stress 150 psi (1.03 MPa), with 60-70 pen. asphalt type. Figure (2) shows results obtained by the rotating bending test with 197 pen. bitumen at constant stress 0.48 MPa. There is a similarity to Figure (l) but the maximum fatigue life occurs at a slightly higher bitumen content than that resulting in the highest stiffness modulus. Figure (3) shows the bitumen content
- life relationship for a mix with 40/50 pen. bitumen. A
significant change in fatigue life may occur with bitumen
content change even over a narrow range. Figure (4) shows the effect of asphalt content on fatigue life at different stress levels by indirect tensile test (constant - stress mode), which also indicates a definite optimum asphalt content for maximum fatigue life. According to Barksdale and Miller (9) a small increase in a5phalt content of a mix can greatly increase the fatigue life of the mixture. The fatigue life was significantly increased up to an aSphalt content of at least 5.5 percent tested on black base mix in flexure test at constant load at 80°F (27°C). From the above discussion, it is concluded that a change in asphalt content of a mix of _+_ 0,2 percent, as allowed by BYA
(10), see Table (I), could change the fatigue life by more than
20 /6 \ n, o
9
< . | /2 \1 g 8 - 9' /o 4898/70' B 0 - Kalser - Clayton LL 4 0 o 0 - PGA - Concord /o 0 0 ' . 5 6 7 8 9Asp/ml! Come/;f - percenr
6 5. 'o Q 0 i* 4 a 0 /' ,ia-ä \ ä 9 8/ 8 \ \ _ 0
g 3
. , få
x.,
5
- X,
*X
?8 ' 2' g 8 ' i \ \'e
/
°
\<
.g 2 v 0 XW \ 0 § Temperature - 68 '7-'l 4 Time ofLoading- 0./ sec. __
"" Asp/ml! Type- 60-70pen. aspha/tcvmanr
Aggregafe gradahon -dense
0
I
I
5.0 5.5 6.0 6.5 7.0 75 8.0 8.5 .9.0
Asp/;all Con/ent -percenf (by w! ofaggregafe 2
Fig. 1. Effect of asphalt content on fatigue life and initial stiffness modulus (Ref. 1).
Stress = 04 8 N/mm2 /
4
'
/
_-4/ Pe rc en ta ge bi nd er co nt en t l.102 103 104 105 106 107
(a) Cyc|es to failure, N
8,000 7,000 6,000 -Stress = 048 N/mm2 / \
d\
5,000 7 4,000 ' I \ 3,000 / \ 0 1 2 3 4 5 6 7 8 9 10(b) Percentage binder content by wenght
A
Dyn am ic st if fn es s (N /m mz)Fig. 2. Effect of binder content on fatigue life and dynamic
.Testing temperature o 10°'C Speed 1000 (cv/min Testing Old . machine N°'3 å Stress 155 ä O'max [bt/inz c V°id Vams E content å Indvidual results 0 'Mean results X å"
;i
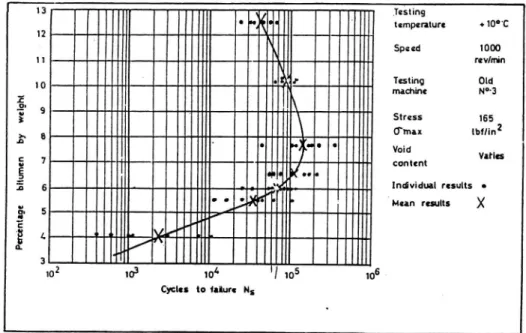
10" 105 Cycle: to falun N;Fig. 3 Relationship between :fatigue life and bitumen content
(Ref. 5).
Tab. l Permissible deviation of asphalt content from prescribed
value (Ref. 10)
Max aggregate size
Testing in plant Testing behind
or in trough finisher _<_l6mm>l6mm §l6mm>16mm Mean of three samples taken consecutively, : 0.2 i 0.4 i 0.3 i 0.5 % by weight. Value of indi- + 0.4 + 0.6 i 0.5 i 0.7 vidual sample, 0/0 by wight.
F o h g ue Li fe , cyc le s [ 1 1 1 1 1 1 Effects of a (Ref 8). 40 " O. Limestone ---- Grovel Testing Temperature =75°F Aspholt Type = AC-IO
_
l l l
5 6 7 8
Asphol! Content, "10 by wt of tolol muxture
- Bitumen Type
The effect of bitumen grade on fatigue resistance of asphalt concrete mixtures has been studied by various investigators. Monismith et al (1,2) have concluded that the mix with hardest asphalt cement type has the longest fatigue life and the flattest slope in stress versus fatigue life relationship. This conclusion is correct even for the initial strain versus fatigue life relationship, but only at relatively low stresses, see Figure (5). These data were found by controlled stress-test on California medium grading aggregate with 6 percent aSphalt cement.
/WOO E 5,000 2 05-00
i 1000 '0
9 M-Q 2 500 50..\ \ \ (73 E** IE 0
Näs
'h 50 _M_ E t s . lo/0I /0J 4 5 C 7 [0 /0 /0 /0 /0000 T I000 --- -
4
-5
l
*
-§
I
2
.3 /,000 _ i -Q ! § 500 --- _-.- . _ i 2 i:e
r
-o; ha .s 100 --« -L
.S 501
.\
40-50 tu _ - I 4.: \\60-70 ' . 05-00 [0 l A 3 4 I 5 C 7 /0 IO /0 /0 /0 [0 App/:Canons Ia Failure - A;Fig.5 Effect of asphalt penetration on the mixture fatigue life
bitumen has shown longer fatigue life and flatter slope in the stress - fatigue life relationship.
Bazin and Saunier (ll) have represented the effect of bitumen grade on fatigue life in initial strain versus fatigue life rela-tionship, see Figure (6), found by constant stress test on trape-zoidal shaped specimens at lO°C. These results agree with the results found by Monismith et al, that the harder bitumen produces a longer mix life, at lower strains.
However, Arand (12) has found that the effect of bitumen hardness on the fatigue life of asphalt pavements is a function of temperature, when the thermal induced tensile stresses
(temperature gradient -lOOC/h) superimposed with bending
stresses caused by traffic loading.
ull 10°» SANDSHEET 40/50 ---- -- smosueer 100/220 _-_ oense mx 40/50 --- oense Mix 100/220 107\ \ \
\ \ consnm STRESS AT 1o°c
\ \\ 50 0/5
Fig. 7
Figure (7) shows the number of load applications versus
tem-perature as a result of bending stress, as well as resultant stresses (bending stress + thermally induced stresses). The
fatigue strength (N) is calculated theoretically. The number of
load applications to failure are decreased at low temperatures
when the effect of thermal stresses are reSpected. Figure (8)
shows the fatigue strength as a function of temperature for asphalt mixtures with two different asphalt types. The hard bitumen serves better at higher temperature than soft bitumen, while at low temperature the advantages are the opposite. This is due to the asphalt pavements showing increasing thermal tensile stresses with drops in temperature, the thermal induced stresses in the asphalt material being larger with harder bitu-men than with softer bitubitu-men at the same temperature.
2 1010 I 5 be Ls_ KQ/âe .5 3:e., OJ är 10' \ á . u.. ef:
(09)/
X
-107 å - \§6/
\
0 .1°°
\
105 N 10* -30 -20 -10 0 10 20 30 temperature T in °C- thickness of asphait 'layer-s d = 22 cm
- wheel load P = 50 kN
- pressure ' p = 0,707 N/mmz
- dynamic moduius of unbound layer-s Edyn = 400 N/mmz
- softening point ring and ball SP = 50 °C
- penetration pen = 80 Ulm/10
Fatigue strength - temperature relationship, with and without thermal stresses (Ref. 12).
Fig. 8 2.1.2 fo ti gue sl re ng lh vj 'N V L/-_ 0
\ i
/7'
'x
/g
./
i 11/ 26:1 \ 0I -30 -20 -10 0 10 20 N temperature T in °C
- ghickness of asphalt layers d = 22 cm
- wheel load P = 50 k" - pressure p = 0,707 N/m'
- dynamc modulus of unbound layers Edyn = 180 NW
- softemng pomt ring and ball SP = 50/65 °C - perfetrahon pen = 30/20 :ma/10
Fatigue life - temperature relationship under bending + thermal stresses. (Ref. 12)
Aggregate Influence
The aggregate materials influence the behavior of a mixture probably through its gradation and type. The majority of asphalt concrete volume consists of aggregate material. However, there are studies by various investigators which indicate the negligible or very slight influence of aggregate materials on fatigue resistance of aSphalt concrete mixtures. These include Monismith et al (l,2,3,13,14), Pell et al (4,5,6,7,), Barksdale and Miller (9), Bazin and Saunier (l 1) and Kirk (15).
From the literature review, it seems that the investigations of the effect of aggregate on mixture characters have been some-what limited, because desired changes in aggregate gradation or type result in associated changes in other variables. For exam-ple, a change in aggregate gradation produces a change in air void content and the Optimal aSphalt content, which in turn has a dominant effect on stiffness modulus and fatigue resistance of mixes. However, the investigators concluded that for good fatigue performance and high stiffness an aggregate should be
ll
crushing strength to prevent fracture during compaction, a coarse surface texture, well graded, and dense to give maxi-mum density. Monismith et al (13) concluded that, aggregate Characteristics are dependent on the loading conditions and the thickness of the aSphalt layer. The surface texture has little
influence on thick pavements ( :4 in) and no influence on thin
pavements ( _<_2 in). Dense gradation is recommended for thick
pavements and open or gap-graded aggregate for thin
pave-ments.
In contrast to the references cited above, Jimenez and
Galla-way (16) and Kim et al (17) indicated the importance of
aggregate quality for fatigue life. Jimenez shows in Figure (9) the beneficial effect of a rough-textured aggregate (R-l) in comparison with a smooth textured aggregate (R-4), when
testing at different aSphalt content, (constant - stress mode).
_ 10° (D l l l -W m 0. ' I I II A I N UMB E R or LOAD AP PLIC ÅTIO NS AT FAlL URE no3 1 . , _hL 6.0 _ 55 70 25 ED ASPHALT CONTENT,%
Asphalt content vs. number of load applications at failure, Fig. 9
Kim has studied the effect of aggregate type on fatigue life at two different compaction levels with conditioning specimens by freeze - thaw cycles to evaluate the influence of moisture. Dynamic diametral test (lndirect tensile test) was used with probably constant stress (unable to accurately determine the loading mode). Figure (10) shows strain - repetitions to failure
relationships for a low quality aggregate (North Oakland
-Sutherlin) with low resilient modules and a good quality
aggre-gate (Castle Rock - Ceder Creek) with high resilient modulus.
The authors have used a parameter called the conditioning effectivness factor (CEF) to evaluate the aggregate quality. The CEF parameter is defined as:
CEF: RCLmod/ (Nf, conditioned/ Nf, as-compacted)
Where
Modulus of conditioned sample RCLmod =
Modulus of as-compacted sample
Nf,conditioned = number of load applications to failure for
conditioned sample at 50 microstrain
Nf,as-compacted number of load applications to failure for
as-compacted sample at 50 microstrain A high value of CEF represents poor quality aggregate and a low value of CEF represents good quality aggregate to condi-tioning cycles.
13
I IIIIIIH I IIITTTTI I IIIIHII
15°- _ As :moacted "' 4.:'- "" ""' Concitmned 2 Q' lm- .-1 E 1 L S .2 5 . " I: 96: connection [I '. II: 91: comoction '. SO - v -H X 1 11111111 1 11111111 1 1'111111 103 :o4 10° 10° Reoetátvons to Failure North Oakland-Sutherlin.
I IIIIHII I IIIIIIII I TIIIIII
15° '- __ As Compactea ' ?g 9_ """' """ Conditioned -5 100 "' * _ Q 5 Ja' .2 2 .2 I: 97: connection _ _ H: 90: canoaczion '-. 50 _ \ -1 1 1111111 1 1111L111 l 1 1111111 103 ;04 ;05 :ms annons to Faiiure Castle Rock-(Seder Creek.
Flg. 10 Horlzontal tensüe stram versus number of load repetmons
2.1.3
Both aggregates are less affected after conditioning at a high level of compaction. At a low level of compaction, the high quality aggregate increased in fatigue life after conditioning when compared with the as-compacted samples (the applied load for conditioned samples was lower than that for the as-compacted samples, in order to maintain the same initial strain as as-compacted samples). The low quality aggregate at low compaction level has shown lower fatigue life after conditioning when compared with the as-compacted samples. In the case of good quality aggregate, the modulus after conditioning decreased and the fatigue life increased. When poor quality aggregate was used the fatigue life and resilient modulus of conditioning samples decreased. (We should have in mind that normally the fatigue curves in a strain-fatigue life relationship show a higher number of load applications for specimens with lower stiffness modulus than specimens with higher stiffness at the same strain level). Kim et al concluded that the quality of aggregate is an important factor for fatigue performance of asphalt pavement mixtures.
Kirk (18) concluded from fatigue tests with flexural bending apparatus, at constant sinusoidal force, the importance of aggregate gradation by maximum size used and the ratio of fine aggregate to coarse aggregate.
Filler
Adding filler to a mix decreases the air void content, increases the mix stiffness and affects the optimal aSphalt content. Therefore the filler could be considered as another fraction of the aggregate.
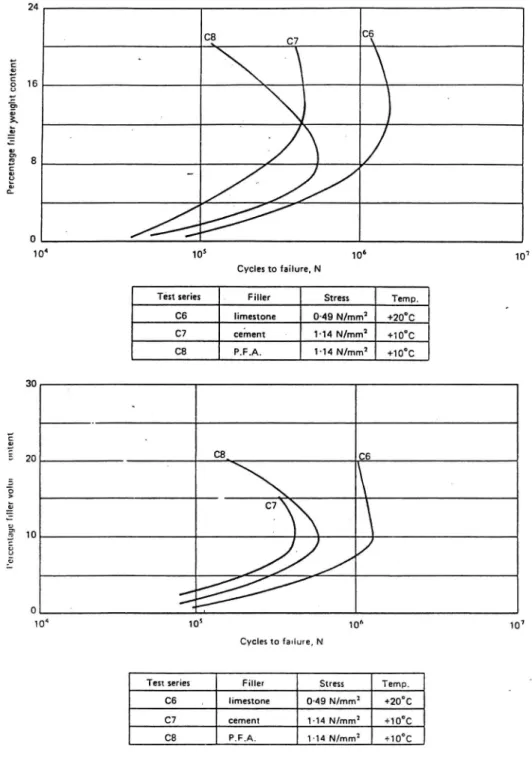
Pell et al (4,5,6,7,) have shown that there is an optimum filler content for maximum fatigue life, and the filler volume is of prime importance to minimize the air void content in the
aggregate. Figure (l l) shows the maximum fatigue life
occurr-ing at different percentage contents by weight of filler, but at the same percentage content of filler by volume for three types of filler.
l5
Kirk (18) concluded that when the filler was reduced below a certain limit the fatigue life decreased sharply.
Walter et al (19) indicate that the fatigue life increases with
increasing percent passing the 0.075 mm sieve (in a range of 2 to 10%) at 5 and 7 percent aSphalt content. Conditioning the sample with freeze-thaw cycle emphasizes the importance of the fines and indicates that a mix with 10% filler performs better in fatigue mode than a mix with 6% filler for tested mixtures. Increasing filler content results in decreasing air void
content.
Barksdale and Miller (9) studied the influence of filler type on fatigue performance of asphalt mix. The crushed stone mineral filler used in the standard mix was replaced with Portland cement or fly ash. The results indicate that use of fly ash filler instead of mineral filler will result in shorter fatigue life for the mix. Test results indicate that the fatigue life using Portland cement filler should be about the same as mineral filler and may even increase. Presumably the results of Barksdale and Miller agree with the conclusions of Pell et al when the effect of filler type with regard to weight per cent is
considered.
The apporoximative variation range of filler content according to the Swedish design specification and general advice (BYA) (10) is 5 to ll per cent by weight, which is of a similar level to the optimal content reported in the literature.
24 ca Så C7 \ 'á 16D 0 Ä V E ' . f, . få* 8 C 8 b .ö .. o_ . O 10* 105 106 107 Cycles to failure, N
Test series Filler Stress Temp.
cs limestone 0-49 rst/mm2 +20°c C7 cement 1°14 N/mm2 +10°c C8 P.F.A. 1-14 N/mm2 +1o°c 30 ä g 20 C8 C5 5 C7\\ \ få' 10 * å - / ,6 / / / o ' . 104 105 106 107 Cycles to faulure, N
Test series Filler Stress Temp.
C6 , Iimestone 0-49 N/mm2 +20°C C7 cement 1-14 N/mm2 +10°C
ce P.F.A. 1-14 N/mm: +10°c
Fig. ll Variation of fatigue life with volume of added filler
-various fillers (see table) (hot rolled asphalt basecourse mix)
2.1.4
17
Air Void Content
The effect of void content on fatigue life and stiffness modulus of asphalt materials has been emphasized by various
investiga-tors. Monismith et al (1,2) concluded that the fatigue life of
mixtures is affected by void content, shape of voids and void size. Therefore different mixes are affected by voids to
diffe-rent degrees, see Figure (12).
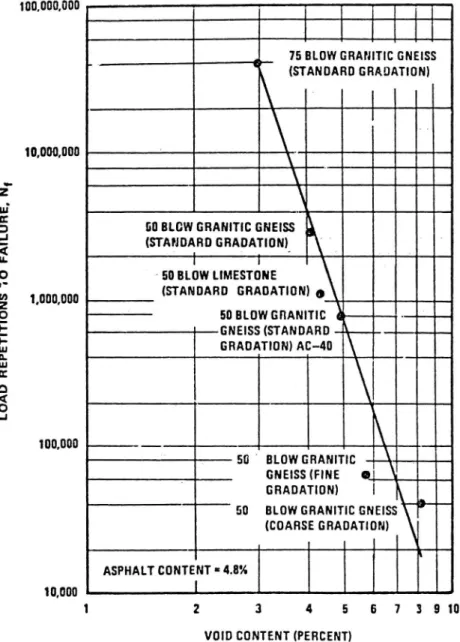
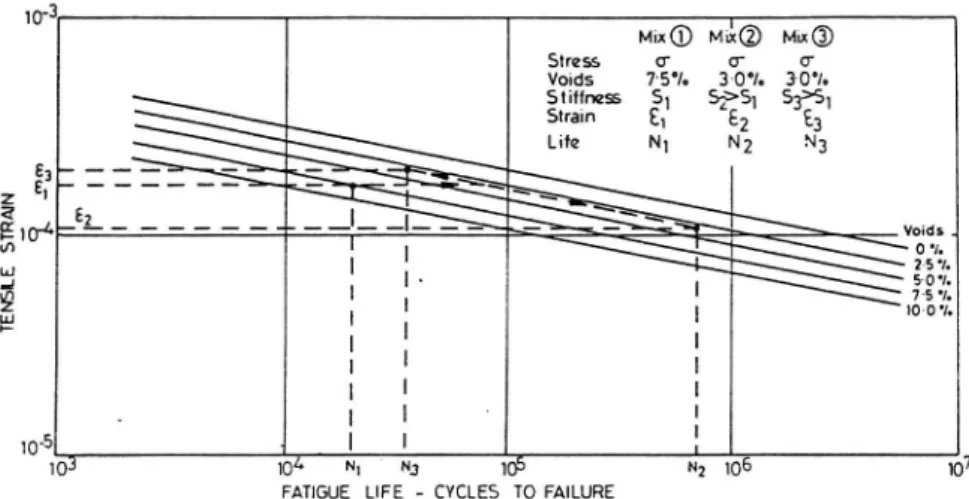
Barksdale and Miller (9) and Pell et al (4,5,20) obtained results indicating that the fatigue life of mixes decreases as the air void content increases by constant stress test. A change in void content of a mix is a consequence of changes in compaction level, binder content or aggregate gradation.
Figures (13 and 14) show that a minor change in void content is needed to change the fatigue life by more than 100 per cent. Hence, the allowable range of void content variation according to the Swedish design specifikation and general advice (BYA)
(10), which is shown in Table (2), may induce a change in fatigue
life of asphalt mixture of more than 200 per cent.
Tab. 2 Allowable variation in air void content (Ref. 10). Asphalt layer
type thicknessMinimum
of asphalt layer
kg/mi
Air void content, vol-96
Mean value Value of individual sample
HABT, TOP
MABT
AG 25,AG 32
AG 16 80 60 110 80 2-5 2.5-6 5-10 5-8 1-6 2-7 4-114-9
/,000,000 .500,000 å-NI
§
I 00,000 50,000 Ap p/ic at io n: ro Fa il urea. British Standard 594 grading
-7.9 percent asphalt. 10,000
'ä
.ä 0 2 4 6 8 A9 I? 14 [6' /8 VaidCan/enl - porren! IO, 000 .5,000 Ap p/ :h al m: ro ,b il a/ 0 -N,b. California fine grading - 6 percent
?00 M" asphalt.
[00
0 7' 4 6 8 [0
Void Conton! - porten!
10.000 k yl / c a n o n : to fa il ur e -N, \ N 8 A 0
ä
0. California coarse grading _
6 percent asphalt.
0 2 4 6 8 10
Void Conan! - pomnf
19 100,000000 75 (MW anmnc GNEISS ' ' \ (STANDARD GRADATION) (0.000.000 ' Ä
\\
å':å
: 00 aLcw GRANITIC GNElSS
:å (STANDARD GRADATION)_
(L i i
g - 50 BLOW LIMESTONE \
,å tomma (STANDARD DnADATIDN) 9
9 50 BLOW anmnc : GNEISS (STANDARD
5
GRADATIDN) Ac-40 \
a. m E :3 4o ."
100,000 \____._\
50 ' BLOWGHANITIC GNEISS(FINE 0 \ GRADATION)50 BLOW GRANlTIC GNEISS
(COARSE GRADATION) ASPHALT CONTENT -= 4.834
10000
1
1
2
3
4
5
0 7 3 910
VOID CONTENT (PERCENT)
Fig. 13 Effect of air voids on fatigue performance at an asphalt
Fig. 14 2.1.5 Stress 0' 0' 0' VOldS 7'5°lo 3'00/0 300,0 Stiffness S1 ?S1 S3>S1 \ Strain E1 EZ 23 e ._ _ _>\-\N* .-z - - _ _ __ - \\\ \ \
;WTA-E2_ _ _ _ _ _ _ '' __I_ _L'- _ '- Öx-\ \ x\ Voids .
w
' I
\\:\\:;e,
:i
:
I-
I \ ;533
g l 1 | 100/ - ' | | 1 ' I I I I | I : 10'5 | I 1 103 104 N: ^ 3 105 Nz 106 107FATIGUE LIFE - CVCLES TO FAILURE
Effect of void content and stiffness on fatigue life of an aSphaltic mix (Ref. 20).
Stiffness
The fatigue life of asphalt mixtures is affected by mix stiffness or modulus, i.e. the relationship between the stress applied to the asphalt specimen and the strain induced in the specimen. Monismith et al (1,3), using data deduced by controlled-stress
test in Figure (15), show the stress versus fatigue life plot at
various stiffnesses. The mix stiffness affects the slope and
position of the fatigue curve. Figure (16) shows the initial
bending strain versus fatigue life with the same mix stiffness as
in Figure (15). The fatigue curve here is also affected by change
in stiffness but the difference in fatigue life due to stiffness differences is not as large as indicated on the stress versus fatigue life plot.
Kingham (21) has developed fatigue curves from AASHO road
test results which are shown in Figure (17) with the effect of
stiffness on fatigue life. The slope of the fatigue curves is not affected by change in stiffness. Parallel fatigue curves have
also been reported by Shell (22), see Figure (18).
The stiffness of aSphalt mixtures is dependent on mixture
variables such as asphalt content and type (1,2,l+,5,9), air void
content (l,2,4,5,9,l 1,15) and aggregate type and grading
(l,2,4,-5,9,ll). Even the loading mode (loading magnitude, loading
21
temperature, moisture and ageing affect the stiffness result of asphalt mixtures, which in turn affects the fatigue character of asphalt materials.
Ba nd/n g St re ss -/ b pe r 54 in Fig. 15
5,000 /,000 500
% §84
de
/00
50 2: :Q5: 700,000 \ \\"'\\5=400,000 \ NS-Jcopoo \ 5=200,000 /0 8 3 4 5:/50,00q /0 /0 /_0 /05 /06 ,07 App/Icaf/ons /0 Fa//ure - A4Bending stress vs. application to failure for mixes of different stiffness - California graded mixes, granite
/n ma / Ba nd /n g Sl ra m-;0 pe r in 1 / 0 "
aggregate, 85-100, 60-70 and 40-50 penetration asphalts, 6.0 per cent asphalt. (Ref. l).
/0,000 5.000 /,000 \ 500, =
.
ä 3
Srszness *O 0 /50,000 A ,00 i_ a 200, 000 ' 300,000 50 _____^ 400,000 0 500,000 ° 600,000 0 700,000/0
1
/0' /0' /0' Applications fa Fal/are - N,Initial bending strain vs. application to failure, for mixes of
different stiffness California graded mixes, granite
aggregate, 85-100, 60-70 and 40-50 penetration asphalts,
23 2°°° I IIIIIIII I I [1111!] I Ijin (I IOOO 000 600 b 0 O 200 100 80 60 40 ALL DATA
--- FROZEN SUBGRÅDE DATA DELETED
20 I HO RI ZONT ÅL TE NS IL E ST RÅI N, pI N/IN 1 1 [111.11 1 l 1111111 1 111111]
lo* lo5 to6 10
LOAD Rsrsrmous
Load repetition failure curves with and without data from Fig. 17
frozen periods. (Ref. 21).
Asphalt fatigue strain Gfat
Fatigue life Nfat
103 -104 105 106 107 108 10-4 _ I 108 109 1010
Mix stiffness Smix, N/m2
2.2
2.2.1
2.2.2
Environmental Variables
The effect of environment is as important a design variable as subgrade support and traffic in the structural design of an asphalt pavement.The environmental variables are temperature, moisture, ageing and other factors changing the material pro-perties during service life.
Temperature
Due to the viscoelastic character of bituminous materials, temperature is an important factor in altering the asphalt pavement layer reSponse to applied stresses. At low tempera-ture the stiffness of a bituminous material is high and the elastic properties are predominant in bituminous material reac-tion to applied stresses. Therefore at low temperature and high stiffness the asphalt pavement layer can withstand relatively high stresses and low strains.
At high temperature, the stiffness is low and the plastic pr0perties are predominant in bituminous material reaction to applied stresses. Therefore the asphalt pavement layer can withstand relatively high strains without damage but not high
stresses.
Hence the strains or deformations are critical at low tempera-tures while the stresses are critical at high temperatempera-tures.
Moisture Content
The damaging effect of moisture on asphalt materials has been studied through stripping resistance of asphalt film from aggre-gate. A comprehensive study of the literature regarding moi-sture damage to asphalt pavement is presented by Taylor and Khosla (24). It has been suggested that the role of traffic or repeated applied load in the presence of water is to create high pore pressure resulting in stripping. Schmidt and Graf (25) have
Pig. 19
25 reported the effect of moisture content on resilient modulus of elasticity for aSphalt mixes with high air void contact, which
permit a sizeable amount of water. Figure (19) shows that the
drop in MR of 4-in. diameter, 8-in. tall specimen, was
reversible when the water was removed. A preceding section has shown that the fatigue resistance is highly affected by modulus, so any variables which affect the modulus will affect
the fatigue resistance too. Lottman (26) has affirmed the
increasing damage effect under repeated-load application when specimens were moisture conditioned.
Kim et al (17) have shown in Figure (10) that the fatigue life is
affected by moisture content, when comparison is made be-tween as-compacted Specimens and freeze-thaw conditioned specimens with different compaction levels to study the effect of water, at different air void contents, on the fatigue life of aSphalt mixtures. The difference in curves was greater for both
aggregate types with higher air void content (low compaction
level) than for fatigue curves with lower air void content (high compaction level), which indicates the increasing damage effect under repeated-load application in the presence of moisture. The fatigue life after conditioning generally increas-ed comparincreas-ed with that of the as-compactincreas-ed samples. This is due in part to the fact that the load applied for conditioned samples, in order to test at the same initial strain, was lower
than that for the as-compacted samples (17).
Conditions
Aggregate - Cache Creek Gravel
Gradation - I
Asphalt - 5% of Asphalt C 0:
Voids - 13.3%
Exposure - Variable Type of MR - Direct Compression
or Tension, 73°F DesiccateAmbient
vVacuum Saturate
70 of Dr y M R 20 ' Note
Values on points are the weight percent water.
l l l l l l l l
0 20 40 60 80
Exposure. Days
2.3 2.3.1
Fig. 20
Test Condition
Loading Mode
The deterioration of an asphalt pavement layer is a conse-quence of a complex form of loading, which is a compound of different magnitude level and distribution of stresses and strains, temperature, moisture, ageing and loading speed. How-ever, the majority of acquired experience regarding fatigue performance of asphalt mixture relates to the controlled-load (the load is constant during testing) or the controlled-deforma-tion (the deformacontrolled-deforma-tion is constant during testing) mode of fatigue loading which are two extreme simple-loading
condi-tions, (14,27). Figure (20) shows that the fatigue response of
asphalt material is a function of mode of loading. The fatigue life with controlled-strain test is more than 10 times longer than fatigue life with controlled-stress test at the same initial
strain level.
Number of Slress App/icahbns, /V
Comparison of laboratory determined controlled-strain and
controlled-stress fatigue data. (Ref. 27).
/0,000 :0 . 'Q Control/ed 5'fram, ?. Temp. = 90 'F' .: \ . k \ . -m \ s. r-Contra//ed .57mm q * ' ' .S /000 \\\\ »- Temp-"550F ' \ ON \\ . .QG \\\ ' \\v .\ å _ - - - - .7 .N\ \ Vi \\ I " \ . å Cantra//ed Siress, -/\ N* : Temp-+667. \\ \\\
å
M = 4.sax/0 'ID/051373
\'\\ \ \
E /00 *« \\ IS /0 6 ' 0'- 103 /04 * /05 0527 Bonnaure et al (28,29) confirm that the constant-stress mode is more severe than the constant-strain mode, see Figure (21) which shows fatigue life as a function of the initial strain at different rest periods tested at ZOOC, with regard to the
influence of the test mode.
Monismith and Decon (14) have used a mode factor in order to quantify the mode of loading (controlled stress or strain) which has a significant effect on fatigue results of aSphalt mixture. The effect of mode factor is to intermediate the fatigue results between controlled-stress and controlled-strain test mode, see
Figure (22). The mode factor is defined as:
where A: percentage change in stress due to a stiffness
decrease of c.
B: percentage change in strain due to a stiffness decrease of C, and
C: an arbitrary but fixed percentage reduction in
NFAT IOGF' 8 P" 6 _ MODE i K n :2
C.STRAIN 0 I.le0'6 -3.no 0.90 _
4 - " 25 5.4xIO'5 -2.78 0.90 C.STRESS 0 277xl0"2 -4.47 0.99 " 25 7.IleO' -4.34 0.99 2 .. 5 --CONSTANT STRAIN |0 " -- CONSTANT STRESS 8 :-6 r-4 _ 2 r-\1=25 104-8 I-5 " \i-O 4 -2 ' 25 [03 l 4 1 1 i; l I I J J
IO'4 2 4 s BIO'3 2 4 6 eIO'2
80
Fig. 21
Fatigue life (N fatt) as a function of the initial strain (E.) for
the 80/100 mix tested at 20°C. (Ref. 29).
Control/od - Strain n P, \ 0 S F_- _____ I
' i
I | I | lamm/arv*IHJ/'IML 'IM/I ' Modo
Mean Serwce L/fe ,N, (log saa/el
/m h' a/ St re ss ,a ' /l og sc al e I
Fig. 22 Hypothetical fatigue diagrams illustrating effect of mode of
Fig. 23
29 Van Dijk et al (30,31,32,) explained the difference between controlled-stress and controlled-strain tests by the energy dissipation concept. Figure (23) shows the increase of the total energy dissipated during fatigue tests as a function of the number of load repetitions. The graph shows how the energy is absorbed more quickly at constant stress than constant strain. The dissipated energy per cycle per unit volume is expressed by the following equation:
W: TT.O.E. Sin ø
Where 0 and s: are the stress and strain amplitude respectively
and (6 is the phase angle between the stress and strain wave
signals during dynamic loading test. Figure (24) shows the total dissipated energy as a function of the number of load appli-cations at different temperatures, frequency test method (two or three-point bending) controlled-stress or controlled-strain
and two types of bitumen (40/50 and 80/100 pen). The fatigue
life is predicted by the energy dissipated using the following equation:
1
l
lm
Where '0. and so are the initial stress and strain amplitude
re-n (oo/Go) sire-n Öo
N
A ll)
Spectively and (I) is the initial phase angle, ll) is a function of mix stiffness depending on test mode, see Figure (25), and A
and Z are mix constants.
'rom ENERGY munnen. ucma 1.0 + 0/
7
0/
f ÅS?
0.0 , T omsnm mIS 5 .4 0.0 s s 0 munnen or cvcus u no*Total energy dissipated as a function of load repetitions for constant strain tests. (Ref. 31).
Fig. 24
hm m? N 2 - _ um ° 1________.§83, iii: 3:, 108 o o 8 o A A 6 o I 0 4 1 + D7 11111111111L11111197 104 2 468105 2 468105 2 468107 2 468108 MJVBEROFCYCLES TOFATIGUEAND FRACTURE
Total dissipated energy up to the fatigue and fracture points as a function of the number of load applications for mix AC-I. (Ref. 32).
Bonnaure et al (28) mentioned that measurements performed on a large number of mixes did not confirm this hypothesis.
In fatigue tests with controlled-strain, the stress decreased with increasing number of load applications in order to keep the deformation or strain constant. This does not simulate field conditions, and caused the test to be stopped at an arbitrary number of load applications or when the stress decreased by half of its initial value, which is due to undefined failure in specimens. The controlled-stress test has a well-defined frac-ture and gives a more moderate fatigue life estimation than controlled-strain. Additionally, the scatter in the fatigue test result by controlled-Strain mode is greater than the result found by controlled-stress mode (28). Even the beneficial effect of rest time at constant stress is higher than in the constant
strain test. ,.Ymma; Q Warm: 0 40/50 nu. 31mm "' v 00/100 .. .. A 180/200 - on 11-WTROLLED STRAlN . 0 a» --. .3. ' 3 A 0 vv'l' n i b * . a n o . §0 0 _ 0 A '0 CONTROLLED STRESS 0.41-1 l 4 1 1 1 l 1 1 L . n" un.: a 10'° 2 4 s mx STIFFNESS MODLLUS S 0010' 2 4 s MIX'
Relation of 11) and Mix stiffness Modulus for the Asphaltic Concrete AC-I. (ref. 32)
2.3.2
2.3.3
31 Fatigue life definition
Fatigue life has been defined in terms of service life or fracture life. Service life i the total number of load repetitions required to decrease the initial modulus (normally) by 50 per cent (8,29,30,32), or the total number of load repetitions at which the strain versus number of load applications curve deviates from linearity (8). Fracture life is the total number of load repetitions to cause a complete fracture of the Specimen
(5,8,34,l9,35).
Göransson and Hultqvist (37) defined fatigue life as the perma-nent deformation equal to 2 micrometer per load application, using indirect tensile test.
In controlled-stress test, the number of load applications to complete fracture does not contain a significant part of crack propagation time and the fracture is well-defined. In controlled-strain test, the fracture of the specimen is not well-defined. The test is stopped at an arbitrary number of load applications, usually when the stress decreased by half of its
initial value.
Loading History
Simple and compound loading
Fatigue behavior of asphalt materials has been extensively studied by simple loading, which means the loading condition does not alter throughout testing.
In contrast, the road is subjected to variable loading conditions (stress amplitude, loading frequency and duration, temperature
etc.) When the load condition is changed during testing, the
specimen is said to be exposed to compound loading. The results
of compound loading fatigue test are interpreted by Miners law
where M: Cumulative cycle ratio
q: total number of applied loading levels
ni: number of applied loading cycle at level 1, and
N i: fatigue life of the mix under simple loading fatigue
test at level i.
The cumulative cycle ratio (M) would be a unity, if Miners' equation could predict the compound-loading fatigue life. The predicted compound-loading fatigue life (Np) is expressed as
l
zq(01/Ni)
i=l
Np:
P 1: applied percentage of load level i.
Ni: fatigue life of the mix under simple loading fatigue test at level 1.
Loading pattern
Figures (26) and (27) illustrate different types of loading patterns which have been used in fatigue tests by means of microprocessor. The loading pattern has a considerable influ-ence on the response of asphalt material.
Fig. 26 I 00 'L- ---. _ ö EG (Cl) sinusoidal 00 J
M
3 (b) haversineJ L /L
(E) cyclic loading
_l [-1 1-1 [-1
(d) cyclic loading
Types of loading pattern
hme Time Time hme hme 'rime hme fime 33
TYPE Frequency : 55.6 Hz - Period -_t8 ma - 1'n/TL - Rest time/Loading lime OF LOADmsronv TR/TL = 0 'rn/TL = 1 1,,/TL =- 2 c CO 0 Ci a CZ SIMPLE 1 level / BLOCK 8 levels RANOOM 8 levels
Fig. 27 Compound test conditions, (ref. 33).
- Loading time
The effect of loading time on fatigue resistance and stiffness modulus of aSphalt mixtures has been reported by various investigators (6,27,31,35,36,39,40).
The fatigue resistance of aSphalt materials is highly affected by stiffness modulus, as has been discussed in the preceding section. Therefore any variables which affect modulus value will change the fatigue resistance of an asphalt mixture.
Monismith (27) has studied the effect of loading time by running
a flexure bending test with 0.1 sec and 0.02 sec loading time at different temperatures. Fig. (28) shows the stiffness modulus is increased as loading time decreases, and the dependence of stiffness modulus on loading time increases as temperature is
increased. Brown (36) shows in Fig. (29) that the stiffness is a
Fig. 28 Sb (M N Im ?) 10" Na rut o Sl il lnøu No dul ul .p u ,al Elostic
/
35 i I human I :Ia-a-Sdnuo' Pom! : [JC 'r 'in' att kl 0 V04: 7.0 1 C. a. nW han uni/hon :nu: Wii
man' ha. 0. I ne Lanta' h" 00: I"
i
0 I I i 10 50 70 90 0 Mina" fonpororwø. .F ua 150Dependence of stiffness of asphalt concrete on temperature
and loading time (Ref. 27)
Visco - elostic 10'2 10'3 10% .8 1 1 1 1 1 10 10'6 .0'* 10'2 1 .102 AOL .#106 »103 Time (5)
Fig. 29 Bitumen stiffness as a function of loading time on
Fig. 30
Van Dijk et al (31) studied the effect of testing frequency on
fatigue resistance of bitumen film by constant stress amplitude tests at different temperatures. The apparatus used is a sliding plate microviscometer whose upper plate is subjected to con-trolled cyclic vibrations. The straight run and blown bitumen film located between the two plates (2 cm long and 0.8 cm
wide) thus undergoes shear stresses. Figure (30) shows the
rela-tion between fatigue life and initial strain at different frequen-cies and temperatures. For the same initial strain the life increases when the frequency decreases, and/or temperature increases. An increase in temperature and/or decrease in fre-quency induces a decrease in stiffness of bitumen. Strain versus fatigue life relationships normally show higher fatigue
resis-tance for lower stiffness bitumen.
'ÅHOUE LI'E (MIG. OF UCL!! TO KIM!)
__ 40/50 __ _ 10/50 8
:- 10°* L 0 i o I 1
INITIÅL .TIÅIH
Fatigue testing of bitumen:
Relation between fatigue life and initial strain (Ref. 31).
Pell and Taylor (6) have subjected basecourse mix specimens to a repeated constant stress amplitude at a temperature of 10°C, and the speed of loading varied between 80 to 2500 r.p.m.
Figure (31) indicates the fatigue life increased as the loading
speed increased. A linear relationship was found for speeds of loading greater than 200 r.p.m.
37
Due to the viscoelastic characters of asphalt materials, the loading time at which the tests is run is an important para-meter. When studying the mechanical properties of aSphalt mixtures at low temperatures, the elastic character in the asphalt materials is dominant, and the materials are less affected by loading time. As the temperature is increased the viscous character becomes predominant in the asphalt charac-ter, so that the loading time has an essential effect on the mechanical pr0perties.
3000 I Testing 1 . - ' temperature ° o C zmo i. . Spud ' Varies
_ ; Testing New l machine No.2 _ Stress 165 i i s level lbl Iinz " .. . jÅ_ Vdd cantent Nää) é] --' t __ range 'I. 3'6-6'2 ; J _4 2 _ .5E . 700om ; ^ "w" 'lä ' Void content ((9 .I __ men 70 '2 4 -2 Gm ! 4'th individual 0 I; Sw 4. i __ _1_ J results Mean results X 2 - -bcoql- ._.L ._4 -ä 5 | 95 '1. confidence [ J 9 . . I - 300 ___4_ lurmts on mean. '6 0N ä n 200 « i .4 3 | I i l l 5
/V
4
.'-1a - 4 d - -1 --4 .4 är_-I i m 4 Eee -..pm -0--0-1 I . s 103 104 . 105 5 x 10⁵ x ,02 . Cycles to failure .NSBrown and Barksdale (39,140) respectively have emphasized that
the vehicle Speed and the depth beneath the pavement surface are of great importance in selecting the appropriate stress
pulse time for use in repeated-load testing, see Figure (32)
Therefore, it is important to run the tests under conditions actually encountered on the road if the effect of changing loading time, in order to accelerate the test, is unknown.
1.0 SPEED lkm/ht.)
/r 3
/ / . // 1/ E /y- 105 0-
/
/
LZD c/W . L//øc--ZO 'ö § /.4/ 4/ /PLO <r'/ /» ao / /GmJJ/r/
200 300 HI)| _
HD 6%THIOOESS OF BITUMINQB UUER lrrrnl
Fig. 32 Relation between loading time and thickness of bituminous
39
Rest Time
The beneficial effect of rest time on fatigue character of aSphalt materials in repeated-loading test has been reported by various investigators (1l,l§,29,31,33,4l,42,43).
Van Dijk et al (31) in Figure (33) show fatigue curves for
sinusoidally and pulse loaded Specimens with different rest times. The number of cycles to failure increases with rest time
used.
Verstraeten et al (42) concluded from work done by Rathbey öc
Sterling (41) on prismatic Specimens, 75 mm square and 225 mm
long, which were subjected to direct cyclic tensile and com-pressive loading at a temperature range between lOOC and 25°C with 40 ms loading time, and also from results obtained
by Franken, (33) on trapezoidally shaped specimens 9x3 cm at
the base, 35 cm in high, and 3 cm thick fixed at their larger bases and submitted to a bending force on their smaller bases, at 15°C with 19 ms loading time, that the estimated number of loadings to produce failure is increased by at least a factor equal to 7 when the influence of rest periods between succes-sive loadings is taken into consideration, at 60 km/h speed of
commercial vehicles.
The effect of rest periods on fatigue performance, see Figure
(34), is expressed in function M(j), which is the ratio of mean
life with rest times to mean life without rest times, plotted
against j: TR/TL, ratio of rest time to loading time.
The maximum value of function M(j) is about 20, which indi-cates that above a certain value of j ( = 15) the beneficial effect of rest periods does not increase any further (42).
Fig. 33
Fig. 34
I :VCW TO FNLUI!
w'
'alm-annu nu (mamman m nunnan. 0 om 0' anoula
M ---- umo rem-:vc m n nu. - so-c f I 10'.. u. n . 7 T ?fI'VIC F 1 [TV 1 of . . . A-: . . . - . 4. :0100101 2 a 0100"'
Programmed fatigue testing (Ref. 31).
6 I till... f C R.R.-O.C W.-DRA "JDM 0 x x x x
,' x* Ranhby ond Sterling (ref i)
ä n Francken (ref l) :ti o 3 2 i (s å 1'0 1'2 1'1. fe is in 2'2 22 215 TR/TL;j
Variation Of M(j) in terms
of j: TR/TL (Ref. 42)
41
Bonnaure et al (29) confirmed the results presented by
preceding authors on the beneficial effect of rest periods in repeated loading fatigue test by using rectangular beams tested in three-point bending apparatus subjected to a sinusoidal load pulses at temperatures from 5°C to 25°C for two type of dense aSphaltic concrete containing 40/60 and 80/100 pen. bitumen grade. The maximum value of the life ratio (function M(j)) is around 25, which is close to Verstraeten's (42) conclusion, depends on bitumen grade and temperature. Increasing the test temperature or using softer binders increases the beneficial effect of rest periods.
Bazin and Saunier (ll) studied the effect of storage time
(healing) on mix, which was previously fatigued, but in which the cracks were not yet visible by leaving the test bars to rest, at the same temperature, during a variable time (from several hours to 100 days), using the two-point bending test.
Figure (35) shows the beneficial effect of healing when the
specimen bars were stored under low stresses. Mcelvany öc Pell (43) indicated the beneficial effect of introducing a rest period between successive blocks of loading cycles.
0 SII'LI Il'f VII'ICALLY
0"!! NIX 'O'C
O SAI'LE ll?? 'LIYLY
SIIOSNIIT 10': X SAI'LI Il'T VEIHCÅHY
0 10 o o 0 o mo mt 'llloo (nav) . . . 10 10 30
TESTING APPARATS
Different types of testing machines have been used in studying the repeated-load Characteristics of aSphalt concrete mixtures in laboratory. The tests include:
l. Bending test
- Flexural - Rotating - Trapezoidal Wheel tracking test Indirect tensile test Triaxial test
Direct tension test Push - Pull test
P
i-P
l
Bending test
Flexural test: A simply supported asphalt concrete beam speci-men is subjected to a bending stress with the specispeci-men ends fixed to prevent vertical movement. The specimen is loaded at one point at the middle of the specimen (3-point bending test),
or at two points at 1/3 and 2/3 of the Specimen length (lit-point
bending test). The loading system applies a pulse or sinusoidal
load signal and the test can be operated by controlled-stress or controlled-strain mode. This method has been used widely at the University of California by Monismith et al (135,44). The test bars were 1.5 by 1.5 inch or 3 by 3 inch in cross-sectional area, with 15 inch length. The Specimen is loaded at two points,
see Figure (36), for a given time and then it is forced in the
opposite direction to return to its original undeflected position,
see Figure (37).
The Shell laboratory in Amsterdam (30) used a 3-point bending
machine where a rectangular bar with maximum dimensions of 230x30x40 mm is subjected to a sinusoidal load. The deflection was kept constant and the changes in force and phase angle were recorded as a function of the number of load applications.
43
Key
l Reaction chmp 5 Dan plan 9. Doubk-ocling, Bollolrom cylüøcr
Z Lood clomp 6 Loading rod la Rubber 1:0er
3 Reunion 7.. Stop .ut H. Load har
4. Spocumcn a Pmon rod Iz Thomson boll huqu
Fig. 36
Repeated-flexure apparatus (Ref. 35).
Timo inte/val between success/ve loadapplications o : Load . '-"' ' dumt/on Up stroke / -c . __w * Time Downsrroke
/a/ Ideal/:ed Load- //me Curve.
L o a d \
v
.
Da l/ ac ti on :t 3 0/b/ Ideal/:ed Def/ech'on -Iime Cane.
Fig. 37 Load vs time and deflection vs time relationships for
Fig. 38
The Shell laboratory in France (29) performed a 3-point bending test using a rectangular bar with dimensions of 230x30x20 mm subjected to a sinusoidal load. Constant-stress and
constant--strain test mode have been used.
Kallas et al (16,46) at the Asphalt Institute, and Maupin (48)
used the 4-point flexure test of the same design as used by Decon and Monismith (35), applied to a 15 inch long beam specimen having a 1.5 inch or 3 inch square cross section and
loaded with constant stress.
Barksdale and Miller (9) placed the asphalt concrete beam on rubber to simulate the subgrade in the field and to eliminate the problem of beam weight which can affect the results of unsupported beam fatigue test. Kirk (15,18) tested a specimen with dimensions 5x7x35 cm in a 4-point bending machine, the specimen being supported at the ends and loaded at the third points with a sinusoidal or pulse load.
Hoseth and Va rnes (47) built a test machine which is capable of testing 6 bars at the same time. The Specimen bar is loaded
at the center, see Figure (38).
Fig. 39
45
Rotating machine (two-point bending test): A rotating
canti-lever test has been used at the University of Nottingham (4,5,6,7,49,59). Figure (39) shows the details of this machine. The specimen is mounted yertically on a rotating cantilever shaft, a load is applied through a bearing at the top and a sinusoidal bending stress of constant amplitude is induced through the specimen. The maximum stress occurs just below the neck of the specimen. The specimens were tested in a controlled temperature bath at temperatures -5 to + 30°C, at different loading frequencies.
Another machine was built specially for measuring dynamic stiffness, using specimens identical to those used in the fatigue machines, but in this case the specimen was stationary and a constant sinusoidal amplitude deformation was applied to the top of a vertical cantilever specimen, Figure (40).
LOAOlNG EETRUP mmm LDAQLNQ _HEADL I (WRALUMINE 'p- f. 9* R^° won. "' "" _____, ..._- spgcmen M ._.. __ 3h0lA. SPEClMEN END FITTlNG SSTEEL! ' f
_-E
mm SHAFT ;10010 SEALING \ gm _- \ f__4-i////
TH E \|§ RIN MHQQSING__/\/___
TO R E C W N G E O UO PM E N Y DEF LEC TIO N ' L E / 2 4 m m ? ; g l / un o cs u. / L O A O N G n u EC CE MR DC X 0 m _ _ 1 U _ -4 ' -A .
LO AD UN G HE AD W I A B L E
__
__
_L
_l
li
-:
__
[TE
ii
1
U
11
1
_ \ \ \ \ \ \ \ \ \ \ \ \ \ \ , \ \ \ \ \ \ \ \\
\
\
\
\
\
\
\
\
\
\
Y
Fig. #0 De ta il s of ma ch in e us ed to me asur e dyn am ic st if fn ess of a bi tum in ous mi x (R ef . 50) .#7
For controlled-strain fatigue test, a machine similar to the dynamic stiffness machine has been used.
Trapezoidal specimen (2-point bending test): A trapezoidal shape specimen has been used to study the modulus and fatigue
properties of asphalt mixtures (ll,30,31,51,52). Van Dijk et al
(30,31) used a specimen with dimensions 250 mm high, 55 mm long at the base, 20 mm long at the top and 20 mm thick, obtained by sawinglarger blocks. The top of the specimen was subjected to a sinusoidal loading with constant deflection. Verstraeten (51) used test pieces having a trapezoidal shape (bases: 9 cm and 3 cm, height: 35 cm, thickness: 3 cm), the specimen being exposed to a sinusoidal constant stress. Bazin and Saunier (11), and Coffman (52) tested at constant stress. The details of the specimen set-up with dimensions are shown
in Figure (41).
The two-point and three-point bending tests have their specific limitations. In particular, the three-point bending test is not suitable for fatigue tests at stiffness modulus values smaller
than 3x10³ MPa, Van Dijk (32).
\\\\\ 33535? ?156% f%\\\\\\\\ ' \ 4073"' I (.0 80" 9 Wirei ' Prelensmned Sine LOOdlhq L o a d Ce ll
Strain Goqes
i
Grovny 6. 0' -. r ° 'Specamen ' -De//ecnon Measurement 0/ c_ 0/ Wire and Spec/men ., ..°>I| .'-///////l///I////////////Lao-4
-Spec nen Bondedmin Epaxy
Wheel tracking test
Van Dijk et al (31,32) have investigated the Wheel tracking machine in the laboratory. The applied wheel load simulates the stresses induced in an actual asphalt pavement. The testing machine is a pneumatic tire rolled to and fro on a slab made of an asphaltic mix. The pneumatic tire has a diameter of 0.25 m
and its contact area (15x10'4 to 30x10'4 m2) can be varied by
changing either the tire pressure or the load on the wheel. The slab deformation is measured by gluing strain gauges to the
bottom surface of the slab, see Figure (42). Both sides of the
slab are periodically photographed so that a correlation can be made between the strain and the crack development as a function of the number of wheel passes.
Indirect Tensile Test
The indirect tension method has been developed for aSphalt materials testing at the University of Texas by Kennedy et al
(53,54,55,56) and at the Chevron Research Company by Schmidt
(57).
The Marshall cylinder is subjected to a load at the vertical diameter. The induced deformation at the horizontal diameter is sensed by two linear variable differential transducers (LVDT), see Figure (43). The vertical deformation can be measured for
Poissons ratio calculation. This method has been standardized
by ASTM (58) for resilient modulus measurement.
Triaxial test
The use of the triaxial test method has been limited to studying the fatigue character of asphalt materials. This is a more realistic method for its simulation to the field circumstances, but the test is more complicated than others. The effect of confining pressure on fatigue character of aSphalt mixtures has
been investigated by Pell and Cooper (6). The details of this
equipment are shown in Figure (44).
49 VII/Ill ; I I ;
å
ä woooeu STRIP ll \ \ s \ \ \ \ \ \ / RQ.le Wl'EELwx
STRÅIN GÅUGES STEEL PLÅTE
Fig. #2 Schematic representation of wheel tracking machine
(Ref. 32).
repeated-load indirect
Fig. #3 Horizontal measuring device for
Fig. #4 L imil swithes Hydraulic __, rum 0 0 N @ Local run . . control Coupling unit -/" Gl flow 'I rdu'n Spec'men ---'--"
LVDT ---*" Servo outoutServo voi/e input
Airpressure* 'I /- ;ISmPlY/Mput
Q/'ø
Spex cen .a /_ Loodcell
/ SLIP pl//output Water trup / ø/ . Loadoell --"' _ / Cell base/V JanW' / i \\ l l \ l
;i/
Axial load fatigue rig (Ref.6).
Direct tension test
A sketch of the equipment is shown in Figure (45). A specimen
with 1.5 x 1.5 x 4.5 inch is sawn and bonded to aluminium end caps with an epoxy resin to permit direct tensile forces to be applied (1). The problem of end gripping and stress concentra-tion has restricted the use of this method (8).
Push-pull test
A prismatic specimen, 75 mm square and 225 mm long, was subjected to direct cyclic tensile and compressive loading in an electro-hydraulic testing machine. The test is illustrated in
\ Load/'ng frame -- Load/'ng rad -- Universa/ joint O 0- Aluminum end mp . Epoxy _ /5'x /5"x 45" 1/ Specimen and dual Lvdt's ...L-_- Epoxy
...--A Iam/'nam end cap .- Laad cell _- Un/'versa/ joint Load/ng frame 0 and electro - hydrau/I'c closed loop
test/'ng system 7 Loading rad
Fig. #5
Direct tension testing apparatus (Ref. l).
Temperatur-e Chamber
. 1 2 4 . ' 1 : _ l "r r-1. :: v -.. 'I d' 'J a-f. ' ' . .-b l ? .F12 1* -r åxå. * ' ' u . 5 : -. . I -J u ' I " ' u-r ' . " _" ,. ' L -/ J u fu ' . -M . a .. _ , .fu \ .t v 5. " 3'§1 ' \ '-, n: . x 1* _ r i, n _ . -\ U . I .3 -A 7' r. n\ ' 0 ' Eg Summing
Commc'm junction t'_ "'"'" "' _--J ggm' Load :ell Hydraulic octuotor Y Error signal g \ omplifier . * Servo-valve Hydraulic power SUDO'Y
Fig. #6
Schematic representation of test method (Ref. 41)
DISCUSSION AND CONCLUSIONS COMPARISON BETWEEN APPARATUS
No comprehensive study has been made regarding the correla-tion between the results of these apparatus used in studying fatigue or modulus of aSphalt mixtures on a wide statistical basis. Wallace and Monismith (59,60) examined the use of the diametral test (indirect tensile test) and the triaxial test to determine the resilient modulus of nonlinear pavement mate-rials, such as partly cured open-graded emulsified aSphalt mixtures at room temperatures. The examination has led to the following conclusions. The triaxial test measures the vertical
and radial strains due to an increment in vertical stress,
whereas the diametral test measures the radial strain due to an increment in radial stress. Both methods give a reasonable description of the resilient Characteristics of weak bound, highly stress-dependent material. Wallace and Monismith have also calculated theoretical stresses and deformations using the finite element method and the closed form solution for a cylindrical Specimen, and it was concluded that the results were practically identical.
Hadley and Vahida (61) have compared the stresses and strains found by indirect tensile test and the beam test by using basic theoretical equations and finite element analysis techniques. They concluded that the indirect tensile test underestimates the tensile stresses, strains and modulus calculated by basic equations, while for the beam test the values of stresses and strains were overestimated and the modulus underestimated by basic beam deflection formula.Hadley and Vahida have modified equations for estimating fundamental material properties for the beam and indirect tensile tests. These modified equations gave results which were more closely related between one
Tab. 3
53
Emery (62) has used Marshall cylinders (102 mm in diameter
and 64 mm thick) and triaxial type Specimens (102mm in diameter and 203 mm in high) from six different types of surface and basecourse mixtures. They have been tested at temperatures between l°C and MOC, and gave a close agree-ment between resilient modulus determined by diametral (in-direct tensile) test and triaxial test, except at higher tempera-tures and/or lower stiffness where the discrepancy in results
was high, Table (3).
comparison Of MR for various aSphaltic concrete mixes tested in triaxial and diametral equipment (ref. 62).
SPECXMEN ms rampen/nun: MEASURED v RESILIENT noouws. MR (npa)
(0C) (POISSON'S sumo N 0 . r L u man
sommarn) (DIRECT HEASUREMENT) (CALCULATED mm v)
EXCELLENT 1.0 0.26 10.600 11.055 mx 22.3 0.38 1.150 1.390 44.0 0.44 109 248 < 2 AVERAGE 1.0 0.22 10.400 9.255 5 7 nu 22.3 0.39 1.050 1.080 § i' 44.0 0.45 97 210 ä 5,; HARGINAL 1.0 0.23 9.400 8.655 3 mx 22.3 0.42 1.000 1.120 44.0 0.50 94 218 excmm 1.0 0.27 12.900 18.095 »9 mx 21.0 0.35 1.850 2.035 5' 39.0 ' 0.40 250 276 ;g AVERAGE 1.0 0.24 14.100 14.980 g mx 21.0 0.35 1.550 1.350 ä g., 39.0 0.42 '210 196 3 i' g MARGlNAL 1.0 0.22 10.200 12.980 mx 21.0 0.37 1.130 1.310 39.0 0.45 157 209
Kennedy (63,6#) has tested the fatigue life results found by
indirect tensile tests against fatigue results reported by different investigators using other test methods, see Figure (47). This shows that the results obtained from the repeated--load indirect tensile test were compatible if the applied stress was expressed in terms of stress difference to account for the triaxial state of stress, which exists in the indirect tensile test. The stress difference is approximately equal to 4 x tensile stress.
Baladi et al (65) employed several tests and test procedures. These included triaxial, flexural, Marshall, indirect tensile and creep tests for studying the asphalt mix properties. They concluded that the results from the indirect tensile test were the most promising, although they were not
consistent.
Brown and Cooper (67) have shown quite a good agreement of elastic stiffness values measured by axial load apparatus and indirect tensile test, but in an additional investigation to study the effect of binder content in elastic stiffness (resilient modulus) of dense bitumen macadam, using axial load apparatus, indirect tensile test and Shell nomograph, the indirect tensile method, contrary to other two methods,
shows no optimum for binder content. See Figure (48).
Schmidt (57) shows the usefulness of the indirect tensile test
in deciding the optimal asphalt content on the mix by measuring the resilient modulus. See Figure (49).
COMPARISON BETWEEN RESULTS
Witczak (66) has made a comprehensive comparison between different fatigue curves found by repeated load testing methods from results reported by different researchers. However, each of the researchers has used different test conditions (Specimen, test equipment, load conditions, met-hods of determining strain). Nevertheless, he has
conclu-Fig. 47 Foti gue Li fe 55
ded that the loading condition has a great effect on the verification of the concept of unique strain criteria found by
C00per and Pell (4,6) who found that the strain-life
rela-tionship when plotted in its logarithmic form is independent of temperature, speed of loading or magnitude of stress. Witczak found that each of the researchers reporting the
existence of a unique strain criterion has used a
continuously applied sinusoidal load.
los-E IO7-___ E Monismith et cl : nz-3.5I .. K5=I.55 x :0" s Roithby .8 T '68°F '0 'E Sterling E n,*3.87 l " K'z'3.65x IO j T=77° los-z
'
\
101-_'z' \\ _-_- \ _ \ \. - \103-;
\
.E \ Pell et al _ . \ "12' 3.94_ [D Kennedy et al K2'-3.O x lO'2
'0 5 G) Pellet OI.. T: 50"'-o 2. Ö Monismilh et al .. _. . Kennedy et al _ A Radhby 8 Sterlunq \ "2: 3.88 '0 \ KE: l.03 x lo" _=5 Kennedy el ol)\ T = 75° F - -3.aa , ' K2-4.76 x :0 - T=75°F o I I I I I ' I I I I I I I I I '#1
'0
:02
005
Stress DiffetencemsuTypical stress difference-fatigue life relationships for various test methods. (Ref. 64).
F1g48 Vi En -u N Mm :z: :2 'D 0.-2..: m En. 0 . :4. :J o: 0: Fig. 49. El as tl c St if fn ess (G Pa )
20mm DBMJOO pen \ 20°C and 5°Hz Indirect tensne Axial äad I Predimed
:5:e
\ 3 4 5 6 7 8 Binder Content by wt. 96Effect of Binder Content on Elastic Stiffness Measured by Axial Load and Indirect Tensile Tests.
s s s g s ä I I T ] I 3 4 1 l l l l 5 6 7 8 9 Asphau .n Mix, 7»
57
In contrast, those who used some form of pulse load did not support the unique strain criteria. Fatigue life curves at diffe-rent temperatures or stiffnesses have been shown as a series of parallel or nonparallel curves and intersect at an arbitrary point, from the comparison performed by Witczak (66). He has also explained the cause of obtaining either parallel or non-parallel fatigue curves, depending on whether the nonlinear stress behavior of asphaltic concrete is taken into account in determination of the fatigue curves. For those investigators who found fatigue curves from laboratory tests, the effect of nonlinear behavior (stress dependency) is directly taken into account in fatigue testing. For the investigators who use some
type of nomograph for obtaining fatigue curve (such as the Shell
nomograph), the effect of nonlinearity is not considered, which is especially important at elevated temperatures.
CONCLUSIONS AND RECOMMENDATIONS Testing system
A wide variety of testing apparatus has been used by different investigators or organizations to study thefatigue resistance of aSphalt materials. These studies have been performed at diffe-rent laboratories, with diffediffe-rent aSphalt mixtures and with a wide varity of loading conditions, such as speed of loading, magnitude of loading, loading time, with and without rest periods, controlled-stress or controlled-strain mode, and at different temperatures.
In addition, study of the fatigue characters of asphalt materials requires a large number of test specimens, due to the high scatter in fatigue results. Therefore, a statistically based comparison between testing apparatus would be a difficult task. According to the users, all the types of testing apparatus mentioned in this study have shown reliable results for studying the fatigue resistance of asphalt materials. On the other hand, the comparisons between them indicate little effect of the test
methods on the results, or on the differences explained pri-marily by testing in different test conditions.
Therefore it is reasonable to use the apparatus which is most economical and practical. In addition, experienced staff should
be available.
Due to the viscoelastic characters of asphalt concrete mix-tures, the fatigue resistance is affected by testing conditions such as speed of loading, magnitude of loading or deformation, loading time, rest periods and temperatures which demand more knowledge about the effect of these variables on the funda-mental mechanical properties of asphalt concrete materials. For example, Kirk (15) and Witczak (66) have shown that unique strain criteria have a high correlation with a continuous sinus-oidal loading condition. In contrast, the unique strain criteria did not exist as stiffness changes when some type of pulse load is used, which is more representative of field conditions. Witczak (66) has also shown that the parallel fatigue curve type found by researchers does not account for nonlinearity (stress dependence modulus) of aSphalt material characters. However, for those researchers reporting nonparallel fatigue curve type, the nonlinear behavior of mixture is directly taken into account for producing fatigue curves, which are the (nonlinear) repre-sentative of the aSphalt concrete character and should not be
omitted.
Another example, the beneficial effect on fatigue life of a rest period between load pulses can depend to a varying extent on testing condition (temperature, loading time, bitumen type etc)
(29,41).
Consequently, when the effect of test condition variables is superimposed, a wide variation in testing results can be found in reSpect to field conditions. To overcome the uncertainty in estimating fatigue life for use in a fatigue subsystem, the investigators have used an adjustment factor or so-called