http://www.diva-portal.org
This is the published version of a paper published in Journal of Public Health.
Citation for the original published paper (version of record): Värnild, A., Tillgren, P., Peter, L. [Year unknown!]
Factors related to the increasing number of seriously injured cyclists and pedestrians in a Swedish urban region 2003–17
Journal of Public Health
https://doi.org/10.1093/pubmed/fdz064
Access to the published version may require subscription. N.B. When citing this work, cite the original published paper.
Permanent link to this version:
Factors related to the increasing number of seriously injured
cyclists and pedestrians in a Swedish urban region 2003
–17
Astrid Värnild
1, Per Tillgren
1, Peter Larm
1,21
School of Health, Care and Social Welfare, Mälardalen University, Sweden 2
Department of Clinical Neuroscience, Karolinska Institutet, Sweden
Address correspondence to Astrid Värnild, Mälardalen University, School of Health, Care and Social Welfare, Box 883, SE-721 23 Västerås, Sweden. E-mail: astrid.varnild@mdh.se
A B S T R A C T
Background The number of seriously injured unprotected road users has increased during implementation of a road safety policy Vision Zero. The aim of the study is to identify factors associated with the increase in serious injuries among cyclists and pedestrians (even single pedestrian accidents) that occurred in an urban road space in a Swedish region 2003–17. The urban road space includes roads, pavements and tracks for walking and cycling.
Methods Data were retrieved from STRADA (Swedish Traffic Accident Data Acquisition) and NVDB (National Road Database). Descriptive statistics and logistic regression with odds ratios for sex, age and part of road space were assessed.
Results The number of seriously injured cyclists and pedestrians more than doubled from 2003 to 2017, with the greatest increase for pedestrians. Older age increased the probability of serious injury since 2012 for the group≥ 80 years and since 2015 for the group 65–79 years. No significant effect of sex. Most injuries occur in areas not transformed by Vision Zero.
Conclusions An increasing number of elderly persons in the generation born in the 1940s and increased life expectancy are important factors. There is a need to increase road safety measures that also promote active mobility.
Keywords accidents, epidemiology, management and policy
Background
WHO reports that 20–50 million people are injured in road traffic every year, many of whom are left with permanent disabilities1. Fatalities have decreased in many high-income countries since the turn of the millennium2. For example in the EU, which has the safest roads globally, fatalities have decreased by 20% since 20103. Nevertheless, road traffic crashes are the eighth leading cause of death globally1. Thus, Agenda 2030 has the goal of halving the number of road injuries between 2010 and 2020, and providing access to safe cities by 2030. This will be done by improving road safety, with special attention being given to those in vulner-able situations4. Different approaches to road safety man-agement have been developed. Although, there may be differences between countries in terms of what actions are taken and how they are realized and prioritized, some com-mon principles can be seen such as appropriate speed limits for roads, mandatory seat belt and helmet use, and efforts
to curb alcohol and drug use in traffic1,2. Many countries have made advances in road safety management by setting quantitative targets and adopting programmes for imple-menting measures to reach the targets5. Vision Zero is a well-known Swedish policy1,6–8 with the goal of reducing fatalities and serious injuries in road traffic to zero9,10
. Rural roads have been redesigned with median barriers or pro-vided with speed-cameras in conjunction with a national speed-limit revision. On urban roads, municipalities have had the possibility to reduce speeds to 30 km/h with the help of traffic bumps or in roundabouts, and to reduce speed limits from 50 km/h to 30 or 40 km/h more gener-ally11–13. During the implementation of Vision Zero, the number of fatalities has decreased in Sweden1,14, but
Astrid Värnild,Doctoral student Per Tillgren,Professor emeritus Peter Larm,Associate professor
© The Author(s) 2019. Published by Oxford University Press on behalf of Faculty of Public Health.
This is an Open Access article distributed under the terms of the Creative Commons Attribution License (http://creativecommons.org/licenses/by/4.0/), which permits unrestricted reuse,
distribution, and reproduction in any medium, provided the original work is properly cited. 1
whether this trend also holds for seriously injured road users is not confirmed15–17
.
A previous unpublished study shows that, although the number of seriously injured car occupants on national roads decreased when Vision Zero was implemented, the number of seriously injured unprotected road users increased18. This finding indicates that the decrease in seriously injured car drivers on national roads is countered by an increased num-ber of seriously injured unprotected road users, which may have serious implications for the Swedish road safety man-agement system. Further, single pedestrian crashes are not included in the target of Vision Zero because they are not usually defined as road traffic crashes17,18. Still, single pedes-trian crashes occur in areas also used by other road users, especially cyclists. Whether or not single pedestrian crashes should be included in the definition of road traffic crashes has been discussed19–21. Research on the implications of road safety management systems for unprotected road users is scarce22, probably because single pedestrian crashes often have an unclearly articulated position in studies, and pedes-trian crashes are often presumed only to refer to collisions with other road users23.
However, given the concurrent increase of obesity and obesity-related morbidity24, the Swedish government has emphasized the importance of developing infrastructure that stimulates more walking and cycling, which is in line with Agenda 203025. Much has been done in Sweden to reach road safety targets during the implementation of Vision Zero1,14. Despite this, the number of seriously injured unprotected road users has increased, most of whom are cyclists and pedestrians16 in urban road spaces, which besides roads also include pavements and tracks for walking and cycling22,26. More than 80% of all seriously injured road users in an urban road space are cyclists and pedestrians, almost evenly distributed between cyclists and pedestrians16. Importantly, the reason why the number of seriously injured unprotected road users has increased is unknown. In Sweden, the municipalities are the responsible road author-ities for urban areas, and thus are responsible for the design of infrastructure and for most road space maintenance. It is therefore important to adopt a regional perspective when trying to understand the increased number of seriously injured cyclists and pedestrians in urban areas.
The present study aims to identify factors associated with serious injuries of cyclists and pedestrians including also sin-gle pedestrian accidents in an urban road space during the implementation of Vision Zero between 2003 and 2017 in the Swedish Region of Västmanland. Three objectives are addressed: (a) How has the number of serious injuries
among cyclists and pedestrians developed in the region from 2003 to 2017? (b) What role do demographic factors includ-ing sex and age play in this development? (c) What role do different parts of the road space linked to Vision Zero mea-sures play in this development?
Methods
Data about seriously injured cyclists and pedestrians
Data was retrieved from the Swedish registry STRADA (Swedish Traffic Accident Data Acquisition)27. The data in STRADA has been collected since the year 2000 by emer-gency hospitals for patients, regardless of whether they were hospitalized or sent home. Since 2003, this data has been complemented by data from police reports. In Sweden, only two regions have submitted data from the start, and Region Västmanland is one of these. The registry has been built up successively, and in 2016, STRADA became a national regis-try with data from all regions28.
For this study, all cyclists and pedestrians seriously injured (also from single pedestrian accidents) in an urban road space consisting of roads, pavements and tracks in Region Västmanland during the period 2003–17 were identified. This yielded a total of 403 cases, of which 197 concern cyclists and 206 pedestrians. The geographic location for each injury included in the study was also examined in the National Road Database (NVDB)29to determine if the loca-tion had been transformed by Vision Zero when the injury occurred. This study used cross sectional data for the region that was annually collected for a period offifteen years.
Measurements
Serious injuries
Health care data in STRADA is linked to the AIS-scale (Abbreviated Injury Scale). The scale estimates the severity of every injury on a six-degree scale where AIS 1 is a minor injury and AIS 6 is a maximum-severity injury related to mortality, but the scale does not estimate an injury’s long-term consequences30. Therefore, the ISS-score (Injury Severity Score) is used, which is an adaptation of the AIS-scale where the AIS scores for a person’s most serious injur-ies from at most three of six defined bodily regions are squared and summed. The ISS value varies between 1 and 75, and a seriously injured person is defined by an ISS score >8, according to the STRADA registry’s definition; this cut off is used in the present study to define serious injury.
2 JOURNAL OF PUBLIC HEALTH
The road space
The road space was divided into non-road areas, such as pavements and tracks for cycling and walking, and Vision Zero and Non-Vision Zero roads respectively. Vision Zero has primarily focused on safe design of roads where cyclists and pedestrians encounter motor vehicles. Therefore, only roads are divided into Non-Vision Zero and Vision Zero road areas. Vision Zero roads are characterized by safe road/pedestrian crossing (reduced speed limit of 30 km/h and over- or underpass), reduced speed limit (40 km/h), and roundabouts. Of 403 injured cyclists and pedestrians, 68 were injured on Vision Zero roads and 95 on Non-Vision Zero roads with a speed limit of 50 km/h. Further, 240 cyclists and pedestrians were injured on tracks and pave-ments without speed limits. Of these, 130 were injured on tracks for cycling and walking, and 110 on pavements.
Cause of crash related to maintenance or other causes This concerns serious injuries related to maintenance, defined as seasonal characteristics of the road space such as ice, snow, gravel and wet leaves, but potholes and loose pav-ing stones are also included as confounders. Other causes are design problems of the road space like obstacles, curbs and other edges, and problems related to the bicycle’s func-tioning or mistakes by the individual cyclist or pedestrian, like getting a bag stuck in the bicycle wheel or having bad shoes.
Municipality size
Region Västmanland is a Swedish metropolitan area, and the proportion of the population that lives in an urban area has increased from 86–88% between 2005 and 201531–32. The region consists of 10 municipalities, with one municipality having 55% of the inhabitants (271,000). None of the other nine municipalities in the region has more than 26 000 inha-bitants33. Whether the injury occurred in an urban munici-pality (≥ 100,000 inhabitants) is included as a confounder.
Statistical analysis
In order to describe the development of the incidence of serious injuries among cyclists and pedestrians in the region from 2003 to 2017, the number of seriously injured cyclists and pedestrians in five three-year intervals was ini-tially identified and presented. Three-year intervals were used to reduce the effect of large fluctuations that can occur between single years. Secondly, demographics and injury characteristics for seriously injured persons in the region were presented with mean values for age and per-centages for all other characteristics. Thirdly, the important demographic characteristics, including age and sex, for the development of the incidence of serious injuries from 2003 to 2017 were analysed with a series of multiple logis-tic regression analyses, yielding Odds Ratios (OR) and 95% Confidence Intervals (CI). Odds ratios for sex and age in four three-year periods, compared to the reference period 2003–05, were calculated. The analyses were adjusted for cause of crash and municipality size. Finally, the influence of Vision Zero roads was studied using a similar series of multiple logistic regression analyses related to the five given time periods using Non-Vision Zero roads as a reference.
Ethics
This study has been approved by the Swedish Ethical Board in Uppsala, Sweden (Dnr 2015/016/1)
Results
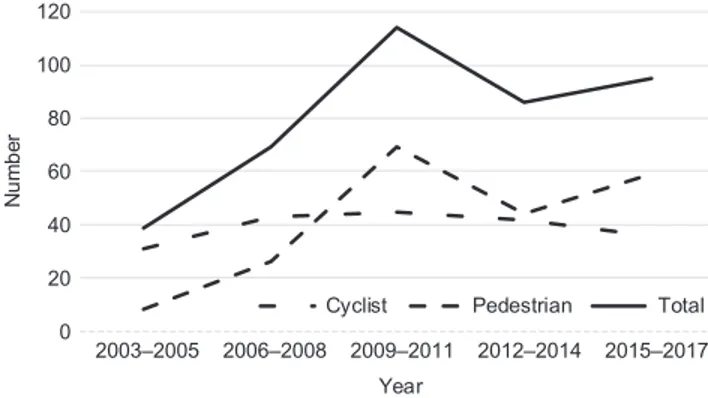
The number of seriously injured cyclists and pedestrians in urban areas of Region Västmanland more than doubled from 2003 to 2017 and almost tripled from 2003–05 to 2009–11, only to decrease thereafter, Figure1. When disen-tangling cyclists from pedestrians, we found that the increase was attributable to pedestrians with a more than sevenfold increase, while the number of seriously injured cyclists ini-tially increased but then stood still. There were fewer ser-iously injured pedestrians than cyclists from the start, but beginning in 2009–11 there were more seriously injured pedestrians than cyclists.
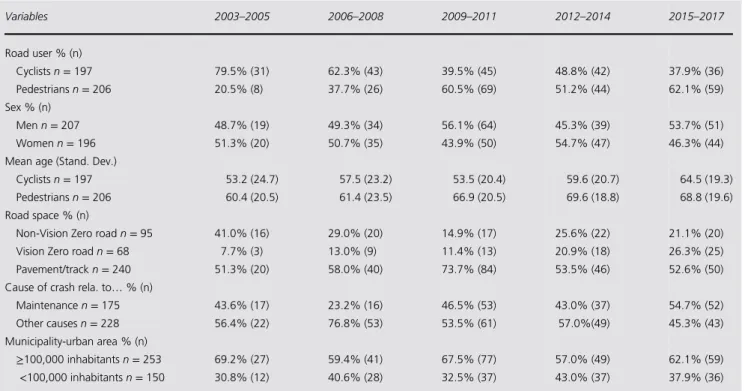
Further, demographic characteristics of seriously injured cyclists and pedestrians, and crash circumstances, are described in Table 1. Mean age increased during the study period from 53.2 years to 64.5 years for cyclists and from 60.4 years to 68.8 years for pedestrians. The proportion of cyclists and pedestrians that were seriously injured on Vision Zero roads increased from 7.7% to 26.3%, while the pro-portion that were seriously injured on Non-Vision Zero
0 20 40 60 80 100 120 2003–2005 2006–2008 2009–2011 2012–2014 2015–2017 Nu mb er Year
Cyclist Pedestrian Total
Fig. 1 Number of seriously injured cyclists and pedestrians.
roads decreased from 41% to 21.1%, although the relative numbers were stable. For all the periods, more than 50% of the injuries occurred on pavements and tracks.
The logistic regression analysis of demographic factors including age and sex showed that sex had no influence dur-ing the period, Table 2. In contrast, older age increased the probability of serious injuries among cyclists and pedestrians from 2012 and forward. In particular, the age group 65–79 years was 6.09 (CI 1.86–19.89) times more likely to be ser-iously injured than the youngest age category during 2015–17. Similarly, compared to the youngest age category, the oldest age group (≥80 years) was associated with increased probability of serious injuries (OR 4.33, CI 1.18–15.89) during 2012–14, and this increased during 2015–17 (OR 9.81, CI 2.33–41.26). All multiple logistic regression analyses were adjusted for cause of crash and municipality size. The importance of older age remained when road space was included in the analysis, Table3.
Logistic regression analyses in Table 3 also showed that roads having been transformed by Vision Zero increased the probability of serious injuries compared to Non-Vision Zero roads during the time periods 2012–14 (OR 4.36, CI 1.04–18.31) and 2015–17 (OR 5.91, CI 1.36–25.65). Cyclists and pedestrians also had an increased probability of serious injuries on pavements and tracks compared to Non-Vision Zero roads during 2009–11 (OR 4.13, CI 1.66–10.29).
Discussion
Mainfindings of this study
The number of seriously injured cyclists and pedestrians more than doubled during the period when Vision Zero was being implemented, most of which increase can be attributed to pedestrians while the number of seriously injured cyclists stood still. One reason for the increased number of seriously injured pedestrians may be the increase in population during the study period33. On the other hand, in a previous unpub-lished study we showed that the increase of serious injuries among unprotected road users was independent of changes in population 2003–1418. Another explanation may be that, nationally, the distance travelled by pedestrians increased by 50% between 1995 and 2014, while distance travelled by cyclists decreased somewhat34. Thus, the increase in ser-iously injured pedestrians may due to their being more phys-ically active. Importantly, however, our finding shows that when the Vision Zero programme-which predominately focused on reducing fatalities on the roads among car users and cars’ collisions with unprotected road users9,10 – was implemented in Sweden, the number of seriously injured unprotected road users actually increased instead of decreasing.
From 2003 to 2017, the mean age of seriously injured pedestrians and cyclists increased for cyclists from 53.2 to
Table 1 Demographics and injury characteristics of serious injuries
Variables 2003–2005 2006–2008 2009–2011 2012–2014 2015–2017 Road user % (n) Cyclistsn = 197 79.5% (31) 62.3% (43) 39.5% (45) 48.8% (42) 37.9% (36) Pedestriansn = 206 20.5% (8) 37.7% (26) 60.5% (69) 51.2% (44) 62.1% (59) Sex % (n) Menn = 207 48.7% (19) 49.3% (34) 56.1% (64) 45.3% (39) 53.7% (51) Womenn = 196 51.3% (20) 50.7% (35) 43.9% (50) 54.7% (47) 46.3% (44) Mean age (Stand. Dev.)
Cyclistsn = 197 53.2 (24.7) 57.5 (23.2) 53.5 (20.4) 59.6 (20.7) 64.5 (19.3) Pedestriansn = 206 60.4 (20.5) 61.4 (23.5) 66.9 (20.5) 69.6 (18.8) 68.8 (19.6) Road space % (n)
Non-Vision Zero roadn = 95 41.0% (16) 29.0% (20) 14.9% (17) 25.6% (22) 21.1% (20) Vision Zero roadn = 68 7.7% (3) 13.0% (9) 11.4% (13) 20.9% (18) 26.3% (25) Pavement/trackn = 240 51.3% (20) 58.0% (40) 73.7% (84) 53.5% (46) 52.6% (50) Cause of crash rela. to… % (n)
Maintenancen = 175 43.6% (17) 23.2% (16) 46.5% (53) 43.0% (37) 54.7% (52) Other causesn = 228 56.4% (22) 76.8% (53) 53.5% (61) 57.0%(49) 45.3% (43) Municipality-urban area % (n)
≥100,000 inhabitants n = 253 69.2% (27) 59.4% (41) 67.5% (77) 57.0% (49) 62.1% (59) <100,000 inhabitants n = 150 30.8% (12) 40.6% (28) 32.5% (37) 43.0% (37) 37.9% (36) 4 JOURNAL OF PUBLIC HEALTH
64.5 years, and for pedestrians from 60.4 to 68.8 years of age. The multivariate analyses showed an increased probabil-ity of serious injuries from 2012 for the ≥80 years of age group, together with an increased probability for the 65–79 years of age group from 2015. One possible explanation for the increased number of serious injuries among older cyclists and pedestrians in the Region of Västmanland is that people are getting older in Europe as a result of the 1940s baby-boom generation and an increased life expectancy21,35,36. In Region Västmanland, the populations of 65–79 year-olds and≥80 year-olds increased during 2015–17 in comparison with 2003–05, while the population of persons younger than 50 years was unchanged, and the population of 50–64 year-olds decreased33. Thus, the increasing age of seriously
injured cyclists and pedestrians may merely reflect the increasing age of the population. Older unprotected road users are also a vulnerable group in the road traffic. A national study about pedestrians covering 2003–08 reports 83.9% more injuries for the≥75 years of age group than for the 65–74 years of age group37. Nationally, the 80 years and older group will increase by 50% between 2018 and 202838. It is therefore important that measures are taken to protect older unprotected road users.
The transformation of roads from Non-Vision Zero to Vision Zero roads also had a direct effect on seriously injured cyclists and pedestrians in our study. Results from the multivariate analyses showed an increased probability of being seriously injured on Vision Zero roads compared to
Table 2 Adjusted odds ratios and 95% confidence intervals for associations between demographic characteristics and serious injuries stratified by three-year intervals
Variables 2006–2008 2009–2011 2012–2014 2015–2017
OR (C.I.) OR (C.I.) OR (C.I.) OR (C.I.)
Sex Men (reference) 1.00 1.00 1.00 1.00 Women 1.07 (0.46–2.48) 0.69 (0.32–1.48) 1.18 (0.52–2.65) 0.46 (0.19–1.13) Age 0–49 (reference) 1.00 1.00 1.00 1.00 50–64 1.18 (0.38–3.64) 1.35 (0.48–3.81) 1.09 (0.34–3.52) 2.95 (0.88–9.85) 65–79 0.87 (0.31–2.49) 1.31 (0.51–3.35) 2.10 (0.78–5.63) 6.09 (1.86–19.89) ≥ 80 2.99 (0.80–11.24) 2.99 (0.84–10.65) 4.33 (1.18–15.89) 9.81 (2.33–41.26) Note: Adjusted for cause of crash and municipality size.
Table 3 Adjusted odds ratios and 95% confidence intervals for the association between road space characteristics and serious injuries stratified by three-year intervals
Variables 2006–2008 2009–2011 2012–2014 2015–2017
OR (C.I.) OR (C.I.) OR (C.I.) OR (C.I.)
Sex Men (reference) 1.00 1.00 1.00 1.00 Women 1.04 (0.44–2.45) 0.84 (0.38–1.87) 1.19 (0.52–2.71) 0.47 (0.19–1.17) Age 0–49 (reference) 1.00 1.00 1.00 1.00 50–64 1.04 (0.31–3.45) 1.71 (0.57–5.16) 1.07 (0.31–3.64) 3.18 (0.91–11.13) 65–79 0.92 (0.32–2.66) 1.44 (0.54–3.83) 2.05 (0.75–5.59) 6.42 (1.89–21.88) ≥ 80 2.86 (0.76–10.78) 2.88 (0.78–10.69) 4.00 (1.06–15.06) 7.32 (1.61–33.34) Road space N-VZ road (reference) 1.00 1.00 1.00 1.00 Vision-Zero road 2.84 (0.57–14.10) 4.15 (0.95–18.03) 4.36 (1.04–18.31) 5.91 (1.36–25.65) Pavement/Track 2.17 (0.83–5.66) 4.13 (1.66–10.29) 1.75 (0.60–5.11) 2.11 (0.83–5.37) Note: Adjusted for cause of crash and municipality size.
Non-Vision Zero roads, from 2012. Since the start, the focus of Vision Zero has been to design safe roads and to prevent collisions between cars and unprotected road users by means of speed reductions on urban roads to 30 km/h9,10. However, two-thirds of all road traffic casualties in Europe are unprotected road users, and two-thirds of these are injured in single crashes because of ageing population and urbanization21. It thus appears that unprotected road users involved in single crashes should be included in the measures undertaken within Vision Zero.
What is already known on this topic
To our knowledge, no previous study has addressed the development of seriously injured cyclists and pedestrians in urban traffic during a period when the road safety measure of Vision Zero was implemented. Previous studies on road safety have focused on injuries from multiple crashes and single crashes for cyclists. Pedestrians in single crashes have been excluded from these studies19,20,22,39.
What this study adds
This study has multiple implications for public health, given its finding that seriously injured older unprotected road users in urban areas increased. First, the aging population and increasing life expectancy will require traffic manage-ment systems that prevent fatalities and serious injuries among unprotected road users. Two, this is particularly important because Agenda 2030 has the goal of halving the number of road injuries and providing access to safe cities. Three, given that physical activities such as walking and cyc-ling have large health benefits, designing a road management system that encourages physical activity should be of high priority. The study also adds a regional perspective, which is important since in Sweden, municipalities are the responsible road authorities for implementing Vision Zero urban areas. The region of Västmanland was one of two regions that reported data to STRADA from 2003 and forward enabling us to identify serious injuries during a long time period. All data in the study are linked to a road space defined by demarcating a particular subset of public space22,26. Defining the road space is important in order to clarify the environment of the examined area in a study.
Limitations of the study
Although the study includes data covering fifteen years, it includes relatively few injured cyclists and pedestrians, giving wide confidence intervals that impair statistical power. A lar-ger population may have yielded more significant associa-tions. The study also includes a limited number of
demographic factors, which limits the interpretation of what role demographic factors have for the increased number of serious injuries.
Conclusion
The number of seriously injured cyclists and pedestrians has increased in a regional urban area during the implementation of Vision Zero during 2003–17, with pedestrians being espe-cially affected. There is therefore a great need to increase road safety measures for cyclists and pedestrians, and this would also promote public health by improving the condi-tions for more active mobility.
The probability of serious injuries among cyclists and pedestrians has been increasing since 2012 for the 80 years and older group, and since 2015 for the 65 years and older group. The increasing number of old people in the 1940s baby-boom generation together with increased life expect-ancy are an incipient public health problem.
Funding
This work was supported by the Swedish Transport Administration [Trafikverket 2014/49856].
References
1 World Health Organization. Global Status Report on Road Safety 2018. Geneva: World Health Organization, 2018.
2 International Traffic Safety Data and Analysis Group (IRTAD). Road Safety Annual Report 2018. Paris: OECD/ITF, 2018.
3 European Commission Road Safety http://ec.europa.eu/roadsafety
(accessed March 29, 2019).
4 United Nations General Assembly. Transforming Our World: The 2030 Agenda for Sustainable Development (A/RES/70/1). New York: United Nations, 2015.
5 Wegman F, Berg H-Y, Cameron I et al. Evidence-based and data-driven road safety management. Int Assoc Traffic Safety Sci Res 2015; 39:19–25.
6 European Commission. White Paper on Transport—Roadmap to a Single European Transport Area—Towards a Competitive and Resource-Efficient Transport System. Luxembourg: Publications Office of the European Union, 2011.
7 Kim E, Muenning P, Rosen Z Vision zero: a toolkit for road safety in the modern era. Inj Epidemiol 2017;4(1):1–9.
8 Mayor of London. Vision Zero Action Plan. Taking Forward the Mayor’s Transport Strategy. London: Transport for London, 2018.
9 Swedish Government. Nollvisionen och det trafiksäkra samhället [Vision Zero and the Safe-Traffic Society]. Stockholm: Government offices, 1997.
6 JOURNAL OF PUBLIC HEALTH
10 Tingvall C, Haworth N. Vision Zero—an ethical approach to safety and mobility. The 6th ITE International Conference: Road Safety & Traffic Enforcement Beyond 2000; 6–7 September 1999 in Melbourne. pp. 1–9. 11 Bergh T, Remgård M, Carlsson A et al. 2+1-roads Recent Swedish
Capacity and Level-of-Service Experience. Transportat Res Procedia 2016;15:331–45.
12 Vadeby A, Forsman Å. Traffic safety effects of new speed limits in Sweden. Accid Anal Prev 2017;114:34–9.
13 Belin MA, Tillgren P, Vedung E et al. Speed cameras in Sweden and Victoria, Australia—a case study. Accid Anal Prev 2010;42:2165–70. 14 Swedish Transport Administration Analys av trafiksäkerhetsutvecklingen
2017 – Målstyrning av trafiksäkerhetsarbetet mot etappmålen 2020 [Road safety development analysis 2017– Target management of road safety work to achieve the 2020 target]. Borlänge: Swedish Transport Administration, 2018.
15 Värnild A, Tillgren P, Eilert-Petersson E Regional uppföljning av det nationella trafiksäkerhetsmålet – exemplet Västmanlands län 1989–2009 [Regional follow-up of the national road safety goal— the example of Västmanland county 1989–2009]. Socialmed Tidskr 2012;89(6):513–24.
16 Värnild A, Belin MA, Tillgren P VISION ZERO – ROAD TRAFFIC EFFECTS FOR SEVERELY INJURED IN A SWEDISH COUNTY. Safety 2016 World Conference; 18–21 September 2016; Tammerfors, Finland.: Injury Prevention; 2016. 17 Weijemars W, Bos N, Filtness A et al. Burden of injury of serious
road injuries in six EU countries. Accid Anal Prev 2018;111:184–92. 18 Värnild A, Belin MA, Larm P et al. Incidence for seriously injured
road users in a Swedish region 2003-2014, in the perspective of national road safety policy. Unpublished manuscript.
19 Berg H-Y, Ifver J, Hasselberg M. Public health consequences of road traffic injuries—estimation of seriously injured persons based on risk for permanent medical impairment. Transp Res Part F 2016;38:1–6. 20 Methorst R, Schepers P, Christie N et al.‘Pedestrian falls’ as
neces-sary addition to the current definition of traffic crashes for improved public health policies. J Transp Health 2017;6:10–2. 21 Methorst R, Eenik R, Cardoso J et al. Single unprotected road user
crashes: Europe we have a problem. Transp Res Proc 2016;14: 2297–305.
22 Schepers P. Pedestrian falls: A review of the literature and future research directions. J Safety Res 2017;62:227–34.
23 Aarts LT, Commandeur JJF, Welsh R et al.. Study on Serious Road Traffic Injuries in the EU. Brussels: European Commission, 2016. 24 Baum F. The New Public Health, 4th edn. Melbourne, Australia:
Oxford University Press, 2016. ed.
25 Swedish Government. Uppdrag att ta fram förslag till nationell trafikslagsövergripande plan för utveckling av transportsystemet och
trafikslagsövergripande länsplaner för regional transportinfrastruktur [Mandate to develop proposals for national transport master plan for development of transport and intermodal county plans for regional transport infrastructure] (Government Letter 2012/13:119). Stockholm: Regeringskansliet, 2012.
26 De Rome L, Boufous S, Georgeson T et al. Bicycle crashes in differ-ent riding environmdiffer-ents in the Australian Capital Territory. Traffic Inj Prev2014;15:81–8.
27 Swedish Transport Agency STRADA (Swedish Traffic Accident Data Acquisition) https://transportstyrelsen.se/sv/vagtrafik/statistik/
Olycksstatistik/om-strada/(accessed March 29, 2019).
28 Fredlund T, Frank M The Swedish national information system for traffic accidents and injuries. Safety 2016 World Conference; 18–21 September 2016; Tammerfors, Finland: Injury Prevention, 2016. 29 Swedish Transport Administration NVDB (National Road Database)
https://www.trafikverket.se/tjanster/system-och-verktyg/data/ Nationell-vagdatabas/(accessed March 29, 2019).
30 Genarelli TA, Wodzin E AIS 2005: a contemporary injury scale. Inj Int J care Inj2006;37:1083–91.
31 Statistics Sweden. Localities and urban areas 2015. https://www.scb. se/Statistik/MI/MI0810/2015A01/MI0810_2015A01_SM_ MI38SM1601.pdf(accessed March 29, 2019).
32 Statistics Sweden. Localities 1960-2005https://www.scb.se/statistik/ MI/MI0810/2005A01x/MI0810_2005A01x_SM_MI38SM0703.pdf
(accessed March 29, 2019)
33 Statistics Sweden. Population data.http://www.statistikdatabasen.scb. se/pxweb/sv/ssd/START__BE__BE0101__BE0101A/
BefolkningNy/table/tableViewLayout1/?rxid =cf98fcf4-052e-48b3-9cef-9fdf611ed492(accessed March 29, 2019).
34 Swedish government agency for transport policy analysis. Cyklandets utveckling i Sverige 1995–2014 – en analys av de nationella resvaneundersökningarna. [The development of cycling in Sweden 1995–2014 —an analysis of the national travel surveys]. Stockholm: Swedish govern-ment agency for transport policy analysis, 2015.
35 Christensen K, Doblhammer G, Rau R et al. Ageing populations: the challenges ahead. Lancet 2009;374:1196–208.
36 Rechel B, Grundy E, Robine JM et al. Ageing in the European Union. Lancet 2013;381:1312–22.
37 Öberg G. Skadade fotgängare—Fokus på drift och underhåll vid analys av sjukvårdsregistrerade skadade i STRADA [Injured pedestrians– Focus on operation and maintenance in the analysis of healthcare registered injuries in STRADA]. Linköping: Swedish National Road and Transport Research Institute, 2011.
38 Statistics Sweden. Sveriges framtida befolkning 2018–2070 [Sweden’s future population 2018–2070]. Stockholm: Statistics Sweden, 2018. 39 Mindell J. Road travel casualties. J Transp Health 2017;6:7–9.