Drought Severity-Duration-Frequency Analysis of Hydrological Drought
Based on Copula Theory
Jaewon, Kwak1, Yeon Soo, Kim, Jong So, Lee, and Hung Soo, Kim Department of Civil Engineering, Inha University, Korea
Abstract. Recently, in Korea, occurrences of floods and droughts have been increased due to the climate change and drought is a recurrent phenomenon. But, recurring prolonged droughts have caused consequences and diverse impacts on human system. Therefore, understanding drought characteristics is indispensable element in well-prepared drought management. This study aims to investigate the hydrological droughts of upstream of Namhan river in Korea. For modelling of the joint distribution of drought duration and drought severity, the copula method is used to construct the bivariate drought distribution and return period from the predetermined marginal distributions of drought duration and drought severity.
Keywords : Drought, Joint Probability Analysis, SDF curve
1. Introduction
The world is suffering from many natural disasters such as floods and droughts due to climate change. Especially, the drought casts heavy burden on water resource management and planning, thus we may need more research works for preparing for counter measures on droughts. However. we still have lacks of quantitative analysis of drought characteris-tics and of research works on impact of climate change on droughts. So, this study showed the validation of drought analysis using joint probability which is resulted from drought variable relations, and drought frequency analysis by joint probability was performed ac-cording to the copula theory. The study also assessed and predicted quantitatively the im-pact of climate changes on hydrological droughts for watershed scale.
This study used the observed runoff to apply and evaluate hydrological droughts in dif-ferent levels, and induced drought events to analyze drought frequency in conventional way. Analysis of the relationship between drought variables such as drought duration and drought severity was performed and drought frequency analysis using Clayton copula theo-ry was performed. Then the results from frequency analysis and drought severity-duration-frequency curve by copula theory.
2. Drought Identification using streamflow series
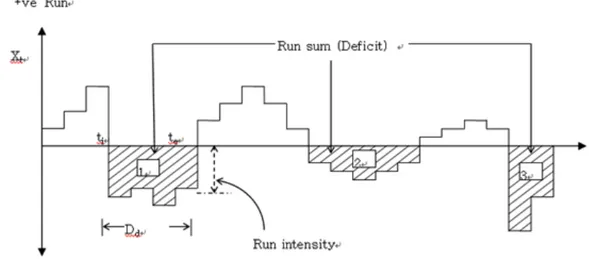
Yevjevich (1967) proposed the theory for identifying drought parameters and in-vestigating their statistical properties: (a) duration, (b) severity, and (c) intensity. The most basic element for deriving these parameters is the truncation or threshold level, which may be a constant or a function of time. A run is defined as a portion of time series of drought variable Xt, in which all values are either below or above the selected truncation level of Xo accordingly it is called either a negative run or a positive run. Figure 1 represents a plot of a drought variable denoted by Xt which is intersected at many places by the truncation
1 Center for Hydrology and Ecology Civil Engineering Department Inha University, Korea Tel: 82-32-872-8729
thereof. Various statistical parameters concerning drought duration, magnitude and intensi-ty at different truncation levels are much useful for drought characterization.
Figure 1. Drought characteristics using the run theory
3. Analysis of Existing Drought Characteristics in Study Area
Analysis of drought characteristics was conducted for Namhan River upper stream basin in Korea peninsula. Run Theory described in the last Paragraph was applied for anal-ysis method, for which streamflow data of Namhan River upper stream which are study ar-ea were collected and applied.
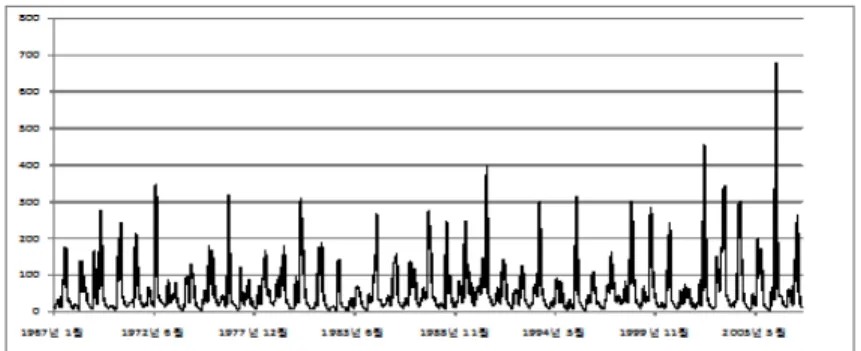
As the total streamflow series targeted on yearly and monthly streamflow data is considered important in Run Theory, this study also applied Run Theory to streamflow in monthly unit. Generally for statistical analysis, the more the number of data, the more reli-ability can be secured, but it is said that the relireli-ability of domestic data before 1960s could not be secured due to movements of observatory locations and missing observations during the war, and actually, all of the observatory data show differently depending on the loca-tion of observaloca-tion staloca-tions. Accordingly, in consideraloca-tion of these situaloca-tions, this study collected the streamflow data in monthly unit by selecting the existing data from 1967 to 2007.
Drought characteristics were analyzed using collected streamflow data from 1967 to 2007 of Namhan River upper stream basin in Korea. Streamflow data can be defined as Drought Duration, Drought Severity, and Drought Interval according to Run Theory. The truncation level at this time is the same as the average streamflow of each month.
( ). In the perspective of streamflow, the drought is defined as the streamflow lower than truncation level. In addition, each drought is defined in drought du-ration, drought severity, and drought interval. The drought duration is defined as the peri-od(month) when the drought continues with the monthly streamflow lower than average streamflow of the corresponding months. The drought severity is defined as the level of lower monthly streamflow than average streamflow of the corresponding months, which can be also described as the hydrological shortage caused by the drought. Lastly, the drought interval can be defined as the period between drought and drought, which can be described as the period from starting point of nth drought to starting point of n+1th drought.
Figure 2. Streamflow data of Namhan River Upper Stream
Drought time series can be obtained by using 70% quantile streamflow value of each month as truncation level and by cutting the streamflow in corresponding truncation level for streamflow of Namhan River upper stream, and drought time series of the target basin is shown on following Figure 3. After calculating the drought time series as above Figures, drought characteristic can be analyzed by measuring the duration and area of rele-vant drought time series and drought intervals.
0 20 40 60 80 100 120 140 0 1 2 3 4 5 6 7 8 9 Drought Severity(mm) Drought Duration(month) Figure 3. Drought scatter diagram of Namhan River Upper Stream
3.1 Statistical Analysis of Drought Properties
Analysis of drought properties will be conducted using drought characteristics cal-culated in the last Paragraph. This study will carry out statistical analysis of drought dura-tion and drought severity which are major drought variables. First of all, non-exceedance probability of each drought variable can be obtained using drought characteristics calculat-ed in the last Paragraph and Position-plotting formula, which can be expresscalculat-ed in probabil-ity distribution.
(1)
Among drought time series through observed streamflow, drought duration and severity showed high interrelation, and correlation coefficients between drought duration and severity were calculated as 0.8759 for Namhan River upper stream. And the greatest drought event was 35 months of drought duration and 855 cms.month of drought severity from October 1981 to October 1984 for Namhan River upper stream basin.
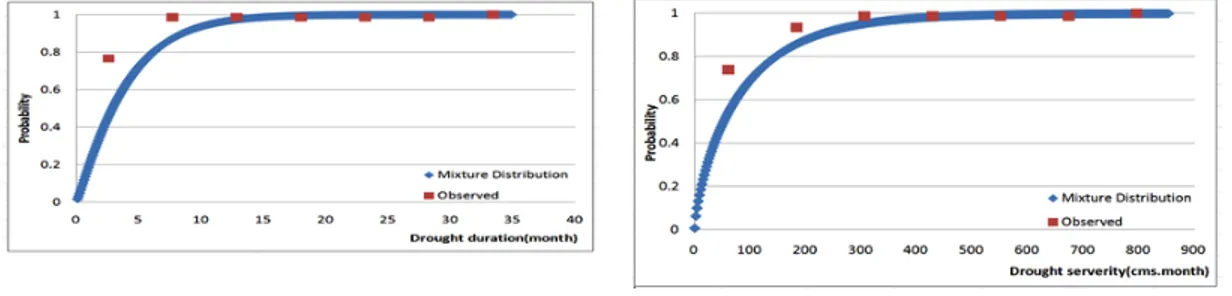
In order to simulate distribution of drought time series data, the drought needs to be decided in advance. For general hydro-geometric data, Exponential Distribution and Weibull Distribution are known to be appropriate, and in particular, Weibull Distribution is known to be appropriately simulating in drought duration (Shiau 2003, 2006; Wong et al. 2008). Also, Gamma distribution is known to be appropriately simulating drought severity (Shiau 2006). This study used binary variable Weisbull Distribution to simulate drought duration and interval, and selected binary variable Gamma Distribution to simulate drought severity.
(a)CDF of drought duration (Namhan upper stream) (b) CDF of drought severity (Namhan upper stream)
Figure 4. CDF of drought property(1967-2006)
4. Bivariate analysis of drought
4.1 Bivariate analysis of drought characteristic using Copula
Copula function was first suggested by Sklar in 1959 as a method of understanding complex dependence structure between various random variables. It is used to measure the relationship between more than 2 random variables like correlation coefficient. However, as the correlation coefficient is effective in oval-type distribution, it is considered proper to understand dependence structure by copula rather than by correlation coefficient for the variables which show the tendency of the same directivity. Generally, copula's definition is conducted as follows;
(2)
(3)
from which multivariate probability density function can be found through indi-vidual probability density function and copula function. Also, it can be acknowledged that copula function is the ratio of joint probability distribution against individual marginal probability distribution.
Recently, among Archimedean copula, Clayton copula, Gumbel copula, and Frank copula are much used, and this study will adopt Clayton copula which can be widely ap-plied with its simplicity and availability. Clayton copula formula is expressed as follows;
In particular, Clayton copula is considered appropriate in drought simulation be-cause it is known to well reflect tail structure of droughts.
Each drought duration and severity is simulated by Weibull and Gamma distribu-tion, and the big relationship between drought duration and severity can be confirmed through stochastic model. Subordinate dependence relationship shown in these distribu-tions can not be expressed in bivariate exponential distribution that shows common multi-variate distribution or in bimulti-variate Gamma distribution. Therefore, considering this subor-dinate dependence relationship, copula-based drought distribution is analyzed in order to simulate bivariate distribution. In the first place, joint probability distribution is calculated for drought duration and severity which are the most important characteristics of the drought. The Joint-CDF for copula-based drought duration and severity can be expressed as following formula;
(5)
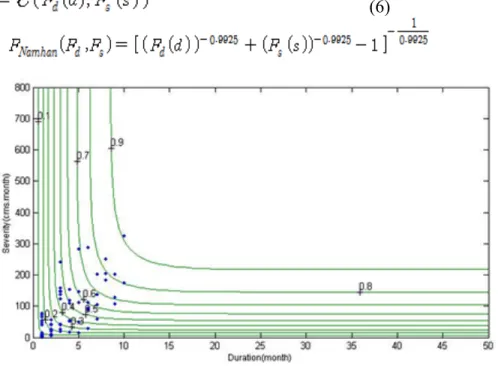
Here, and refer to univariate CDF of drought severity and drought duration, and refers to the parameter for relationship between and calculated by copula. As the parameters estimated by CML method, a parameter estimation method, indicate 0.9925 for Namhan river upper stream, distributions of drought duration and severity for each ba-sin can be expressed as follows;
(6)
Figure 5. Joint CDF Contour map of drought duration and severity of Namhan River Upper Stream
4.2 Drought Severity-duration-frequency analysis of drought
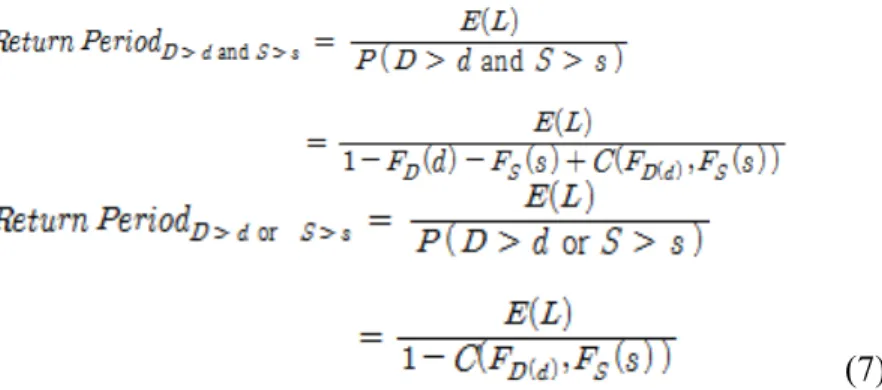
ty(D>d and S>s), or the probability of exceeding either one of drought duration and severi-ty(D>d or S>s). For each condition, copula based return period can be defined as follows;
(7)
Accordingly, it becomes possible to combine many drought duration and severity in the same return period, and the bivariate return period can be expressed in following Figure 6.
Figure 6. Joint return period of drought of Namhan River Upper Stream
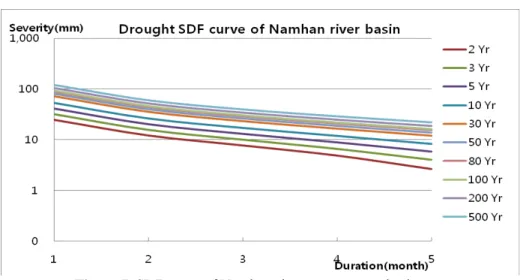
As I described earlier, the drought duration and severity according to the return period can be approximated into an IDF curve, which is commonly used in frequency analysis. In order to achieve this, a similar method for inducement of an IDF curve is needed. Approx-imation is to be done in the form of the drought duration – severity, according to the return period’s frequency. By placing duration on the x-axis, and severity on the y-axis, an SDF curve can be drawn, which can be utilized to calculate the probability drought amount.
Figure 7. SDF curve of Namhan-river upperstream basin
The difference between the SDF curve and the IDF curve is that, generally the proba-bility rainfall amount estimated by IDF curve uses Areal Reduction Factor (ARF) to ap-proximate areal rainfall. Whereas the SDF curve is based on runoff, therefore the basin ar-ea is implicit in the drought arar-ea. So, the SAD (Drought Severity-Arar-ea-Duration) curve, commonly used in drought analysis, should be understood as containing the concept of ar-ea within. By utilizing the SDF curve from the above, it’s possible to calculate the proba-bility drought amount, and it could be used as an important preliminary data to deal with future droughts. For example, if there were to be a plan to deal with droughts lasting 3 months within 30 year return period by the upper reaches of South-Han River, measures need be taken corresponding to the approx. runoff depth of 51mm.
Conclusion
The drought is one of important elements in the perspective of water resource plan and management. Trying to understand the drought is also considered as the important step in solving drought-related problems occurring in the perspective of water resources. In this study conducted the analysis of drought characteristics through observed streamflow data and continuous theory for study areas of Namhan-river upper stream. In addition, analysis of drought characteristics was conducted to droughts by establishing drought probability through Copula theory. As the SDF curve from copula theory, it’s possible to calculate the probability drought amount, and it could be used as an important preliminary data to deal with future droughts.
Acknowledgment. This work was supported by the National Research Foundation of Korea (NRF) grant funded by the Korea government (MEST) (No.2011-0028564).
References
Yevjevich, V.,(1967). An objective approach to definitions and investigations of continental hydrologic drou ght. Hydrology Paper No. 23, Colorado State Univ., Fort Collins, Colo.
Shiau JT (2003) Return period of bivariate distributed hydrological events. Stoch Env Res Risk Assess 17(1– 2):42–57
Shiau JT (2006) Fitting drought duration and severity with twodimensional copulas. Water Resour Manag 20 :795–815