School of Innovation, Design and Engineering
Creating Continuous Flow and Internal
Transport Optimization at IKEA
Distribution Center, Älmhult
Master thesis work
30 Credits, D-level
Product and Process Development, Concurrent Engineering Master Thesis Programme Innovation and Product Design
Wenfeng Miao
Linwang Li
Report code:
Commissioned by: DC Älmhult, IKEA Tutor (company): Mattias Johannesson
Tutor (university): Lars Lord
Abstract
The objective of this project is to improve productivity and efficiency for the inbound material handling operations in the warehouse of DC Älmhult. After three weeks pre-study in place of the distribution center, the authors have observed several problems existing in the current production, among which three types of wastes are found and analyzed by using VSM that are pick and drop, operator waiting time and inefficient transport.
Two typical cases chosen from the inbound production are analyzed to reflect the current process and address problems. Fish-bone tool is used to identify wastes and roots.
To eliminate or reduce the wastes, recommendations and solutions are developed by creating continuous flow combining with internal transport optimization. Future-state VSMs are drawn based on the suggested changes in line with continuous flow.
Different productions models are simulated by elaborately developed excel sheets. A „distance table‟ is developed by using Microsoft Excel to help the loading or unloading leaders with the gate steering function so as to minimize internal transport distance. A new layout of the conveyor system is also suggested to lower the idle transport rate.
(Keywords: IKEA DC Älmhult, Warehouse, VSM, Waste, Continuous Flow, Internal Transport)
Acknowledgements
It would not have been possible to write this master thesis without the help and support of the kind people around us, to only some of whom it is possible to give particular mention here. Above all, we would like to extend our immense thanks to our thesis supervisor Mr. Lars Lord for his great help, support and patience on us. During the whole thesis project period, Mr. Lord, with his enriched working experience and wealth of knowledge, provided us with invaluable advice and guidance on both an academic and personal level. His wise suggestions and advices assured us on the right track doing this project and his encouragement and inspiration to us motivated us to perform the work with much more confidence.
We would also like to express our tremendous gratitude to Mr. Mattias Johannesson, our project tutor, for giving us the honorable and golden opportunity of doing our thesis work at DC Älmhult, IKEA as well as his time and efforts on this project. During our visits there, Mr. Johannesson arranged our interviews with people from different functions and departments, which helped us quite a lot in understanding the general information flow, material flow as well as strategies that adopted by DC Älmhult. We are very grateful that the people we interviewed showed great patience and interests on this project. The valuable information and suggestions from Mr. Johannesson and his colleagues made an indispensable contribution towards the completion of this thesis project. Thus, our heartfelt thanks also belong to all the staff we met in DC Älmhult.
We certainly would like to show our gratefulness to our respectable and beloved teacher Mr. Sabah Audo, who is also the thesis examiner. We are thankful to get valuable information and guidance from him on writing the thesis, we also felt so lucky to take the many interesting and practical lectures delivered by him.
Our special thanks to dear Professor Mats Jackson for helping us on the project and thesis writing.
Last, but by no means least, we would like to thank our families for their endless and selfless support and encouragement on us.
Table of Contents
1 INTRODUCTION ... 10 1.1 BACKGROUND ... 10 1.2 PROBLEM STATEMENT ... 10 1.3 OBJECTIVE ... 11 1.4 DELIMITATIONS ... 11 2 COMPANY PRESENTATION ... 12 2.1 IKEAGROUP ... 122.1.1 IKEA Group Structure ... 12
2.2 IKEADISTRIBUTION CENTER,ÄLMHULT ... 13
2.2.1 The working organization chart of DC Älmhult ... 14
2.2.2 Warehouse 4 in DC Älmhult ... 14
3 METHODOLOGY ... 17
3.1 RESEARCH METHOD ... 17
3.2 QUALITATIVE AND QUANTITATIVE ANALYSIS ... 17
3.3 DATA COLLECTION ... 18
3.3.1 Empirical data ... 18
3.3.2 Data Collection Technique ... 18
3.4 CASE STUDIES ... 19
4 THEORETICAL FRAMEWORK ... 21
4.1 MATERIAL HANDLING ... 21
4.2 CONTINUOUS FLOW ... 23
4.2.1 Advantages of Continuous Flow Production ... 23
4.2.2 Steps of creating continuous flow ... 25
4.3 VALUE STREAM MAPPING ... 28
4.3.1 Advantages of Value Stream Mapping ... 28
4.3.2 Steps of creating a value stream map. ... 29
4.4 VALUE ADDING AND NON-VALUE ADDING OPERATIONS ... 29
4.5 WASTES FROM LEAN PERSPECTIVE ... 30
4.6 FISH BONE CHART ... 30
4.7 TIME STUDY ... 31
4.7.1 Cycle Time ... 31
4.7.2 Takt Time ... 32
4.8 FIRST IN FIRST OUT (FIFO) LANES ... 32
4.9 COMPUTER SIMULATION ... 33
5 CURRENT STATE ... 34
5.1 CURRENT PRODUCTION STATE AND STRATEGY ... 34
5.1.1 Different operational function teams and flexible working schedule ... 34
5.1.3 Complicated handling materials ... 35
5.1.4 The Unit load and it‟s type - pallet classes ... 35
5.1.5 Facilities ... 36
5.1.6 Flow strategy and article storing strategy in DC Älmhult ... 37
5.1.7 Gate strategy ... 37
5.2 INFORMATION FLOW ... 38
5.2.1 Inbound information flow ... 39
5.2.2 Outbound information Flow ... 39
5.2.3 Internal hauler function ... 39
5.2.4 The scanning processes involved in inbound and outbound flows ... 40
5.3 INBOUND PROCESS ... 41
5.3.1 Goods receiving ... 41
5.3.2 Put away ... 43
5.4 OUTBOUND PROCESS ... 44
6 ANALYSIS AND SOLUTIONS ... 45
6.1 QUESTION 1 ... 45
6.1.1 Identify product families. ... 45
6.1.2 Identify work elements and make a time study ... 46
6.1.3 Current state VSM for DC Älmhult, IKEA ... 48
6.1.4 Process analysis of the current state VSM ... 50
6.2 QUESTION 2 ... 55
6.2.1 Excess pick and drop ... 55
6.2.2 Operator waiting time ... 56
6.2.3 Inefficient transport ... 56
6.3 QUESTION 3 ... 57
6.3.1 Case study for creating continuous flow ... 57
6.3.2 Solutions for decreasing inefficient transport ... 61
6.3.3 Proposal of reengineering the conveyor system ... 64
7 PRODUCTION SIMULATION ... 66
7.1 SIMULATIONS OF CURRENT PRODUCTION ... 66
7.1.1 Predefined variables ... 67
7.1.2 Production parameters ... 67
7.2 SIMULATIONS OF FUTURE PRODUCTION ... 69
7.2.1 Pre-defined variables ... 69
7.2.2 Production parameters ... 70
7.3 ONE-PIECE FLOW SCENARIO ... 72
8 CONCLUSION ... 73
9 FUTURE RESEARCH ... 75
Lists of Figures
Figure 2.1 IKEA Group Structure ... 12
Figure 2.2 The bird's-eye view of DC Älmhult ... 13
Figure 2.3 Working organization structure of DC Älmhult ... 14
Figure 2.4 The structure of in-feed station at conventional hall 2 ... 15
Figure 2.5 The structure of out-feed station at conventional hall 2 ... 16
Figure 3.1 The comparison of Deduction and Induction ... 17
Figure 3.2 Case study procedure ... 20
Figure 4.1 One piece flow VS Batch production ... 24
Figure 4.2 Illustration of product family ... 25
Figure 4.3 Two ways of distributing work ... 27
Figure 4.4 Split works ... 28
Figure 4.5 The circuit ... 28
Figure 4.6 Four steps of creating VSM ... 29
Figure 4.7 FIFO lane ... 32
Figure 5.1 The gate arrangement map ... 38
Figure 5.2 The work flow in Internal Hauler function ... 40
Figure 5.3 Inbound flow scanning processes ... 40
Figure 5.4 Outbound flow scanning processes ... 41
Figure 5.5 Goods receiving processes ... 41
Figure 5.6 The procedure of taking in trucks ... 42
Figure 6.1 VSM symbols used within this thesis ... 48
Figure 6.2 Current state SILOA VSM ... 50
Figure 6.3 Current State Rack A VSM ... 50
Figure 6.6 Fish bone diagram with identified wastes and their roots ... 55
Figure 6.7 The future production flow for SA ... 58
Figure 6.8 Future production flow for RA ... 60
Figure 6.9 Demonstration of position setting and travel distance ... 63
Figure 6.10 The new structure of conveyor system ... 65
Figure 7.1 Current SA circuit ... 68
Figure 7.2 Current SA Split ... 68
Figure 7.3 Current RA ... 69
Figure 7.4 Future SA auto palletizing ... 71
Figure 7.5 Future SA manual palletizing ... 71
Figure 8.1 Comparison of pick and drop frequency between current and future flow ... 73
Figure 8.2 Improvement by continuous flow ... 73
Lists of Tables
Table 3.1 Interviewees from different functions ... 19Table 5.1 Resource arrangement in Warehouse 2 and 4 ... 34
Table 5.2 Three types of wooden pallets ... 35
Table 6.1 5 Product Families ... 45
Table 6.2 Work elements and their relevant motions and CT ... 47
Table 6.3 Work elements with their cycle capacities ... 48
Table 6.4 The Route-Distance matrix for the case ... 49
Table 6.5 Time calculation table for SA inbound ... 52
Table 6.6 Time calculation table for RA inbound ... 54
Table 6.7 Total pick and drop time for SA and RA ... 56
Table 6.8 Time calculation for future SA flow ... 59
Table 6.9 Time calculation for future state RA ... 61
Lists of Appendix
Appendix I Layout of Warehouse 4 ... 78
Appendix II Current State VSM for SA ... 79
Appendix III Current State VSM for RA ... 80
Appendix IV Future state VSM for SA (Manual Palletizing) ... 81
Appendix V Future State VSM for SA (Automatic Palletizing) ... 82
Appendix VI Future State VSM for RA... 83
Appendix VII Part of the Coordinates Table ... 84
Terminology
Words or abbreviation
Astro: The Warehouse Management System adopted by DC Älmhult, IKEA
Consignment: contains information about what is dispatched from one consignor (supplier), article, dispatched quantity and order information. One consignment line represents each article‟s data (Quantity, No of Unit Loads). There might be many Consignment Lines under one shipment.
Co-worker/forklift Alternative words for operator
CT: Cycle time
DC: Distribution Center
EP, HP, IP: Euro Pallet, Half Pallet, IKEA Pallet Full Pallet: A standard quantity of one unit load
HM: Handling material, such as: wooden pallet, paper pallet and loading ledge
Idle transport Vehicle runs with no freight loaded.
Inbound Bay (Area): The temporary storage area in front of the inbound gate used for unloading articles from LU
LOT: The no. of pallets processed in one cycle simultaneously
LU: Loading Unit, it is a load of goods, usually represented by number plate of a Truck, Container nr, Railroad carriage nr. and/or Swap body nr.
MHA: Material Handling Area
Outbound Bay (Area): The temporary storage area in front of the outbound gate used for loading articles to LU
Pallet: In this document, most of the time, pallet refers to one unit load instead of only handling material. Substitutive words are unit, article or item
Picked Pallet: The quantity is less than the standard quantity on one unit load, thus one or several multi-packs of the articles have to be picked.
PLS: Picking line system
Shipment: A shipment contains information about destination, planned arrival date, booked volume and weight etc.
SILO: Full-automated high bay. It's designed for standard sized unit loads. Unit Load: A unit load contains a number of consumer packages and/or multi-packs kept by a handling material, most often a pallet, and intended for a forklift handling.
1 Introduction
1.1 Background
IKEA Distribution Center Älmhult (hereinafter referred to as “DC Älmhult”) is one of the most efficient distribution centers among IKEA world. It fulfills excellent Key Performance Indicators (KPI) such as filling rate, lead time and total productivity. However, as a member of the global IKEA family, DC Älmhult always faces severe competition from not only outside logistics companies but also other distribution centers inside IKEA. As the first and one of the biggest distribution centers in IKEA, DC Älmhult deals with a huge throughput with various articles in volumes and categories. Thus there is a big potential for improvement in the daily production and even moving forward a small step may result in a substantial saving.
Mr. Mattias Johannesson is an inbound process developer in DC Älmhult, IKEA. As the title implies, his responsibility is to make progress with the in-bound production in the DC. As a motivated staff, he always has many visions of changes for a higher efficiency. Thanks to his interests in the academic perspectives from outsiders, the authors are invited to the project to provide their insights on potentials of higher productivity in the warehouse.
1.2 Problem Statement
Due to the broad ranges of the production, it is necessary to narrow down the study scope and then find out a means by which the production can be described and analyzed. A Value Stream Mapping method is adopted to meet the need above and it is also a tool to help with gathering and organizing information. However, although VSM is a common analysis tool used in manufacturing field, some adaptations have to be made when applying it to material handling scenario.
Through shop floor visits and interviews with the staffs, some observed problems were listed, for example:
Some external transporters have to wait for gate slots during peak hours Long lead time for inbound process.
Lack of operators during rush hours
Long distance travelling or idle internal transport
To address the reasons of the problems, a thorough and structured work should be conducted guided by relevant theories and methodologies. VSM helps us not only understand the current production state but also, more importantly, find where the inefficient works are, in other words, it enables us to see wastes. Non-value-added activities, also called wastes, are the causes of inefficiency. Without an insight from lean concepts, people could not be aware of them or even take them as granted in production.
Based on lean thinking, identifying and constantly reducing wastes is the way to achieve higher production efficiency. But how can we proceed to that? What lean methods or tools can we use? The current inbound material handling operations in DC Älmhult are performed, to a certain extent, like a batch production in a manufacturing factory. Incoming units go through processing steps in different sizes of batch from upper to lower stream processes. For example the put away process can not start until the last article is unloaded. Under this production style, DC Älmhult experiences intermittent and erratic internal material flows. Continuous flow is always considered as a perfect lean production model with minimum wastes and highest efficiency. Thus can the wastes be reduced by creating continuous flow?
As internal transport is one of the most important tasks in warehouse, process development should also be combined with efforts on increasing transport efficiency so that a maximum effect can be achieved.
In accordance with the statements, three research questions are developed as follows:
1. How can we describe the current inbound processes of the target material handling production in DC Ä lmhult by using VSM?
2. What wastes can we identify from the current state VSM? 3. How can we eliminate the wastes?
1.3 Objective
The objective of this thesis is to improve efficiency of the inbound material handling production by creating a continuous flow and optimizing internal transport on the basis of VSM analysis of the current production at IKEA DC Älmhult.
A current state VSM will be carried out to describe and analysis the studied production. Based on that, non-value-added activities among the processes will be identified. The wastes will be removed or reduced by transforming the current production pattern into the paradigm of continuous flow in association with optimizing the internal transport. A future state VSM will be drawn to illustrate the recommended inbound scenarios. Important efficiency indicators in the suggested production will be calculated to compare with the current findings.
To facilitate the implementation of the continuous flow solutions, excel sheets will be developed to simulate different production situations by the predefined variables. It will enable production managers to estimate the expected outcomes of continuous flow production under various circumstances. A „distance table‟ will be created with automatic calculation of the internal transport distance and an optimal solution for gate allocations.
1.4 Delimitations
Due to the limited time, this thesis only focuses on inbound processes of the two selected product families within conventional hall 2 at warehouse 4. Multi-cycle processes will not be mentioned due to it is integrated with outbound flow. The study is based on single inbound event and will have limitation to reflect the situation that many inbound consignments are processed simultaneously.
2 Company Presentation
2.1 IKEA Group
In 1943, IKEA was founded by Ingvar Kamprad in a small town named Älmhult in Sweden. The name was formed by acronymzing the founder‟s name (Ingvar Kamprad), the farm where he grew up (Elmtaryd) and his home parish (Agunnaryd). Ikea is famous for designing and delivering flat-packaged furniture and features in Scandinavian modern style furniture and accessories. Their products have covered the areas of storage options, lighting, decor products, kitchen appliances and pet care. So far, IKEA has become the largest furniture retailer in the world. By 31st August 2010, The IKEA Group had operations in 41 countries – 29 Trading Service Offices in 25 countries and 27 Distribution Centers and 11 Customer Distribution Centers in 16 countries. The IKEA stores owned by the group had reached 280 which are spread in 26 countries.1
2.1.1 IKEA Group Structure
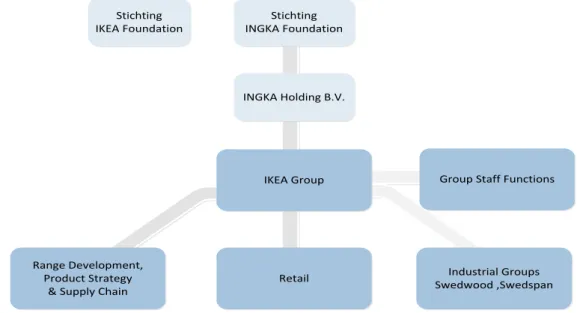
The IKEA Group is the subsidiary of INGKA Holding B.V., which is in turn owned by Stichting INGKA Foundation in the Netherlands. The group works in four basic areas: range strategy & product development, production, supply and retail. Within the group, Swedwood is the name for industrial companies which source the manufacturing of IKEA furniture. It is responsible for ensuring compliance with IWAY - the IKEA Way of Purchasing Home Furniture Products. These are IKEA's internal policies governing everything from environmental issues, worker safety, compliance with local laws and regulations to social welfare. IKEA of Sweden, which located in Älmhult, Sweden, is the center for designing and developing the IKEA range of products. Their designing principle is: to create a better everyday life for the many people. The IKEA Group structure is illustrated as follows:
Stichting IKEA Foundation Stichting INGKA Foundation INGKA Holding B.V. IKEA Group Retail Range Development, Product Strategy & Supply Chain
Industrial Groups Swedwood ,Swedspan
Group Staff Functions
Figure 2.1 IKEA Group Structure2
1 IKEA Yearly Summary FY10, IKEA Intranet 2
2.2 IKEA Distribution Center, Älmhult
DC Älmhult is the very first distribution center that was built by IKEA. It‟s the oldest and most complicated one in the IKEA world. It is one of 6 DCs in Distribution Services North Europe. Together with Torsvik DC, DC Älmhult serves 34 IKEA stores in Sweden, Norway, Finland, Denmark, Iceland and the Spanish islands.
DC Älmhult has a total storing capacity of 180 000 , among which, the SILO capacity takes up 62 900 and the rest comes from the Conventional Racks. The total flow in IKEA‟s financial year 2010 was 1 700 000 of which 540 000 was transit flow. There are 149 gates in sum which are allocated in different warehouses and used for receiving and dispatching IKEA articles. Regarding the facilities, there are about 120 forklifts and 8 strapping machines being used within the whole DC. GTS and Astro are the operational IT systems used within this center.
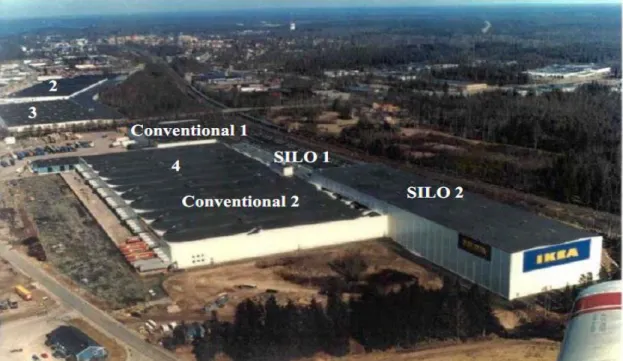
This distribution center comprises of four different buildings, among which warehouse 1 was shut down but can be used for external warehouse if needed; warehouse 3 works as backup and is rarely used. Warehouse 2 and 4 are the main houses being used. Most of the transiting flows are going through warehouse 2; in addition, low frequency half pallets can be stored here. Other types of pallets also can be stored in warehouse 2 when there is no enough space in warehouse 4. Approximately 85% of DC flow occurs in Warehouse 4. The following picture is the bird‟s eye view of the whole distribution center.
Figure 2.2 The bird's-eye view of DC Älmhult3
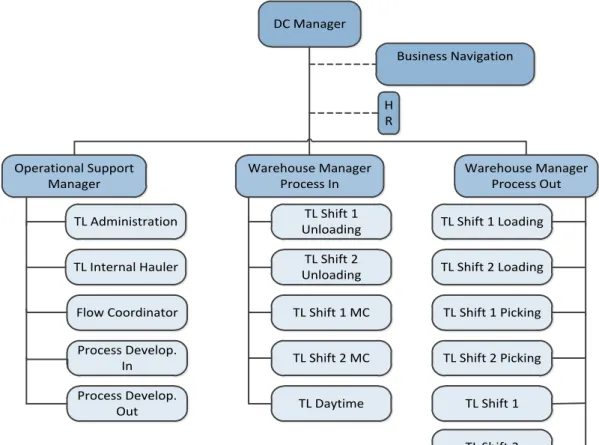
2.2.1 The working organization chart of DC Älmhult
DC Manager Business Navigation H R Operational Support Manager Warehouse Manager Process In Warehouse Manager Process Out TL Administration TL Internal Hauler Flow Coordinator Process Develop. In Process Develop. Out TL Shift 1 Unloading TL Shift 1 MC TL Shift 2 MC TL Shift 2 Unloading TL Daytime TL Shift 1 Loading TL Shift 1 Picking TL Shift 1 TL Shift 2 Loading TL Shift 2 TL Shift 2 PickingFigure 2.3 Working organization structure of DC Älmhult4
2.2.2 Warehouse 4 in DC Älmhult
Warehouse 4 is the biggest and most modern building in DC Älmhult. The latest rebuilding of it was finished by 2000. There are two conventional halls with racks and two SILOs (Automated High Bay Warehouse) in this warehouse, among which only conventional hall 1 has two floors.
2.2.2.1 Layout of Warehouse 4
There are 58 gates located in Warehouse 4. They are used for unloading and loading containers and trucks. In front of each gate, there is one buffer area with different size from 80 m3 up to 120 m3. These areas serve as temporary storing area for unloading and loading articles. There is one railway tracking along conventional hall 1 and SILO 1, which is only used for unloading wagons. Please refer to Appendix I for detailed layout information.
The conventional piece picking operation takes place in the basement of conventional hall 1. Only on-line piece pickings are performed here, which means the picked pallets will be transported directly into loading areas. While the PLS (Picking Line System) is located in the middle part at the back of conventional hall 2 and between two SILOs. There are four picking stations in PLS with conveyors, which are connected to both SILOs, bringing the pick-from-pallets to them. The piker at the station will divide the pick-from-pick-from-pallets among some of the pick-to- pallets. When pick-to-pallets are finished, they will be taken back into SILO2 by a shuttle.
4
SILO 1 and 2 are located to the east of conventional hall 2 and connected with each other by conveyors beneath the floor. There are three in-feed stations to SILOs: one is located at rail side, one in the south part of conventional hall 1 and one in the south part of conventional hall 2. There are three out-feed stations to SILOs as well. Two of them are located in the same place as the first two in-feed stations and the third one is located in the north part of conventional hall 2 rather than south part.
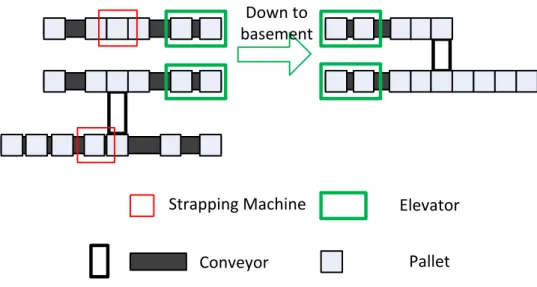
The in-feed station at conventional hall 2 is composed of three conveyors, two strapping machines and two elevators. On each conveyor, there are scanners and many sensors installed on them. Some scanners are in charge of scanning the pallet label and the others can scan the dimension of the pallet. The sensors are responsible for reporting the locations of pallets on the conveyor to PLC system which in turn controls the movement of conveyors. The figure below illustrates the structure of the station.
Strapping Machine Elevator
Conveyor Pallet
Down to basement
Figure 2.4 The structure of in-feed station at conventional hall 2
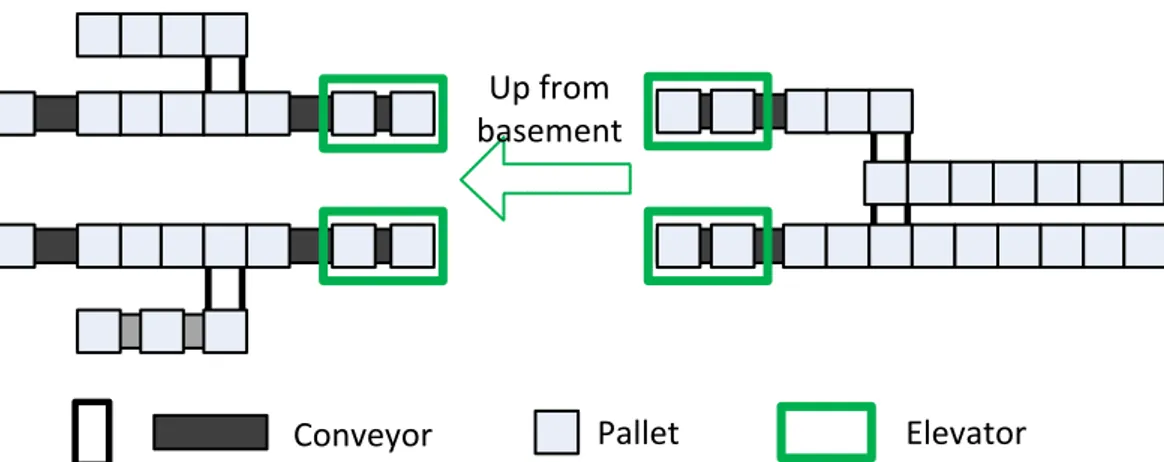
From the figure above, we can see that both the top and bottom conveyors are equipped with one strapping machine. The bottom strapping machine is an all-around one, i.e. it can strap all types of pallets. As there are scanners installed at the conveyors, when the rack pallets go through the conveyor for strapping, the system will get the information and route the strapped pallet to the end of the conveyor where the pallet will stay waiting for co-working picking it. If the pallet is intended for SILO, the system will route the strapped pallet to the middle conveyor via the connective conveyor. The strapping machine at the top conveyor can only deal with standard Euro and IKEA pallets. At each end of the top two conveyors, there is one elevator which can transport one IKEA pallet or two Euro pallets at one time. The elevators carry the pallets down to the conveyors beneath the floor where these two conveyors merge into one. The only one conveyor conveys the pallets into the conveyor loop that connects the SILOs. At the out-feed station, two conveyors stretch out from the basement. They transport the outbound pallets from conveyor loop to the elevators which elevate them up to the station. There is one conveyor jointed to each of the conveyor that connects with the elevator. So the out-feed station consists of four out-bound conveyors which enable more co-workers to pick the pallets simultaneously. Following is the figure that depicts the structure of out-feed station.
Up from basement
Elevator
Conveyor Pallet
3 Methodology
This chapter describes research approaches applied in the thesis and the outline of thesis structure and procedure.
3.1 Research Method
In research, there are two widely used methods of reasoning as inductive and deductive approaches.
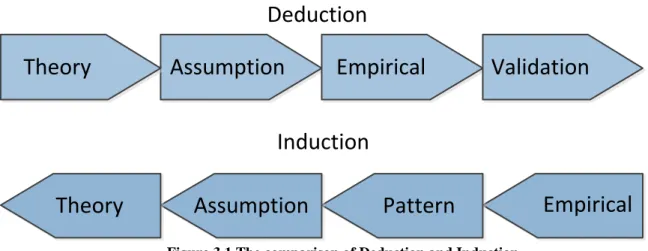
Deductive approach refers to the method starting with hypotheses or predictions derived from established theories. The hypothesis should be validated by empirical data and the final conclusion comes from the hypotheses. Based on established theories, researchers decide what information is collected, how the information is used and how the result is interpreted.
On the contrary, inductive method progresses from general phenomenon or empirical data towards theoretical conclusions.
Theory
Assumption
Empirical
Validation
Theory
Assumption
Pattern
Deduction
Induction
Empirical
Figure 3.1 The comparison of Deduction and Induction
Deduction is applied in the thesis. A hypothesis i.e. “to achieve higher efficiency of internal logistics by creating continuous flow and optimizing internal transport” is made at the beginning of the thesis based on the theories about lean production. Following the hypothesis, theories such as Value Stream Mapping, information flow and material handling etc. are applied to describe the current internal logistic processes. Further on, theories on seven types of wastes are used to identify non-value-added processes that cause inefficiency. Finally, continuous flow creation and outbound bay redesign is conducted based on the relevant theories about One-piece flow and layout design. In the thesis, empirical data is collected in line with the theories and finally to verify the assumption at the beginning.
3.2 Qualitative and quantitative analysis
Qualitative and quantitative analyses are the two major research methods.
Qualitative data reflects characteristics of objects in non-numerical way e.g. male or female, pretty or ugly. Qualitative analysis enables researchers to get in-depth understanding of human‟s beliefs, experiences, attitudes, behaviors and interactions. Oppositely in quantitative analyses, data is measured or valuated in numerical way e.g. length in meters, volume in cubic meters and speed in kilometer/hour.
This thesis implements the combination of qualitative and quantitative analyses. Qualitative analyses are used when dealing with explanatory findings from e.g. interviews and documents in order to get deep understanding of how the system works now and how it should be improved.
By collecting and analyzing quantitative data e.g. statistics of in/outbound material flows, productivities, capacities and equipment etc. the authors are able to define the present statues and then suggest solutions in a precise and measurable way. Quantitative analysis is also used to support the conclusion of the thesis by measuring performance of suggested scenario against the old scenario.
3.3 Data collection
3.3.1 Empirical data
Empirical data is categorized into primary data and secondary data. Primary data is the first-hand information collected by the researchers during the project. It is often collected through the means of surveys, interviews, questionnaires or observations. Secondary data is denoted as existing materials related to the current project but is gathered before the project. The sources of secondary data are normally books, documents or literatures.
3.3.2 Data Collection Technique
There are mainly four types of techniques for gathering data that are document, interviews, observations and questionnaires.
Document method refers to taking advantage of existing data e.g. books, articles or database that has been written or collected by others. Obtaining the information is a good starting point for data collection.
Interview is a method to gather information under certain topic through face-to-face dialog, phone or email etc. An interviewer gets deeper understanding of the topic by asking questions to or communicating with interviewees.
Observation is a data collection technique in which behavior and characteristics of objects or phenomena are systematically observed and recorded during they are taking place. Questionnaire is a data collection tool in which question sheets are created to gather
answers from respondents in either written or oral form.
In this thesis, interview, observation are carried out to collect primary data. Interviewing with production staffs provides the authors an insight mainly relevant to the present material flows e.g. operation processes, production style and working method etc. while respondents from different functional departments in the office give an overall picture on how the information flow is generated and passes through the whole DC. Interview is held through face-to-face conversation during the authors study in the company and also through email and phone when the authors are not in place.
Title Types of interview
Project manager / Process-in developer
personal meeting, phone and email
Mr. Range personal meeting, email Inbound planning personal meeting
Gate house personal meeting TL warehouse personal meeting TL internal Hauler personal meeting
Facility co-worker personal meeting / email Co-work warehouse personal meeting
Outbound planning personal meeting
Tuning personal meeting
Table 3.1 Interviewees from different functions
Observation is held towards production inside the warehouse during shop floor visiting. The authors watch and record the on-line production reality e.g. operation details, warehouse layout and daily working routines on the spot of warehouse during both working shifts. It endows the authors with much deeper knowledge and observed problems on the current workflow with the first-hand experience. During the observation, camera is used as a complementary recording means to paper and pen.
3.4 Case studies
Case study is method to conduct research on a specific object or phenomenon. Since the study target is from the real world, it is easy to be understood and interpreted. However the outcomes from a case study will have a limitation to be applied to other situation or cases. A case study is normally followed with research questions and it is progressed based that the frame and steps set by the questions.
There are three based steps to conduct a case study that are pre-study, analysis, writing report. The pre-study step includes two phases i.e. primary study by reading articles and other materials from library or Internet and interviews on relevant people to the case. In the analysis step, the authors should first gather and sort the collected information to one place, then allocate the materials around the project members and finally formulate the case problems or research questions into a few brief sentences. The writing step includes four sub-steps which are problem description, formulating report structure and conclusion.
The thesis project is conducted by a case study with the real typical production cases selected from IKEA daily production in order to reflect the processes and solve problems of the whole inbound production. The picture below shows how the case study is progressed through the project period. With document review and three weeks visit in place DC Älmhult, the authors had got a deep understanding of the current production and had grasped a lot of information and details on almost every aspect of the distribution center. Then after sorting and reordering the collected information, they are able to narrow down the project scope to conduct a deep
study with focus on the selected range. A preliminary analysis and solutions are discussed during the second time the authors visit the company to obtain important feedbacks regarding the project from other staffs. Time study is conducted during that period as a supplement of the first visit. A further study is conducted during the last phase finalized with a thesis report.
Current Scenarios Investigation
Literature Study
Sort and Reorder Information
Project Scope and Research Questions
Discuss on Preliminary Analysis and Solutions
Time Study
Further Research and Write Report
Shop-floor Visiting Interviews
4 Theoretical Framework
4.1 Material Handling
Material handling is a combination of operations including moving, storing, protecting and controlling. In a typical manufacturing facility, material handling tasks take about 25% of the work‐force, 55% of the factory, 87% of the production time and cause 15% to 70% of the total cost in the company.
An efficient material handing means provides the right amount of the right material in the right conditions at the right place in the right position in the right sequence for the right price by the right method. There are ten principles that guide the material handling activities toward higher efficiency.
Planning Principle
Material handling plan defines what materials, where to move and the method of transfer. The plan should be developed through discussion between the planners and all the people who will be involved or benefit from it. A big project planning usually requires a team with people from different functional departments e.g. engineering, operation, IT and finance or people outside the organization such as consultants and suppliers. A material handling plan should reflect both long-term strategies and the short term needs. It should also promote engineering of product, process design, process layout, and material handling methods in a holistic point of view rather than independent practices.
Standardization Principle
Standardization means less variety in Material handling methods and equipment usage.
For example standardization can be applied to size of containers, unit loads, operation processes and facilities (forklifts, conveyors and machines). The methods and equipment selected should be able to perform a variety of tasks in different conditions. Standardization should allow flexibility and modularity in the an acceptable range
Work Principle
Material handling work should be minimized at no expense of productivity and service quality. The work is measure by
Work = Flow (volume, weight or count per unit of time) * Distance
There are some guidelines to follow for the work principle:
Reducing works by simplifying processes through reducing, combining, shortening or even eliminating unnecessary moves.
Considering the pick-and-drop or placing materials in-and-out of storage as different motions and part of the distance moved.
Operation methods, process sequences and process/equipment layouts should be in accord with the goal of minimum work.
Using gravity where is possible to move materials with the consideration of safety and product damage.
Ergonomic Principle
Human capabilities and limitation should be fully considered and respected when designing the material handling tasks and equipment in order to ensure safety and efficiency. The principle applies to both physical and mental tasks.
Ergonomics is the science that seeks to adapt work or working conditions to suit the abilities of the worker.
The equipment should be able to reduce repetitive and arduous manual works and it should effectively interact with operators. Safety issue must be prioritized when designing the work shop and the equipment.
Unit load principle
A Unit load is one that can be stored or moved as a single entity at one time between two points of activity. Unit loads should be in proper size and designed to support the material flow and
inventory objectives in every stage of the supply chain.
Less work and effort will be required by working a number of individual items loaded as a single unit load than operating them separately. During production, small unit loads as few as only one item will result in less work-in-process and shorter item throughput time. Small unit loads also support the production strategies such as continuous flow, flexibility and just-in-time delivery. A mixture of different items in a unit load is in accord with just-in-time and customized supply strategies.
Space principle
Space utilization principle refers to effect and efficient usage of the three dimensional floor spaces. The principle suggests eliminating cluttered and unorganized spaces and blocked aisle in the operation areas. In the storage area, the storage density should be balanced with accessibility and selectivity. When transporting articles in the workshop, the overhead space can be considered as an option.
System Principle
All the material movements and storing operations should be considered and organized as a united entity. The material handling activities such as receiving, inspection, storage, production, assembly, packaging, unitizing, order selection, shipping, transportation and the handling of returns, should be integrated to form a coordinated system. Entity in the supply chain but outside the organization e.g. customers, suppliers, manufacturers and distributors are included in the system integration. The whole supply chain can benefit from the integration with shared and optimized inventory level, material and information flow, working method and demand prediction.
Automation Principle
Automation should be implemented to handling operations where is feasible to achieve higher efficiency, responsiveness, consistency and predictability.
Before installing new machines or automatic mechanism, effort must be made to find out the possibilities of improvements by simplifying or re-engineering the existing processes or
working method. Computer system is prioritized to where is suitable for effective integration of material flow and information administration. Successful automation can be found at interfaces, including equipment to equipment, equipment to load, equipment to operator, and control communications
Environmental principle
When designing material handling methods or selecting equipment, environmental impact and energy consumption should be taken into consideration. It is suggested to use recycled or reusable material handling material. Special treatment should be done for the hazardous materials.
Life cycle cost principle
A thorough economic analysis should be done to account for the entire life cycle of all material handling equipment and future systems
Life cycle cost consists of capital investment, installation, setup and equipment programming, training, system testing and acceptance, operating (labor, utilities, etc.), maintenance and repair, reuse value, and ultimate disposal. In the economic analysis, maintenance and spare part costs of the machines should be taken into account.
4.2 Continuous flow
Continuous flow, which is also named „one-piece flow‟ or „single-piece flow‟, is a concept which means, in the perfect scenario, items are processed one-piece at a time and moved directly from one process to the next. One processing step operates on only one piece and provides it to the next step when and just before the step needs it.
A work cell is a combination of operators, machines, materials and method. The processing steps are located close to each other in certain sequence. Through the cell, items are processed in a one-piece flow or in some cases in a consistent flow having small batch size maintained through the sequence of processes. To obtain and sustain an efficient continuous flow is the goal of a cell.
The most well-known cell layout is a “U” shape. Because it is more flexible in distributing work elements among operators and it makes the shortest distance between the beginning and the end points. But continuous flow can also be created in other layouts such as straight lines.
4.2.1 Advantages of Continuous Flow Production
Creating continuous flow by constantly eliminating wastes wherever is possible is the starting point for a company‟s journey towards lean. It is the crucial part of lean philosophies that reduces lead time from materials to finished goods and hence enhances quality, cuts cost and shortens delivery time. By creating flow, a company is forced to implement other lean techniques and thoughts such as preventive maintenance, built-in quality. Creating flow exposes inefficiency and brings the sense of urgency to solve problem at the first time because once problems happen in a flow, the whole production line stops and you have to deal with it right away or sink. The advantages of continuous flow are:
Minimizing resources. Continuous flow sustains the minimum input of people, machines, materials, etc., required to make certain product that means higher productivity and lower cost.
Reducing lead time from raw materials to finished goods. That grants faster response to the customer and less financial cycle time.
Defects and problems are quickly detected and solved instead of being hidden for a long time.
It encourages communication between operators or departments that in turn leads to quicker response to problems and constant improvements.
Here is an example that can illustrate the benefit to convert a traditional batch production into a continuous flow.
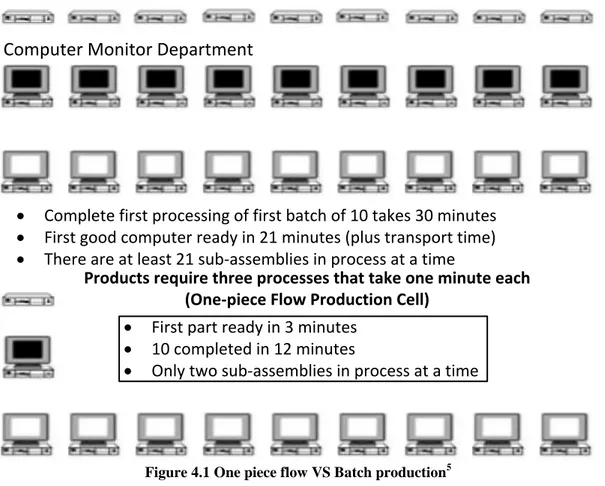
Supposing a computer manufacturer has batch production organized by 3 departments which are base department makes base, monitor department makes monitors and assembles base and monitor and test department inspects the quality of each finished good. Batch size in each department is 10 while it takes one minute to process each unit. Therefore it takes 21minutes to have the first finished item and 30 minutes for the whole batch ready to be shipped to customers while only 3mins value added time for each unit.
If we organize a continuous flow with batch size one by putting the facilities from the three departments close to each other making them into one work cell. Then we will reach the result that 12minutes to make 10 computers comparing 30mins in batch process while the first unit will be finished in 3mins instead of 21mins. Besides, under batch production, if defects occur in base department, it takes at least 21mins to discover with another 20 computers in the process could have the same problem. By contrast, it is only 3mins under continuous flow with at most 2 defective computers in the process.
Computer Monitor Department
· Complete first processing of first batch of 10 takes 30 minutes · First good computer ready in 21 minutes (plus transport time) · There are at least 21 sub-assemblies in process at a time
Products require three processes that take one minute each (One-piece Flow Production Cell)
· First part ready in 3 minutes · 10 completed in 12 minutes
· Only two sub-assemblies in process at a time
Figure 4.1 One piece flow VS Batch production5
However, in reality a pure one-piece flow rarely exists and it is not sensible to simply gather machines, supplier and operators together to achieve a one-piece flow where it is not
5
appropriate. An ideal one-piece flow provides us a direction when we initiate a continuous flow. It takes time and patience to obtain and improve flow while it is wise to use inventory or buffers where continuous flow is not possible currently. “At Toyota it means that using small lots, having processes close together, and keeping the material moving through processes without interruption is better than producing large batches of stuff and having them sit and wait.” (Liker, 2004)
4.2.2 Steps of creating continuous flow
According to Mike Rother and Rick Harris (2001), the basic steps to create a continuous flow are as follows:
1) Select a product family and draw a value stream mapping of that.
2) Identify work elements and make a time study for each work element from the selected product family.
3) Measure and configure machines, materials and layout for flow. 4) Distribute the work to operators
5) Connect to the customer and regulate the flow
6) Implement, sustain and improve.
Since the last two steps are not required by the company due to time limitation, only the first four steps will be explicated in this chapter.
Select a product family and draw a value stream mapping of that.
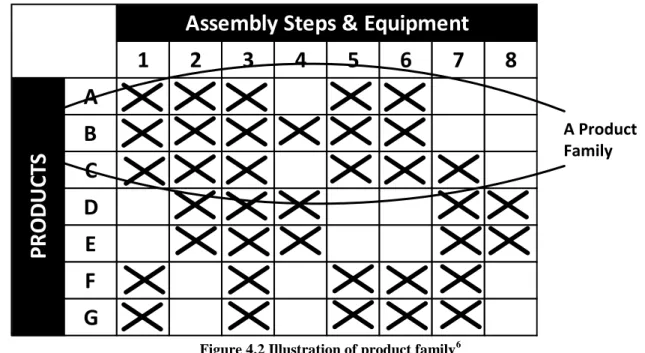
Before identifying the production family, one must understand the company‟s business goals and customer objectives. A production family is a group of products that go through similar sequence of final processing steps and machines. A value stream map usually looks into only one product family since drawing all product flows on one map would be too complicated. A product-process matrix form is often used to help us identify product families. Number of products in the family, customer demands and order frequency should be recorded.
1
2
3
4
5
6
7
8
A
B
C
D
E
F
G
Assembly Steps & Equipment
P
R
O
D
U
C
TS
A Product FamilyFigure 4.2 Illustration of product family6
6
The current state Value Stream Mapping should be done by collecting primary information on the shop floor. Important information should be filled in during this step are e.g. cycle time, lot size, number of operators, waiting time in between processes and inventory etc. In this step, one should collect as much information on the causes of wastes as possible and make notes of potential improvements.
There are some tips for mapping the current state production. (Rother & Shook, 2003)
Go through the actual routes of material and information flow and collect information by yourself
Start with a quick walk along the whole value stream to get a sense of the process sequence and flow. Then come back to collect data in each process.
Begin at the processes which are linked most directly to the customer.
Do not rely on previous files. Conduct the time study on your own by a stopwatch. Map the entire value stream yourself in order to get deep understanding of the whole
flow
Always draw by hand in pencil.
Identify work elements and make a time study
A work element is the smallest increment of work that could be moved to another person. It emphasizes on the work content that needs to be done by people but not machines. This helps us identify real value-added work from wastes. When we observe and record work elements, it is very crucial for us to not include wastes such as waiting for machine cycling, walking, adjusting or looking for tools, refilling materials etc. as work element. When conducting time study, make sure to measure at least 10 times for each work element to achieve a reliable data.
Measure and configure machines, materials and layout for flow
To form a work cell for the continuous flow of the selected product family, we must make sure that the cycle time of each machine in the cell is at least 20% faster than the takt time so that the customer‟s demand can be met. There are some tips suggested when the required machine is a bottleneck that cannot meet the takt time with a 20% margin.
Improve the machine itself by available techniques to reduce the cycle time or add more machines of the same type.
Create two cells instead of one.
Decrease numbers of products in the product family
Remove the bottleneck machine from the cell and use a pull and Kanban system to process the bottleneck step in batch.
The most efficient way to arrange the machines, workstations and materials for continuous flow is to organize them as if only one operator makes the item from beginning to the end. By this design, it avoids isolating activities and minimize inventory among the processes and can eliminate wastes as much as possible.
Distribute the work to operators.
The appropriate number of operators in the work cell is determined by the equation as below:
Number of operator needed in the work cell=Total time of all work elements/takt time
If the result is not an integer number such as 2.3, 4.6, take the integer part plus 1 i.e.3 or 5, and then try to eliminate that one operator by future continuous improvement.
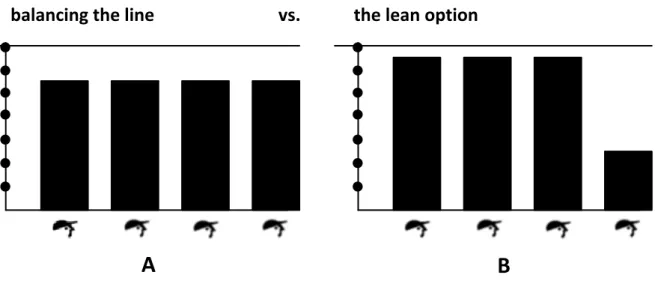
Operator loading method
When distributing work elements to operators, we sometimes have to face a problem on how to distribute a less-than-full work element among the operators. Traditional solution is to distribute work equally among operators with all operators not fully loaded. This method tends to causes waste of waiting into the cell and encourages isolated islands among the cell that finally would disturb the continuous flow. Therefore instead of evenly spreading workloads, the lean method is to distribute work to fully load every operator except one consuming almost all the takt interval. It exposes the waste and makes it easier to improve in future.
balancing the line vs. the lean option
A
B
Figure 4.3 Two ways of distributing work7
Work element allocation among operators.
There are many ways to distribute work elements depending on the factors such as cycle time, type of cell etc. Here are illustrations of the most commonly used approaches as follows:
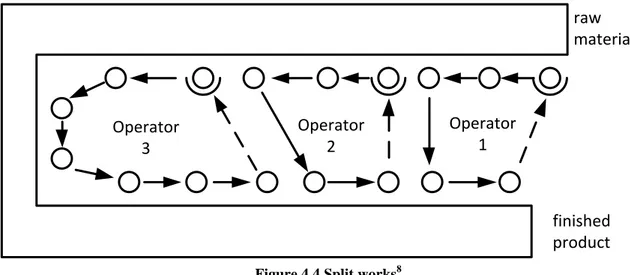
Split the work
Each operator performs one portion of the total work content. In this pattern, it is normally more efficient to assign the same operator the first and the last work elements so that a pacing effect can be created for the whole cell. This method provides the possibilities to have various combinations of work elements that facilitate the changes when work elements need to be redistributed following kaizen or due to customer demand.
7
Operator 3 Operator 2 Operator 1 raw material finished product
Figure 4.4 Split works8
The circuit
Assigning all work elements to every operator with the next operator following the first with a gap of a few stations. This approach has a natural pacing effect and is easier to implement. It also provides diverse work which makes operator interested to perform. However this method will become too complicated if more than two operators are involved in the loop and it requires more skillful operators who are qualified to perform all the tasks. Also it does not work if certain work element or work station takes more than 40% of total work content.
return walking distance
1 2
Figure 4.5 The circuit9
4.3 Value Stream Mapping
4.3.1 Advantages of Value Stream Mapping
Value stream mapping is a lean manufacturing method that can be used to identify major non-value added sources and figure out improvement by drawing and analyzing current state material and information flows required to produce a product or delivery a service and coming up with future state value stream map in the end. This technique originated from Toyota. It has been widely applied in the areas of manufacturing, supply chain, logistics and product development etc. Any process that needs improvement can be analyzed with value stream mapping. According to Mike Rother and John Shook (1999) Value Stream Mapping is an essential lean tool.
Value stream mapping allows one to see waste, and plan to eliminate
8 Rather, M., & Harris, R. (2001). Creating Continous Flow (1.2 ed.) 9
It provides common language that facilitates the communication when people talk about the process issues.
It shows the linkage between material flow and information flow
It provides vision and plans that connect all lean techniques and improvement activities Value stream mapping enables one to describe in detail how to create a flow.
4.3.2 Steps of creating a value stream map.
The most commonly used approach to conduct a value stream mapping includes four steps, as shown in the picture below:
Select Product
Family Current State VSM Future State VSM
Action Plan and Implementation
Figure 4.6 Four steps of creating VSM
The first two steps are the same as those of creating continuous flow and therefore will not be mentioned again.
Create future state Value Stream Mapping
The aim of value stream mapping is to identify sources of wastes and eliminate them by implementing a future state value stream. The objective is to create continuous flow or pull system to link the individual processes to their customers. Make each process as close as possible to produce only what customers is willing to pay when they need it.
Develop an action plan and implement the changes
An action plan is developed basing on the future value stream map. The most important purpose of the plan is to review progress and address problems during implementation stage. It should include reasons for this improving action, current and objective conditions, time schedule and a place to write the quantitative targets and results. In the plan, goals are set up and must be measurable. It is suggested to compact the plan into only one sheet of paper. During the implementation, meetings should be scheduled to follow up the progress and ongoing communications should be continuously reinforced for all participants. Teams are formed according to the tasks for different improvements. Initially, teams need to be backed up by skilled staffs and necessary resources should be guaranteed to meet the goals.
4.4 Value adding and non-value adding operations
There are three types of operations according to Monden and Yasuhiro (1993) i.e. Non-value
adding, Value-adding and Necessary but non-value adding activities.
Non-value adding (NVA) activities refer to wastes such as unnecessary transport, waiting time,
Necessary but non-value adding (NNVA) activities do not add values to the end customers but
are needed in order to run the business. These activities are mandatory under current scenario or in line with legal and regulatory requirements or it would increase certain risks if eliminated from current circumstance. So it may require major changes to reduce these operations. For example extra operation for fire-class articles, quality or quantity control actions.
Value adding (VA) activities are what the customer is willing to pay. They increase the worth
of a product or service without wasting any resources.
4.5 Wastes from lean perspective
According to Jeffrey K. Liker (2004), there are eight types of non-value-added activities which are also called wastes, in business or production processes. The most focused behavior of Toyota production system is eliminating these wastes.
Overproduction
It refers to producing items without demand. Overproduction causes excess inventory which gives rise to other wastes such as overstaffing, storage and transport cost.
Waiting Time
Operators stand still and just watch for machine cycling without doing anything valuable, or stand around just waiting for next processing step, tools, supply, parts etc., or have nothing to do when stock out, processing delay, machines break down and capacity bottlenecks. However it is not a waste when machines sit idle waiting for operators as long as customer demand can be met.
Unnecessary transport or conveyance
It indicates the non-value-added activities e.g. carrying items through long distance, inefficient transport, moving materials between processes.
Over processing or incorrect processing
Processing unnecessary steps on parts, inefficient processes caused by poor tools and design, providing over high quality than necessary
Excess inventory
Excess raw materials, work in process, or finished articles lead to longer lead time, damage, delay and so on. Moreover, it conceals problems such as imbalanced production, delivery delay from suppliers, defects, long setup time and machine downtime.
Unnecessary movement
Any redundant motion that has negative effects on productivity during the course when operator performs their works, for example walking, looking for tools, reaching materials etc.
Defects
Producing defective product causes direct loss from scrap and also generates a lot of time and effort on inspection, correction, repair or rework.
4.6 Fish bone chart
Fish bone chart (also called cause and effect or Ishikawa diagram) is a causal diagram which identifies possible causes of certain even and groups the causes into major categories to find out these sources of variation.
The basic procedure of fish bone diagram is described as follows: 1. Discuss and identify the problem (effect)
2. Find out the main categories of the causes for the effect through brainstorm. The typical categories include: Methods, Machines (equipment), People (manpower), Materials, Measurement and Environment
3. Brainstorm all the possibilities of the causes of the effect and group them into the according categories.
4. Brainstorm and ask “why does it happen” about each causes identified in the previous step and write sub-causes branching off the causes.
5. Continue to ask “why” and identify deeper levels of causes. 6. Draw the chart according to causal relationships.
4.7 Time Study
Cycle time and takt time are widely used to measure work elements and important parameters for process analysis.
4.7.1 Cycle Time
Cycle time is how frequently a finished good comes out of the end of the work cell. It is an essential aspect of efficiency that defines the business output rate. Cycle time is used for flow analysis to determine statistics such as number of operators, machines or workstations required in order to configure certain work cell, output rate, operating time for machines and operators and so on. Cycle time is a key parameter when we design work cells, integrate and separate processes.
Cycle time calculation: cycle time consists of machine or operator uptime and idle time before the next cycle begins. There are two processing scenarios to consider about when calculating cycle time.
Sequential processing. If all tasks are executed on a single machine or workstation, the cycle time to finish the item is the sum of cycle time of all tasks.
Parallel processing. If each task is performed on a different machine or operator, the cycle time will be the longest cycle time among the tasks.
Here is an example to illustrate the calculation method.
Supposing it requires 5 processing tasks to product a part. And cycle time of each task as follows: Task 1: 20 seconds Task 2: 10 seconds Task 3: 15 seconds Task 4: 13 seconds Task 5: 8 seconds
Assuming the idle time is negligible, which is not often achievable in reality. Then if there is only one operator performing all the tasks, meaning sequential processing, the cycle time to produce one part is the sum of all tasks cycle time that is 66 seconds /part. On the other hand, if each of the tasks is assigned to one operator, meaning parallel processing, the cycle time to produce one part is equal to the longest cycle time of the tasks that is 20seconds/part from task 1.
Effective machine cycle time. Effective machine cycle time is the total time of machine cycle
time per piece, load and unload time and average changeover time per piece. In real world, because some activities such as loading or unloading machines, changeover are inevitable, effective machine cycle time is a more practical and therefore most commonly used parameter than pure machine cycle time for process development.
4.7.2 Takt Time
Takt time is the customer demand rate for the finished units. It is a reference number used to synchronize the pace of production with the pace of demand.
The formula is Takt time=available work time/customer demand.
For example, company A has 8 hours‟ work time during day time and the demand for its product X during that shift is 500units. Hence we can calculate the takt time of product X is 28800(8 hours)/500=57.6 seconds which means in order to meet customers demand, company A must produce one unit of product X every 57.6 seconds.
4.8 First in first out (FIFO) lanes
FIFO lanes are often conveyors or roller tables that holds a certain amount of inventory and
connect the upstream process with downstream process in the sequence of the first unit comes into a process is the first one gets worked on.
It is an approach to manage a pull production system between two processes with different cycle time. Once the part on the end-tip of lane is removed, the production of one more part is triggered on the other end of the lane. Thus FIFO lane can prevent production from being interrupted between the two processes until the lane is full also FIFO lanes limit work in process inventory and thus prevent overproduction.
When the downstream operation is running slower than upstream one, the calculation of the maximum length of lane needed in between the processes is formulated by
FIFO lane max = (Downstream CT – upstream CT) * Batch volume/Downstream CT
Figure 4.7 FIFO lane10
10 Lean Enterprise Institute, FIFO,
4.9 Computer Simulation
“A computer simulation is any computer-implemented method for exploring the properties of mathematical models where analytic methods are unavailable” Simulating dynamic models by computer programs can help us understand the system better than complex explication or complicated formula
Simulation can be classified into continuous and discrete simulations. In the continuous simulation, variables change in a continuous pattern with infinite number of states. While the state variables in discrete simulation change at a countable number of time points at which the events happen or change in state.
A guideline developed by Ulgen, Black, Johnsonbaugh, & Klungle suggests eight phases for a successful application of simulation methodology. They are:
1. Define the problem 2. Design the study
3. Design the conceptual model
4. Formulate inputs, assumptions, and process definition 5. Build, verify, and validate the simulation model
6. Experiment with the model and look for opportunities for design of experiments 7. Document and present the results
5 Current state
5.1 Current production state and strategy
5.1.1 Different operational function teams and flexible working schedule
There are totally 12 operational teams working in the whole DC, 2 teams for each of the following function groups: unloading group, loading group, transit group and shift group, 1 team for daytime group and 1 team for internal hauler group. There are 6 truck drivers and one crane driver in the internal hauler group. The other groups comprises of 15-20 co-workers who are very multi-skilled. They can manage all the functions within DC. The following table demonstrates the arrangement of groups working in Warehouse 2 and 4:
Morning Shift Evening Shift
Warehouse 2 2 rotation groups 1 rotation group
Warehouse 4 2 rotations+1 shift+1 daytime 1 rotation+1 shift
Table 5.1 Resource arrangement in Warehouse 2 and 4
Different groups have different working schedules from each other; what‟s more the same group has varied working schedules for different seasons. DC Älmhult divides the whole year into three seasons based on the amount of total goods flows. They are high, low and normal seasons. Take the year 2010 as an example, low season was the duration from week 10 to week 21, high season was among week 36 and week 47 and the remaining weeks were normal season.
5.1.2 Multi-flows within DC Älmhult
There is a variety of goods flows taking place in the whole DC such as DC flows, transit flows, cross-docking flows and internal flows.
DC flows are the normal flows that goods are transported from suppliers then stored within the warehouse‟s conventional racks or SILOs for couple of weeks until demanded by the stores. Then they will be dispatched to loading units and sent to the stores.
Transit flows are such flows that goods are transported from suppliers to the warehouse and temporary kept in the buffer area for certain time. They will never go into the storing system and normally dispatched within 24 hours since they arrive.
Cross docking happens when same kinds of articles are handled for both inbound and outbound. Under such circumstance, the articles can be transported directly form unloading gate area to loading gate area for dispatching without being sent to storing system and retrieved for dispatching later. The principle of cross docking is that: each time a co-worker scans a unit load (a pallet of articles) from the inbound gate, the IT system Astro will perform a check. It will check if the inbound assignment can be matched by an outbound assignment. If so, the system will change the inbound assignment to cross dock assignment. Then the co-worker will know that he can drive the unit load to outbound gate instead of putting it into racks or SILOs. Cross docking can improve the productivity quite a lot, as this way can reduce much more movement and transportation.
In DC Älmhult, there is a unique way of cross docking. They set aside specialized sub gate area for high frequent non-SILO articles. When unloading these articles, the co-worker transports