Master Thesis
International Marketing
“Thai Consumer‟s Segmentation for Ready-to-eat Meals in Thailand”
Supervisor: Jean-Charles Languilaire
Examiner: Ole Liljefors
Final seminar: May 30th, 2011
Authors (2672) Kritsada Pornrattanapitak (861114)
i
Abstract
Date: May 27th, 2011
Course name: Master Thesis (EFO705)
Title: Thai Consumer‟s Segmentation for Ready-to-eat Meals in Thailand Authors: Kritsada Pornrattanapitak (861114)
Sudapich Thiemphasuk (871009)
Group number: 2672
Supervisor: Jean-Charles Languilaire
Problem: Ready-to-eat meals are particularly popular in Thailand and have numerous consumers. The marketers should strongly understand their products and their consumers (Brooks, 2008) and select their market segments before be able to satisfy their consumers (McDonald & Dunbar,
1995).
Purpose: The purpose of this research is to explore the segments of the Thai consumers based on Thai consumers‟ attitude toward Thai ready-to-eat meals in Thailand.
Method: Quantitative research method via survey was used for this research. Authors form a questionnaire to explore the segments of the Thai consumers based on Thai consumers‟ attitude toward Thai ready-to-eat meals in Thailand. The independence variables in this paper are psychographic, behavioral, demographic, geographic and consumer‟s attitude about Ready-to-eat meals‟ quality. Consumer‟s attitude toward Ready-to-eat meals is a dependence variable in this study.
This paper contains both primary and secondary data in order to increase the reliability.
Conclusion: Behavioral segmentation can be done based on 4 factors which are consuming frequency, key factor, purchasing place and purchasing price. Demographic segmentation can be done based on age.
ii
Acknowledgement
To what the authors have achieved during the time of doing this thesis paper, we have experienced difficulties and troubles. Therefore, this is a great opportunity to express the respect to who did help us to pass through that time. First of all, the authors would like to appreciate the thesis superviser, Jean-Charles Languilaire; who provided a lot of his gratitude and support for our group throughout the semester. His suggestion also largely helped improved our work. The authors also would like to thank, Tobias Eltebrandt; who provided us knowledges in International Marketing which we applied what he taught to our work. Moreover, we would like to thank respondents who devoted their time in answering the questionnaire during the survey which brought about great results. As well as, other thesis groups who patiently reviewed the work and gave all important recommendations. Last but not least, the authors also would like to thank our beloved families who have been generously encouraged us. These people we mentioned have provided us with necessary assistance, they also helped support and inspire us a lot. Without them it would be difficult to possibly yield the success.
iii
Table of Contents
1. Introduction ... 1 1.1 Background ... 1 1.2 Problem Discussion ... 2 1.3 Purpose ... 3 1.4 Methodology ... 3 1.5 Limitation ... 4 1.6 Target audiences ... 4 1.7 Structure ... 5 2. Theoretical framework ... 6 2.1 Market Segmentation ... 6 2.1.1 Geographic Segmentation ... 7 2.1.2 Demographic Segmentation ... 7 2.1.3 Psychographic Segmentation ... 8 2.1.4 Behavioral Segmentation ... 8 2.2 Attitudes ... 92.2.1 The Cognitive Component ... 10
2.2.2 The Conative Component ... 10
2.2.3 The Affective Component ... 10
2.3 Conceptual framework ... 11
3. Methods... 13
3.1 Collection of Data ... 13
3.1.1 Secondary Data Collection... 13
3.1.2 Primary Data Collection ... 14
iv
3.3 Reliability and Validity ... 20
3.3.1 Reliability ... 20
3.3.2 Validity ... 21
3.4 Ethical considerations ... 22
4. Empirical Findings ... 23
4.1 Psychographic findings ... 23
4.2 Purchasing, and Consuming behavior findings ... 24
4.3 Demographic and Geographic findings ... 27
4.4 Attitude findings ... 29
5. Data analysis ... 32
5.1 Psychographic Data Analysis... 32
5.2 Purchasing and Consuming Behavioral Data Analysis ... 33
5.3 Demographic and Geographic Data Analysis ... 35
5.4 Attitude Data Analysis ... 37
6. Conclusions and Recommendations ... 41
6.1 Affective Attitude ... 41 6.2 Cognitive Attitude ... 43 6.3 Conative Attitude ... 43 6.4 Recommendations ... 43 6.5 Further Study ... 43 Bibliography ... 44 Appendix A ... 47 Appendix B ... 53
v
List of Figure
Figure 1.1: Percentage of consuming Ready to eat meals ... 2
Figure 2.1 Major Segmentation Variables ... 7
Figure 2.2: The Tricomponent Attitude Model ... 9
Figure 2.3 Conceptual framework ... 11
Figure 3.1: Sample ... 15
Figure 4.1: Hobby ... 23
Figure 4.2: Eating place ... 24
Figure 4.3 Consuming frequency ... 24
Figure 4.4 Meal ... 25
Figure 4.5 Key factor ... 25
Figure 4.6 Quantity per purchase ... 26
Figure 4.7 Place of distribution ... 26
Figure 4.9 Affective Attitude ... 29
Figure 4.10: Consumers‟ attitude on ready-to-eat meals‟ quality (Cognitive attitude)... 30
vi
List of Table
Table 1: Structure ... 5
Table 3.1: Estimating margin of error on sample survey results. ... 16
Table 3.2: Reliability result from SPSS. ... 21
Table 4.1 sex, age, household member, occupation, level of monthly income and resident location of respondents. (own illustration) ... 27
Table 5.1: The Chi-square Test between Psychographic Data and Thai consumers‟ attitude ... 32
Table 5.2: The T-Test between Consuming Experience and Thai consumers‟ attitude... 33
Table 5.3: The Chi-square Test between Behavioral Data and Thai consumers‟ attitude ... 34
Table 5.4: The T-Test between Sex and Thai consumers‟ attitude ... 35
Table 5.5: The Chi-square Test between Demographic and Geographic Data and Thai consumers‟ attitude... 36
Table 5.6: The Coefficient of Determination, ANOVA Test and Multiple Linear Regressions Coeffifients for attitude about quality ... 37
Table 5.7: The Coefficient of Determination, ANOVA Test and Multiple Linear Regressions Coeffifients for attitude about factors that required development ... 39
1
1. Introduction
The introduction part is the first chapter that the authors present the background, the overview and the information of ready-to-eat meals. The authors also discuss the problem and state the purpose of this research. Furthermore, the authors mention about the targeted audience, the structure and the overall methodology of the paper.
1.1 Background
There is a demand for convenience in meal preparation. It is because the tendency of the world moves toward a faster lifestyle (Costa, Schoolmeester, Dekker, & Jongen, 2007). Consumers work longer hours, and try to increase their limited leisure time. They also require products and services that ease and support their hectic lives (Datamonitor, 2007). As a reaction to this demand, the food industry has increased the complete prepared ready meal solutions (Geeroms, Verbeke, & Kenhove, 2008).
Ready-to-Eat meals or Meal, Ready-to-Eat (MRE) was primary adopted for military combat of United State since the World War I. The first soldier ration consisted of beef, pea and rice and has been developed later to contain dried meat, bread, coffee, sugar and salt. At the beginning, MRE was produced in order to reduce cost and lighten weight of the meal but later on, it also provides extended storage and easy, safe meal preparation. (Feagans, Jahann & Barkin, 2010)
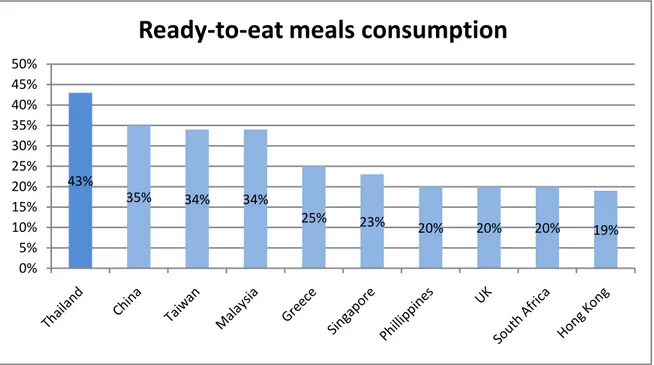
According to ACNielsen Consumer Survey (2006), people tend to consume more ready-to-eat food as the result of having not enough time, information, energy, space and money. In Thailand, from the figure 1 below, Thai consumers are the leader of consuming Ready-to-eat (RTE) meals with 43 percent frequently purchase ready-to-eat meals rather than traditional meals, and with 75 percent leading the world, claiming that they have no time to prepare proper meals, according to ACNielsen.
2 43% 35% 34% 34% 25% 23% 20% 20% 20% 19% 0% 5% 10% 15% 20% 25% 30% 35% 40% 45% 50%
Ready-to-eat meals consumption
Figure 1.1: Percentage of consuming Ready to eat meals Source: Own illustration adapted from ACNielsen, (2006)
According to the popularity of consuming Thai foods, the sales of ready-to-eat meals in Thailand grew by 54 % during the period 2001 to 2006 (Konuma, 2010). Moreover, Thai people most often purchase ready-to-eat meals in Asia (ACNielsen, 2006).
1.2 Problem Discussion
Ready-to-eat meals are particularly popular in Thailand thus there are various alternatives for the consumers. The consumers are tending more and more to purchase goods which could bring their satisfaction (Christopher, 1989). The marketers should strongly understand their products and their consumers (Brooks, 2008) and select their market segments before being able to satisfy their consumers who have various needs (McDonald & Dunbar, 1995). According to Wendell (1956), “segmentation is based upon developments on the demand side of the market and represents a rational and more precise adjustment of product and marketing effort to consumer or user requirements”. There are many kinds of segmentation which the markets can be profitably segmented. For example, geographic segmentation; concerning certain areas to limit the investments or for whose distribution channels. Another example is demographic segmentation;
3
targets might be younger people, men or families with children or other demographic variables such as age, sex, income, occupation (Ronald, 1967). Segmenting a market is the result from many variables; consumer‟s wants, locations, buying attitude and buying practice (Kotler, Armstrong, Saunders & Wong, 1996) and attitude is one of the most important reasons for consumer segmentation (Kardes, 1999). Consumers‟ attitude can be measured simply and directly by asking consumers to indicate their feelings toward the product (Peter et al., 1999).
Consequently, to satisfy Ready-to-eat meals‟ consumer, there is one major problem for this research; which segments of Thai consumers affect Thai consumers’ attitude on Thai ready-to-eat meals?
1.3 Purpose
The purpose of this thesis is to explore the significant segments of the Thai consumers based on Thai consumers‟ attitude toward Thai ready-to-eat meals in Thailand.
1.4 Methodology
Methodology is to know if and why researchers adopt qualitative or quantitative approach.
A qualitative method, it is about the interested investigation in distilling meaning and understanding phenomenon. A qualitative research method is a method associating with “face-to-face” contact with people and with verbal data and observations (Eldabi, Irani, Paul & Love, 2002). Qualitative research is not only concerned with the measurement and quantification of the phenomenon but also acquiring an understanding the natural setting of the phenomenon through observation (Weick, 1984; Irani et al., 1999).
On the other hand, the quantitative research method can lead the authors to the result by focusing on statistical approaches (Strauss, 1990). The quantitative research method also show the objective of measurements and numerical analysis of data collected from polls, questionnaires or surveys (Veneeva, 2006). Moreover, this method brings the authors the results in collection of numbers and the conclusion that has least bias and error (Matveev, 2002). Based on our purpose that is to explore the segments of the Thai consumers based on Thai consumers‟ attitude toward Thai ready-to-eat meal in Thailand, we chose quantitative research method.
4
The reason why the authors choose quantitative research method is; we want to have numerical data which have validity and reliability, we could not get this data from qualitative method.
1.5 Limitation
According to the purpose of this research, the authors have to specify some limitations. This research is about Thai consumer segmentation of Thai Ready-to-eat meals in Thailand. Therefore, the results of this research might not be applied for different business and also different nation. Moreover, the consumer behavior can change overtime as well as the consumer segmentation so the segmentation in this research cannot be used to predict consumer‟s future purchasing.
1.6 Target audiences
The consequence of this research could benefit both marketers and consumers who are interested in understanding the Thai consumers‟ segmentation and attitude towards Thai ready-to-eat meals.
5
1.7 Structure
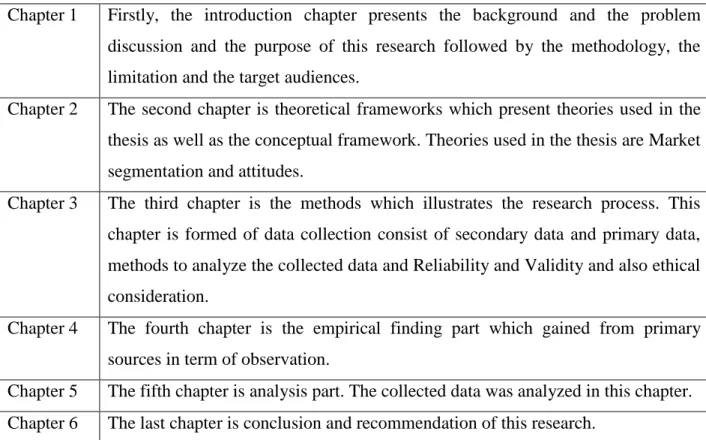
For the audiences to be easier to understand, the structure of this thesis is divided into 7 chapters.
Table 1: Structure
Chapter 1 Firstly, the introduction chapter presents the background and the problem discussion and the purpose of this research followed by the methodology, the limitation and the target audiences.
Chapter 2 The second chapter is theoretical frameworks which present theories used in the thesis as well as the conceptual framework. Theories used in the thesis are Market segmentation and attitudes.
Chapter 3 The third chapter is the methods which illustrates the research process. This chapter is formed of data collection consist of secondary data and primary data, methods to analyze the collected data and Reliability and Validity and also ethical consideration.
Chapter 4 The fourth chapter is the empirical finding part which gained from primary sources in term of observation.
Chapter 5 The fifth chapter is analysis part. The collected data was analyzed in this chapter. Chapter 6 The last chapter is conclusion and recommendation of this research.
6
2. Theoretical framework
In this theoretical framework part, the authors illustrated conceptual framework used in this research. Finally, market segmentation and attitude which were used for designing questionnaire are also described.
2.1 Market Segmentation
There are many types of customers, products and needs. Therefore, the marketer has to determine which segments offer them the best opportunity (Kotler et al., 1996). By mean of market segmentation, marketers can market their chosen segments with a better understanding of customers‟ needs (McDonald & Dunbar, 1995).
The customers may diverge in their locations, backgrounds, lifestyle, and buying experiences. Companies can divide a market into smaller groups that can be grasped more effectively with products that match their unique needs toward market segmentation. (Armstrong & Kotler, 2009)
Peter, Olson and Grunert (1999) mention that marketers should consider what types of consumers are likely to purchase and use the product and how they differ from those less likely to buy.
Wedel and Kamakura (2000) also state that market segmentation is an essential element used to partition the market, resulting in the identification of groups of consumers that respond similarly but each group provides different outcomes.
According to Aker (1992), segmentation is the key to develop a sustainable competitive advantage based on differentiation. In a strategic context, segmentation is the identification of customer groups that respond similarly in each group but differently from other groups of customer to competitive strategies.
The market segmentation could categorize into four major variables as shown in figure 2.1 and these elements are dependent variables in this research.
7
Figure 2.1 Major Segmentation Variables
Source: Own illustration adapted from Armstrong & Kotler (2009)
2.1.1 Geographic Segmentation
Geographic segmentation is needed when marketers want to divide the market into different geographical divisions such as nations, regions, cities or even neighborhoods (Armstrong & Kotler, 2009). Geographic approach can provide the assessment of market potential for the products (Baker, 1995). Classifying consumers into geographic segments can also enhance accessibility of segments (Wedel & Kamakura, 2000).
2.1.2 Demographic Segmentation
Demographic segmentation is the most popular bases for segmenting customer groups (Armstrong & Kotler, 2009). The information is easily interpreted, relatively easily gathered and easily transferable from one study to another (Beane & Ennis, 1987). Common demographic variables are age, gender, family status, level of income, occupation, background education and also religion (Armstrong & Kotler, 2009).
Age: Consumer needs and wants change with age (Armstrong & Kotler, 2009). Most people perceive themselves being younger than their actual age (Evans, et al., 2006).
Gender: Gender segmentation divides a market in to different groups (Armstrong & Kotler, 2009). Geographic City Urban/Rural Demographic Age Gender Income Occupation Psychographic Lifestyle Interest Behavioral Consuming frequency Occasion Benefits Consuming quantity Purchasing place Purchasing price
8 Income: Level of income affects personal purchasing power (Evans, et al., 2006). Income segmentation divides customers into low income group, middle income group and high income group (Armstrong & Kotler, 2009).
2.1.3 Psychographic Segmentation
Psychographic segmentation divides customers into different groups based on social class, lifestyle or personality characteristics (Armstrong & Kotler, 2009). Psychographic perspective can sometimes be affected by demographic variable, for example, social class can be affected by level of income.
Lifestyle: is represented by a consumer‟s activities, interests and opinions (Hoyer & Maclnnis, 2001).
2.1.4 Behavioral Segmentation
Behavioral Segmentation divides customers into groups based on their knowledge, attitudes, uses or responses to a product. Many marketers believe that purchasing and consuming behavior variables are the best starting point for building market segments. (Armstrong & Kotler, 2009)
Occasion: Occasion is the time when customers get the idea to buy, actually make their purchase or use the purchased item (Armstrong & Kotler, 2009). Time of usage also differs for different type of consumers (Schiffman & Kanuk, 2000).
Benefits: Customers seek for the benefits of the product differently (Armstrong & Kotler, 2009). Benefit is the key factor for consumer to consume the product.
User rate: Markets can be segmented into light, medium and heavy product users according to their percentage of total consumption (Armstrong & Kotler, 2009). To measure the user rate, we can survey Consuming frequency and Consuming quantity. Moreover, Purchasing place and Purchasing price could also influence purchasing and consuming behavior.
9
2.2 Attitudes
Consumers have large number of attitudes toward products. Attitudes relevant to purchase behavior are formed as a result of direct experience with the product, word-of-mouth information acquired from others, or exposure to mass-media advertising, the internet, and various forms of direct marketing. (Schiffman & Kanuk, 2000) Attitude is defined as a psychological tendency that is expressed by evaluating a particular thing with some degree of liking-disliking, satisfaction-dissatisfaction or good-bad duality (Eagly & Chaiken, 1993).
In case that the product is food, the appearance which contains several basic sensory attributes such as color, visual texture and perceived flavor or taste would take an important role to dominate consumer‟s satisfaction. (Imram, 1999)
According to Kotler (2003), either beliefs or attitudes are important for consumer‟s behavior. An attitude is a person‟s enduring favorable or unfavorable evaluations, emotional feelings, and action tendencies toward some object or idea. Religion, politics, clothes, music, and food are the example of what people have attitudes towards. People will go for the object or else they will move away from. People‟s attitudes are difficult to change, but attitudes may be changed by requiring major adjustments in other attitudes.
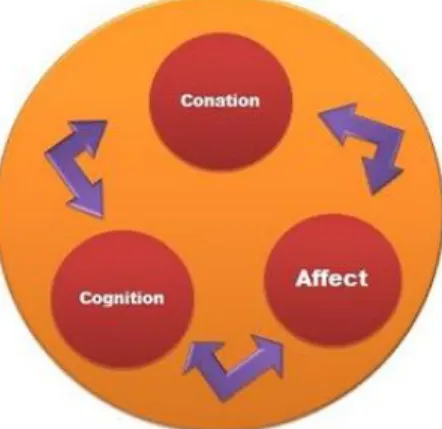
To better explain or predict behavior, the composition of an attitude is specified as a Tricomponent attitude model (Schiffman & Kanuk, 2000). This Tricomponent attitude model consists of three components, a cognitive component, an affective component, and a conative component as shown in figure 2.2.
Figure 2.2: The Tricomponent Attitude Model
10
2.2.1 The Cognitive Component
Cognitive attitudes relate to beliefs or disbeliefs. For example, “I believe that margarine is healthier than butter”. (Brassington & Pettitt, 2005, p.81) The person‟s cognitions, knowledge and perceptions that are acquired by a combination of direct experience with the attitude object and related information from various sources. This knowledge and perceptions lead to beliefs, that consumer believes that the attitude object possesses various attributes and specific behavior will lead to specific outcomes. (Schiffman & Kanuk, 2000)
2.2.2 The Conative Component
Brassington and Pettitt (2005) explain that conative attitudes relate to the link with behavior, attitude X is considered likely to lead to behavior Y. It is hard for marketers to predict or control because many things can prevent behavior from taking place, even if the cognitive and affective attitudes are positive. For example, “I believe that BMWs are excellent quality, reliable cars, and I feel that owning one would enhance my status and provide me with many hours of pleasurable driving, but I simply cannot afford it,” or it may even be that “Audi made me a better offer”. Schiffman and Kanuk (2000) state that conation is concerned with the likelihood or tendency that an individual will undertake a specific action or behave in a particular way with regard to the attitude object, the conative component may include the actual behavior itself. Moreover, the conative component is frequently treated as an expression of the consumer‟s intention to buy. For example, using intention-to-buy scales, “I will buy it”. Consumers who are asked to respond the question appear to be more likely to make a product purchase and will buy more if some properties improved.
2.2.3 The Affective Component
According to Brassington and Pettitt (2005) affective attitudes relate to feelings of a positive or negative nature, involving some emotional content, for example, “I like this product” or “This product makes me feel…”. Affective attitudes can overcome cognitive attitudes. For example, I may believe that margarine is healthier than butter, but I buy butter because I like the taste better. Schiffman and Kanuk (2000) state that emotions and feelings from customers about a particular product or brand, constitute the affective component of an attitude. These emotions and feelings are frequently treated by consumer researchers as primarily evaluative in nature. For example, customers might rate the object as “favorable” or “unfavorable” and “good” or “bad”. Emotions
11
that used to rate the object might be happiness, sadness, shame, disgust, anger, distress, guilt or surprise. These emotional states may enhance or amplify positive or negative experiences and that later recollections of such experiences may impact what comes to mind and how the individual acts. Affective attitude can be measured simply and directly by asking consumers to indicate their attitudes toward the product (Peter et al., 1999). Moreover, the marketing literature often uses satisfaction as a global evaluation of attitudes toward products or services (e.g. Lam et al., 2004). So the researchers used the affect attitude as independent variable for this research.
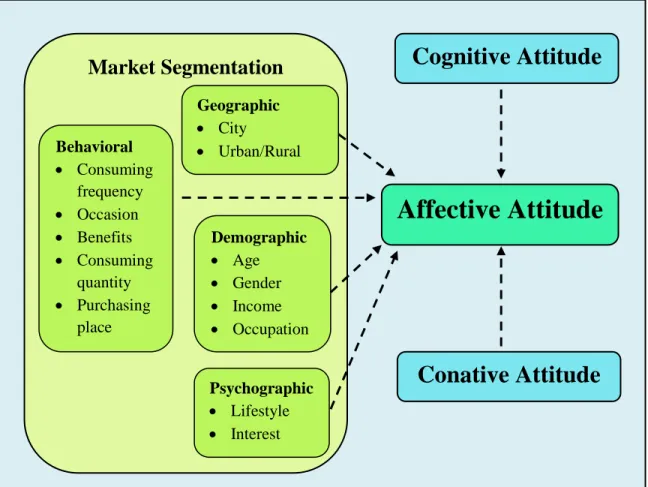
2.3 Conceptual framework
The conceptual framework illustrates analytical steps as shown in figure 2.3 conceptual framework model.
Figure 2.3 Conceptual framework
Source: Own illustration
Affective Attitude
Market Segmentation
Cognitive Attitude
Conative Attitude
Geographic City Urban/Rural Demographic Age Gender Income Occupation Psychographic Lifestyle Interest Behavioral Consuming frequency Occasion Benefits Consuming quantity Purchasing place Purchasing price12
First of all, there are 4 major dimensions of market segmentation; Geographic segmentation, Demographic segmentation, Psychographic segmentation and Behavioral segmentation and each major dimension contains several independent variables as shown in the figure 2.3. Another 2 independent variable are Cognitive attitude and Conative attitude. The dependent variable for this research is Affective attitude which may be affected each variable of Geographic, Demographic, Psychographic, Behavioral, Cognitive attitude and Conative attitude. At last, the authors would conclude whether each independent variable affects consumers‟ affective attitude on Ready-to-eat meals or not.
13
3. Methods
After studying theories, the authors applied the theories to direct the way we do the research. This chapter presents how we collected the data. Moreover, the research method and the way the research was analyzed are shown. Reliability and Validity, and Ethical considerations are also mentioned in this chapter.
3.1 Collection of Data
To accomplish the research, the authors needed to obtain information. There are two sources of data, primary and secondary sources of data. The details about data collection are described in the next two parts.
3.1.1 Secondary Data Collection
Secondary data is data that has been collected by individuals or agencies; for example, the government department or organizations (FAO, 1997). The advantages of secondary data are; considering limitation of time; secondary data can be collected within short period of time and also provide more information (Steppingstones, 2004). Secondary data shows original sources which explain how the data is collected; this increases more reliability (RAO, 2008). The use of secondary data can help the researcher to clarify the research question and is often used prior to primary research to help clarify the research focus (Prescott, 2008).
Therefore, it is important to start with finding the secondary data in the beginning of the research. Literatures used by the authors are segmentation, consumer attitude and ready-to-eat meals. They were used in the previous background, problem discussion and theoretical part.
The authors obtained the information about Ready-to-eat meals and food business from secondary sources by searching and browsing through Malardalen library database, websites and books, for example, books in the library, electronic-journals and articles from Malardalen University. Main sources of the secondary data were Business Insights database, Emerald and ELIN@Mälardalen. Apart from the sources above, the authors also searched more data from other internet resources. The information provided a clearer view of Thai ready-to-eat meals and Thai consumers. And keywords are „Food product‟, „Consumer attitudes‟, „Segmentation‟ and „Ready-to-eat meals‟.
14
3.1.2 Primary Data Collection Primary Data
Primary data is data that researchers observed or collected by using methods such as direct observation, surveys, interviews or logs (Kelly, 2005). Facts and information can be found from specifically collecting of primary data (Rabianski & Joseph, 2003). The advantage of primary data is that the primary data help find out about people attitudes, intention and buying behavior for a particular product (Ghauri & Gronhaug, 2010) Therefore, questionnaire was selected to be the data collection tool in this research.
Survey Method
In order to answer the purpose of the research, consumer‟s attitude of Thai people toward Thai ready-to-eat meals in Thai market will be investigated. Therefore, the information and answers from the consumers are very important for our research.
Sample size
The quantitative method in form of survey structured questionnaire was conducted with 384 respondents as shown in the table 3.1 from the Margin of Error table (Fisher, 2004 p.160) that calculates the proper size of samples by using the rule of margin error, showing that the 5 percent Error of 10,000,000 populations or over is 384 and according to CIA, The World Factbook (2011) the number of Thai population are 66,720,153. In this research, the target population of the survey is consumers who live in Thailand and have possibility to buy ready-to-eat foods. As a result, 5 percent error is minimally acceptable to be justified result for this thesis. The authors spread out 600 online questionnaires to our contacts and their relatives who are illustrated in figure 3.1 on 19th April, 2011 and expect 400 in return because the number of questionnaire that will be sent out should be larger than the expected number, in the case of general questionnaire, a return rate of 70 percent would be acceptable (Fisher, 2004 p.159).
15 Student 200 33% Business owner 100 17% Employee 200 33% Others 100 17% Figure 3.1: Sample
Source: Own illustrate
We had taken around 2 weeks for collecting responses. Finally, after spreading 600 online questionnaires, we got 389 responses in return. The number of responses was acceptable under 5% margin of error for population in range of 10 million as shown in the table 3.1. We can describe the sample as follow: There were both men and women within six categories of ages; less than 20 years old, 20-29 years old, 30-39 years old, 40-49 years old and more than 59 years old. And they were employees, students, business owners and others.
16
Table 3.1: Estimating margin of error on sample survey results.
Source: Fisher (2004)
Sampling Frame
According to Proctor (1997, p.74), a sampling frame is a list that identifies the target population. It can be a list of names and address of all the people in the appropriate population. It is impossible for the authors to collect this information because of time limitation, nevertheless. Regarding Ghauri & Gronhaug (2010), there are two types of the sampling method. These two sampling methods are probability and non-probability samples. Consequently, the authors chose non-probability approach with convenience sampling to hand out the questionnaires the reasons relying on this method are it is easy to select the subjects for the study and the entire population is too large to collect the data (Castillo, 2009). From the large scale of population size which is more than one million people, Proctor (1997, p.80-81) suggested that it is possible to use convenience sampling to distribute the questionnaire. It is similar to an interviewer questioning people as they meet them on the street or in shopping areas but for this research mostly the
17
authors spread out questionnaires online by using list of friends in electronic mail and facebook, as well. And the sample respondents provide useful information to the researcher as long as the sample seems to be reasonably representative of the population (Procter, 1997).
Question formats of questionnaire
For this research, different types of questions were used to ask respondents. According to Fisher (2010), the question should be set up as short as possible and look attractive to the respondent. Two - four sides of A4 paper would be for a Master thesis. And the questionnaire had to be divided into parts that correspond to the various issue topics. Moreover, the questionnaire should start with easy question first later the hard one. This is the way to increase the reliability of a questionnaire; the questionnaires should contain the consistency of wording, meaning that the same word should have the same meaning throughout the questionnaire. Technical terms should be defined and described thoroughly. The authors chose close-end question for this research because closed-end questions are much easier to interpret since they are standardized and therefore can be analyzed statistically. Close-end question is easier for the respondents to fill in and it is more likely that the respondents will agree to answers (Fisher, 2010). Moreover, multiple choices questions and checklists would be used for asking about the consumer‟s information and general behavior. Moreover, likert scales or rating scales are used to ask people about their opinions and attitudes. Also, the authors used literature review to support our research and used the theory in the theoretical framework to create survey questionnaire.
The authors separated the questionnaire into 4 parts which is shown in Appendix A.
Part1: Psychographic – This section is only a short part to ask the customers about their lifestyle, social class and personality. This part contains of simple questions which are all multiple choices questions. For example, (“Where do you usually have your meal?”) Answers are choices of selection; at the restaurant, food center, kiosk or at home. The results of these questions will lead to some opinion about consuming foods in their living lives.
Part2: Purchasing, and Consuming behavior – The aim of this section is to receive the behavior of purchasing and consuming ready-to-eat meals from Thai consumers. This part is asking consumers deeper about their specific behaviors by using multiple choices questions.
18
Example is (“How often do you eat Ready-to-eat meals?”). The answer choices are; almost every day, few times per week, few times per month, once a month or less than once a month. The results of this section can lead to specific behavior of customers in market segmentation.
Part3: Attitude towards product – This section receives the information in the consumer‟s mind. The authors would like to know what the consumers are looking for in the ready-to-eat meals in Thai market. Furthermore, the authors also would like to know who is interested to try or buy the ready-to-eat processed meals. There are three questions asked about affective attitudes, cognitive attitudes and conative attitudes. First of all, the question number 10 asks about the degree of satisfaction in Ready-to-eat meals which refers the affective attitude. Secondly, question number 11 asks about attitude towards quality of Ready-to-eat meals which refers to cognitive attitude. And finally, the question number 12 asks about the opinion of consumers in what aspects ready-to-eat meals have to be improved? The respondents can answer YES or NO for price, taste, and package, place of distribution or advertising, this question measures the conative attitude as shown in part 3 of appendix A: Questionnaire.
Part4: Demographics and Geographic – This section asked the customers about age, gender, number of people in household, occupation and also income for segmenting the target group in Thai market. The authors divided age ranges from less than 20 years old, 20-29 years old, 30-39 years old, 40-49 years old, 50-59 years old and more than 59 years old. For the number of people in household, the authors categorized into 4 categories; Living alone, Living with children, Living with partner or family with children and Living with partner or family without children. Also about occupation there are choices of students, public employee, private employee and own business. For the income there are many levels of income such as; Under 10,000 THB, 10,000-15,000 THB, 10,000-15,000-20,000THB, 20,000-30,000THB and Over 30,000 THB. The last one is the location of residence, which are central Bangkok, boundary areas of Bangkok and other provinces. It is beneficial for the authors when the authors give the recommendation to this business sector because different group have different market segmentation to stimulate the consumers. This section should be the last part as Fisher (2010) states to keep personal questions until last.
19
3.2 Method to Analyze Data
After spreading questionnaires, the results from respondents were summarized in form of table of raw data by the website automatically. This way of doing online questionnaire can create unbiased, accurate and fast responses. For better analyzing, the authors use the computer program known as Statistical Package for Social Sciences (SPSS) which has been widely used for statistical analysis. Each question and answer choice will be coded in different letter and number which represent a meaning. We separated the findings into four sections which are psychographic data, behavioral data, attitude data and demographic and geographic data as the sections in theories and designed questionnaire.
According to Fisher (2010), the hypothetical is heart of realist research. Statistical hypothesis tests can help the interpretation with the correct solution.
Hypothesis can determine the segmentation based on consumers‟ attitude by using finding data from questionnaire. SPSS can help in this process since we tested our hypothesis by using statistic functions as following:
Chi-square Test: is used to determine whether there is a significant difference between the
expected and observed data result (Sharp, 1979). We used chi-square test with multiple choices questions to find out the relationship between consumers‟ affective attitude and the general data such as hobby, consuming frequency, age and so on.
T-Test: is used to examine two variables whether they are related to each other or not (Lowry,
2010). We used t-test to check the relationship between consumers‟ attitude and data that can be separated into two groups of answers which are consuming experience (yes/no) and sex (male/female).
Analysis of Variance Test (ANOVA) and Multiple Regression: are used to test the difference
between numeric scale data (Statsoft, 2010). We used ANOVA and multiple regression to test between attitudes.
We found out the relationship by focusing at p-value (sig.) that we gained from testing by spss. If p-value (sig.) is less than 0.05 (5% level of acceptance), that particular test can be concluded that there is a relationship between independent variables, which are psychographic variables,
20
behavioral variables, demographic variables, geographic variable and consumer‟s cognitive attitudes about Ready-to-eat meals‟ quality, and dependent variable is consumer‟s attitude toward Ready-to-eat meals.
3.3 Reliability and Validity
Reliability and validity have to be considered for the qualified research.
3.3.1 Reliability
According to (Carmines and Zeller, 1979) reliability is when concerning the degree to which results are consistent across repeated measurements. Reliability is basically an empirical issue, focusing on the performance of empirical measures or on repeated examinations and reliability comes with minimum measurement error. In the research, fundamentally, for reliability the authors concerned with the same results or repeated trials. However there are two factors when considering the reliability of the measure (Bryman & Bell, 2003; Hardy, & Bryman, 2009).
3.3.1.1 External reliability
Concerning the consistency of a variable, this is reliability. If a variable is externally reliable, it does not change overtime or it is stable (Br ym an & Bell , 2003). The examination to estimate the external reliability is to test for test-retest reliability. Test-retest is a conservative method to estimate reliability and sometime after administering the scale, we re-administer it and examine the degree to which respondents‟ replies are the same for the two sets of data. There is one difficulty with this method which there is no guideline about the passage of time that should elapse between the two waves of administration. Test-retest reliability may easily be reflecting change owing to intervening events or respondents‟ maturation if the passage of time is too great (Hardy & Bryman, 2009). Therefore, considering this difficulty, it is better not to use this test-retest reliability in this research.
3.3.1.2 Internal reliability
Internal reliability is an issue arises with a connection of multiple-indicator variables. All the constituent indicators are measuring the same thing if a variable is internally reliable (Hardy & Bryman, 2009). There are several methods for assessing internal reliability but the most common method of estimating internal reliability is Cronbach‟s alpha, which is almost equivalent to the average of all possible split-half reliability coefficients for a scale.
21
To test internal reliability, in this research the authors use Cronbach‟s alpha in questionnaire number 11. The question provides the likert scale based on five point scale, ranged from 1(worst) to 5(best). The researchers test internal reliability of the first 30 responses. In case that the questionnaire did not have internal reliability or got Cronbach's Alpha lower than 0.8, we could modify it before continue collecting data. The result of Cronbach‟s alpha by SPSS is presented in the table 3.2 below.
Table 3.2: Reliability result from SPSS.
Reliability Statistics Cronbach's Alpha N of Items .8035 4
Source: Own illustration
From table 3.2, N of items = 4 are questions about cognitive attitudes toward product quality such as convenience to prepare, nutrition, suitable price, and good taste. The Cronbach‟s alpha = 0.8035 that means questions are acceptable level of internal reliability.
3.3.2 Validity
Validity is more of theoretical issue, leading to the question of “valid for what purpose?” And it is directly related to the purpose. If it is reliable and valid, then it is more possible to gain scientific acceptance. For validity, as stated by Nunnally (1978), the crucial relationship between concept and indicator are concerned by validity. Moreover, Bryman & Bell (2003) also stated that validity is the indicator designed to gauge or measure the concept. And there are two types of validity considered in this research.
3.3.2.1 External validity
External validity represents the extent to which the question of whether the results of a study can be generalized beyond the specific research context (Bryman & Bell, 2003). This means that it is possible to use the same research method not only in Bangkok but also in other provinces or parts of Thailand. The process of generalization is the main criteria of external validity, also the results gained from a small sample group can be extended to predict the entire population (Shuttleworth, 2009). Sampling model is one major approach providing evidence for generalization. In the sampling model, it has to start by identifying the population that need to be generalized, then draw a sample from population and conduct the research by the sample later on (Trochim, 2006). According to Marion (2004), a study that has a large, randomly selected sample or a carefully matched sample is said to have external validity. To make this research having an
22
external validity, the largest sample size the authors can use is 384 (Fisher, 2010, p. 207) and we selected samples from contacts and relatives in Facebook and electronic mail.
3.3.2.2 Internal validity
Internal validity relates to variables in a study. Internal validity encounters with the question of whether a conclusion consolidates a causal relationship impacted as the independent variable and the effect as the dependent variable (Bryman, & Bell, 2003). In order to get the internal validity the authors have two methods, making the right introductions for the questionnaire and accessing the right target respondents. For the right introductions the questionnaires we spread to the respondents are translated from English to Thai to prevent the error or misunderstanding. Secondly for the right target respondents, we provide the title and the meaning of Ready-to-eat meals to ensure the respondents in what aspect we want to gain the answers. From the right introduction and the right target respondents, this helps us to summarize and analyze in a proper way without misunderstanding and with less errors in this research.
3.4 Ethical considerations
Considering ethics, there are five key phrases to protect the rights of the research participants (Trochim, 2006). In our survey process, the authors seek for voluntary participation from our participants which they were not forced to do the questionnaire. Informed consent is a requirement; they are all fully informed all about the procedures including the purpose, the reasons and the intention of the study. The authors also put away physical and psychological risk of harm for all participants. Moreover, all participants are informed that their answers are kept anonymous and confidential to anyone who is not involved in the study. Finally, the authors must have right to service, requiring the use of no-treatment control group.
23
4. Empirical Findings
After we used the sampling method by gathering surveys from Thai consumers, and the results would be presented in this chapter. Our samples are in Bangkok and its boundary areas and other provinces, as well. The questionnaires were distributed to Thai consumers’ age range from less than twenty to more than fifty nine years old in sampling way. The overall outcomes of the research are the statistical quantitative data receiving from conducted questionnaire surveys. We would show the series of findings respectively in order to follow easier. To begin with psychographic findings and followed by purchasing and consuming behavioral findings, demographic and geographic findings and attitude findings. The finding data was illustrated in form of pie chart and bar chart represent frequency and percentage of quantitative data.
4.1 Psychographic findings
The authors asked the consumers about their hobbies and the places that they usually have meals.
Reading books 12% Surfing Internet 62% Shopping 10% Travelling 8% Playing sports 4% Others 4% Figure 4.1: Hobby
According to the figure 4.1, most people spend their free-time on surfing internet with the percentage of 61.7. The later popular hobbies are reading books, shopping and travelling with the percentage around 10 for each.
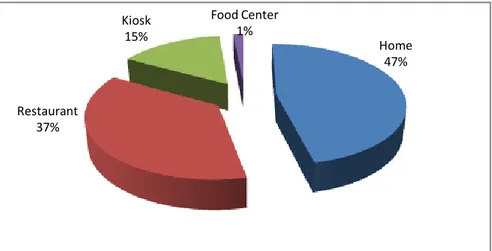
24 Home 47% Restaurant 37% Kiosk 15% Food Center 1%
Figure 4.2: Eating place
The figure 4.2 shows the frequency of the places that people usually have their meals. Almost a half of sample often has their meals at their home, followed by restaurant and kiosk.
4.2 Purchasing, and Consuming behavior findings
We asked the respondents about their purchasing and consuming behaviors, consuming frequency and also consuming details. 98.7 percentage of sample had ever consumed Ready-to-eat meals. There is only 1.3 percentage of sample had never consumed the products.
Less than once a month 13% Once a month 9% 2-3 times per month 37% 2-3 times per week 33% almost or everyday 8%
Figure 4.3 Consuming frequency
From figure 4.3, 36.8 percent of the people consume Ready-to-eat meals 2-3 times per month and 32.9 percent consume Ready-to-eat meals 2-3 times per week.
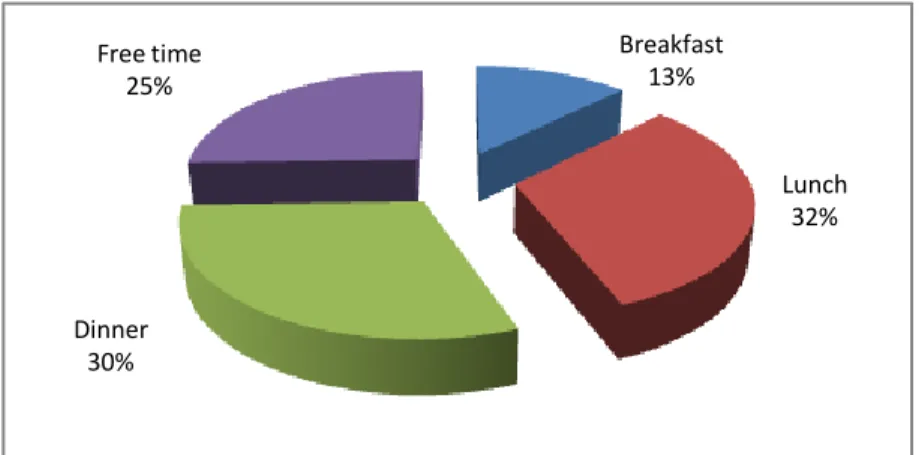
25 Breakfast 13% Lunch 32% Dinner 30% Free time 25% Figure 4.4 Meal
Figure 4.4 shows that people consume Ready-to-eat meals mostly for their lunch and follow by dinner, their free time and breakfast respectively.
Convenience 73% quality 3% time saving 10% taste 14%
Key Factor
Figure 4.5 Key factor
Figure 4.5 shows how consumers are influenced by Ready-to-eat meals. The majority think that Ready-to-eat meals are convenient for them and follow by taste, time saving, quality and price.
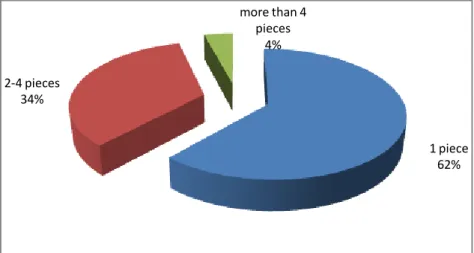
26 1 piece 62% 2-4 pieces 34% more than 4 pieces 4%
Figure 4.6 Quantity per purchase
From figure 4.6, this shows that how many pieces of Ready-to-eat meals consumers buy. 61.7 percent of all responses show that consumers buy only 1 piece each time. 34.2 percent of consumers buy 2-4 pieces and only 4.1 percent buy more than 4 pieces each time.
7-Eleven 69% Big C 4% Macro 0.5% Tesco Lotus 7% Tops 4% Local Shop 16%
Figure 4.7 Place of distribution
According to figure 4.7, consumers obviously buy Ready-to-eat meals from 7-Eleven followed by local shop, Tesco Lotus, Tops, Big C and Macro respectively.
27 Less than 30 THB 15% 30-50THB 71% 50-70THB 10% More than 70 THB 4% Figure 4.8 Price
Figure 4.8 shows prices of Ready-to-eat meals consumers purchase. Most of the consumers or 71 percent purchase Ready-to-eat meals price between 30-50 THB, follow by less than 30 THB, 50-70 THB and only 4.6 percent purchase Ready-to-eat meals price more than 50-70 THB.
4.3 Demographic and Geographic findings
We asked the respondents about their personal backgrounds which are sex, age, household member, occupation, level of monthly income and resident location.
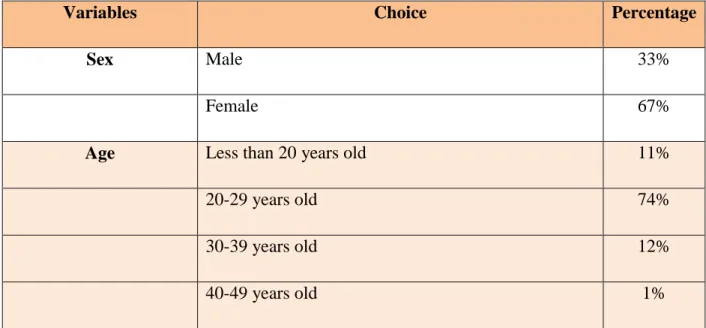
Table 4.1 sex, age, household member, occupation, level of monthly income and resident location of respondents. (own illustration)
Variables Choice Percentage
Sex Male 33%
Female 67%
Age Less than 20 years old 11%
20-29 years old 74%
30-39 years old 12%
28
Age (Cont.) 50-59 years old 2%
More than 59 years old 0%
Household member Living with partner or family without children 73%
Living alone 21%
Living with children 1%
Living with partner or family with children 5%
Occupation Students 45% Private employee 29% Own business 16% Public employee 7% Others 2% Unemployed 1%
Level of income Less than 10,000THB 38%
10,000-19,999THB 23%
20,000-29,999THB 20%
More than 30,000THB 20%
Resident location Central Bangkok 55%
Boundary areas of Bangkok 16%
Others 29%
From the table 4.1, the authors got 389 responses. 261 respondents or 67% of all respondent were female and 128 respondents or 33% were male. For different categories of ages of
29
responses, most of them are between 20-29 years old, follow by 30-39 years old, less than 20 years old, 50-59 years old, 40-49 years old and age more than 59 years old. Household member, most of the respondents or 72.8 percent live with partner or family without children follow by living alone, living with partner or family with children and living with children. For occupation, the respondents are mostly students and private employees, followed by own business and public employees. The level of income per month of respondents, around 30 percent of the respondents have income less than 10,000 THB, follow by 10,000-19,999 THB, more than 30,000 THB and lastly around 20,000-29,999 THB. Lastly, resident location of respondents, 54.8 percent are in central Bangkok. 28.8 percent are in other provinces and 16.5 percent are in boundary areas of Bangkok.
4.4 Attitude findings
The authors also asked the respondents about their attitudes toward Ready-to-eat meals, the products‟ quality and the factors that may require development. These attitudes consist of Affective attitude, cognitive attitude and conative attitude.
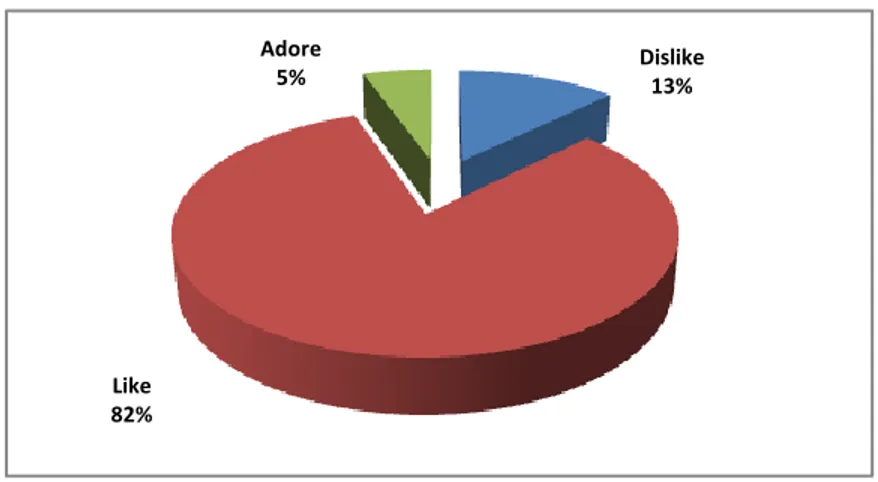
4.4.1 Affective attitude Dislike 13% Like 82% Adore 5%
30
According to figure 4.9, Ready-to-eat meals gain positive consumer‟s satisfaction as the result that most people like Ready-to-eat meals with percentage of 82 and around 5 percent of them love it but there is around 13 percent of people still dislike the products.
4.4.2 Cognitive attitude
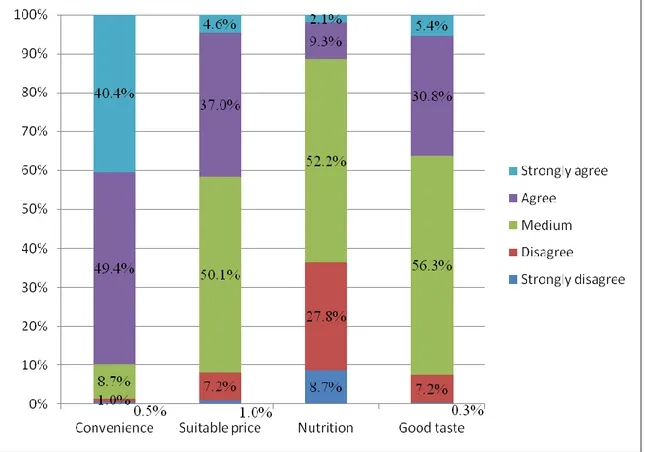
Figure 4.10: Consumers‟ attitude on ready-to-eat meals‟ quality (Cognitive attitude)
According to figure 4.10, around 50 percent of all people agree that Ready-to-eat meals could provide them convenience while around 40 percent of them strongly agree. About suitable price attitude, most people feel neutral and agree that Ready-to-eat meals have suitable price. Most people have attitude about nutrition in medium with around 50 percent and disagree with more than 20 percent. Lastly, more than 50 percent of all people feel neutral about the taste of Ready-to-eat meals when around 30 percent of them agree that Ready-Ready-to-eat meals have good taste.
31
4.4.3 Conative attitude
Figure 4.11: Consumers‟ attitude on required development factors (Conative attitude)
According to figure 4.11, 50.6 percent of respondents think that the price of Ready-to-eat meals should be developed. Around 80 percent of people think that the package of Ready-to-eat meals has no need to be developed. 51.7 percent of respondents think that the taste of Ready-to-eat meals required development. Furthermore, it is obvious that the promotion and the place for distributing Ready-to-eat meals did not require development. This was supported by more than 75 percent of all respondent. Lastly, more than a half of all people require developing of promotion.
32
5. Data analysis
The empirical findings of Thai consumers would be analyzed in order to demonstrate the segmentation of Thai consumers for Thai Ready-to-eat meals and test hypothesizes that were conducted for each series of finding data. SPSS, an analytical tool was very helpful in analyzing process.
5.1 Psychographic Data Analysis
Psychographic variables which can refer to consumers‟ lifestyle such as hobby and eating place were considered whether each variable affects Thai consumers‟ affective attitude or not. Then we would see whether psychographic segmentation can be done in order to segment Thai ready-to-eat meals‟ consumers or not.
Hypothesis 1: The psychographic data and Thai consumers’ affective attitude towards Thai Ready-to-eat meals are not independent.
Statistical Method: Chi-square Test Independent variable: Affective attitude Dependent variable: Hobby and Eating place
Table 5.1: The Chi-square Test between Psychographic Data and Thai consumers‟ affective attitude
Psychographic Data Chi-square Value df Asymp. Sig. (2-sided)
Hobby 17.780 10 0.059
Eating place 6.028 6 0.420
As Table 5.1, the results from Chi-square test between psychographic data towards Thai consumers‟ affective attitude indicated that there is no psychographic factor relevant to Thai consumers‟ affective attitude for Thai Ready-to-eat meals. Both hobby and eating place got p-values (sig.) which shown in the table 5.1 more than 0.05 level of significance and can be
33
rejected from the analysis of influence psychographic factor on Thai consumers‟ affective attitude toward Thai Ready-to-eat meals.
5.2 Purchasing and Consuming Behavioral Data Analysis
Consumers‟ behaviors are very important for marketing but we specified on purchasing and consuming behavioral variables such as consuming frequency, meal, key factor, quantity per purchase, price and place. We would see whether behavioral segmentation can be done in order to segment Thai ready-to-eat meals‟ consumers or not.
Hypothesis 2: The behavioral data and Thai consumers’ affective attitude towards Thai Ready-to-eat meals are not independent.
Statistical Method: T-Test and Chi-square Test Independent variable: Affective attitude
Dependent variable: Consuming experience, Consuming frequency, Meal, Key factor,
Purchasing quantity, Place and Price
Table 5.2: The T-Test between Consuming Experience and Thai consumers‟ affective attitude
Levene's Test for Equality of
Variances t-test for Equality of Means
F Sig. t df Sig. (2-tailed) Mean Difference Std. Error Difference 95% Confidence Interval of the Difference Lower Upper Attitude Equal variances
assumed 1.162 .282 -.387 387 .699 -.07 .189 -.444 .298 Equal variances
34
According to table 5.2, the outcome from T-Test between Consuming experience (consuming & non-consuming person) and Thai consumers‟ affective attitude shows that Sig.(2-tailed) Equal variance assume = 0.699 > 0.05 level of significance which mean there is no difference between consuming & non-consuming. It can be concluded that Consuming experience is not relevant to Thai consumers‟ affective attitude.
Table 5.3: The Chi-square Test between Behavioral Data and Thai consumers‟ affective attitude Behavioral Data Chi-square Value df Asymp. Sig. (2-sided)
Consuming frequency 27.840 8 0.001(*)
Meal 4.348 6 0.630
Key factor 28.529 8 0.000(*)
Quantity per purchase 3.557 4 0.469
Place 41.637 10 0.000(*)
Price 13.971 6 0.030(*)
Note: * significant at the 0.05 level (2-tailed)
As Table 5.3, the results from Chi-square test between behavioral data towards Thai consumers‟ affective attitude indicated that there are four behavioral factors relevant to Thai consumers‟ affective attitude for Thai Ready-to-eat meals. There are four p-values (sig.) which shown in the table 5.3 less than 0.05 level of significance including Consuming frequency (0.001), Key factor (0.000), Place (0.000) and Price (0.030), it can be concluded that there are significant relationships between Consuming frequency, Key factor, Place and Price to Thai consumers‟ affective attitude towards Thai Ready-to-eat meals. On the other hands, Meal and Quantity per purchase can be rejected from the analysis of influence psychographic factor on Thai consumers‟ affective attitude toward Thai Ready-to-eat meals.
35
5.3 Demographic and Geographic Data Analysis
Demographic and geographic variables are consumers‟ personal data such as sex, age, occupation and so on. They were considered whether each variable affects Thai consumers‟ affective attitude or not. Then we would see whether demographic and geographic segmentation can be done in order to segment Thai ready-to-eat meals‟ consumers or not.
Hypothesis 3: The Demographic and Geographic data and Thai consumers’ affective attitude towards Thai Ready-to-eat meals are not independent.
Statistical Method: T-Test and Chi-square Test Independent variable: Affective attitude
Dependent variable: Sex, Age, Household member, Occupation, Level of income per month
and Resident location
Table 5.4: The T-Test between Sex and Thai consumers‟ affective attitude
According to table 5.4, the outcome from T-Test between Sex (Male & Female) and Thai consumers‟ affective attitude shows that Sig.(2-tailed) Equal variance assume = 0.646 > 0.05 level of significance which mean there is no difference between male & female. It can be concluded that Sex is not relevant to Thai consumers‟ affective attitude.
Levene's Test for Equality of
Variances t-test for Equality of Means
F Sig. t Df Sig. (2-tailed) Mean Difference Std. Error Difference 95% Confidence Interval of the Difference Lower Upper Attitude Equal variances
assumed .131 .718 -.460 387 .646 -.02 .045 -.110 .068 Equal variances
36
Table 5.5: The Chi-square Test between Demographic and Geographic Data and Thai consumers‟ affective attitude
Demographic and
Geographic Data Chi-square Value df Asymp. Sig. (2-sided)
Age 24.619 10 0.006(*)
Household member 6.378 6 0.382
Occupation 16.963 10 0.075
Level of income per month 11.602 8 0.170
Resident location 3.483 4 0.480
Note: * significant at the 0.05 level (2-tailed)
As Table 5.5, the results from Chi-square test between demographic and geographic data towards Thai consumers‟ affective attitude indicated that there is one factors relevant to Thai consumers‟ affective attitude for Thai Ready-to-eat meals. Age factor has p-values (sig.) < 0.05 level of significance and it can be concluded that age factor is significant related with Thai consumers‟ attitude for this research. On the other hands, Household member, Occupation, Level of income per month and Resident location can be rejected from the analysis of influence behavioral factors on Thai consumers‟ affective attitude toward Thai Ready-to-eat meals.
37
5.4 Attitude Data Analysis
There are three components of attitude but only affective attitude was considered to be base for segmentation. Cognitive and conative attitude are also considered additionally as practical implication for this research.
Hypothesis 4: There are relationships between cognitive attitude about quality and affective attitude toward Ready-to-eat meals.
Statistical Method: ANOVA and Multiple Linear Regressions Independent variable: Affective attitude
Dependent variable: Cognitive attitude
Table 5.6: The Coefficient of Determination, ANOVA Test and Multiple Linear Regressions Coeffifients for cognitive attitude about quality
Model Summary Model R R Square Adjusted R Square Std. Error of the Estimate 1 .433(a) .188 .179 .379 ANOVA(b) Model Sum of
Squares df Mean Square F Sig. 1 Regression 12.753 4 3.188 22.167 .000(a) Residual 55.231 384 .144 Total 67.985 388 Coefficients(a) Model Unstandardized Coefficients Standardized Coefficients t Sig. B Std. Error Beta 1 (Constant) .864 .150 5.752 .000 Convenience .019 .028 .031 .653 .514 Suitable price .037 .029 .064 1.288 .198 Nutrition .065 .024 .131 2.724 .007(*) Good taste .205 .031 .344 6.674 .000(*)
38
According to table 5.6 represents “Model Summary”, Coefficient Determination (R2 Adjusted) is 0.179, it means that 17.9% of the variation in Affective Attitude toward Ready-to-eat meals is explained by the variation in cognitive attitude about four quality factors. Referred to p-value (Sig.) = 0.000 < 0.05 significant level in ANOVA table, it indicated that the multiple linear regressions model can be appropriately conducted. Finally, the „„Regression Coefficients‟‟, there are two p-values (Sig.) < 0.05 level of significance. As the result, it can be concluded that affective attitude towards Ready-to-eat meals influences or affects on Thai consumers from two quality factors including Nutrition and Good taste. On the other hand, suitable price and convenience do not relate to consumers‟ affective attitude contrasting with ACNeilsen (2006) stated that Thai consumers purchase ready-to-eat meals because they have no time to prepare proper meals which refers to convenience reason.
39
Hypothesis 5: There are relationships between conative attitude about factors that require development and affective attitude toward Ready-to-eat meals.
Statistical Method: ANOVA and Multiple Linear Regressions Independent variable: Affective attitude
Dependent variable: Conative attitude
Table 5.7: The Coefficient of Determination, ANOVA Test and Multiple Linear Regressions Coefficients for conative attitude about factors that required development
Model Summary Model R R Square Adjusted R Square Std. Error of the Estimate 1 .271(a) .074 .059 .406 ANOVA(b) Model Sum of
Squares df Mean Square F Sig. 1 Regression 5.010 6 .835 5.065 .000(a) Residual 62.974 382 .165 Total 67.985 388 Coefficients(a) Model Unstandardized Coefficients Standardized Coefficients t Sig. B Std. Error Beta 1 (Constant) 2.215 .126 17.631 .000 Price require -.021 .042 -.025 -.495 .621 Package require -.003 .055 -.002 -.048 .962 Promotion require -.218 .042 -.260 -5.154 .000(*) Advertising require -.054 .051 -.055 -1.054 .293 Place require .025 .059 .022 .422 .674 Taste require .075 .043 .090 1.754 .080
40
According to table 5.7 represents “Model Summary”, Coefficient Determination (R2 Adjusted) is 0.059, it means that 5.9% of the variation in Affective Attitude toward Ready-to-eat meals is explained by the variation in conative attitude about six properties that may required development. Referred to p-value (Sig.) = 0.000 < 0.05 significant level in ANOVA table, it indicated that the multiple linear regressions model can be appropriately conducted. Finally, the „„Regression Coefficients‟‟, there is one p-values (Sig.) < 0.05 level of significance. As the result, it can be concluded that affective attitude towards Ready-to-eat meals influences or affects on Thai consumers from Promotion required development.
41
6. Conclusions and Recommendations
In this final chapter of this research, the conclusions and recommendations from the quantitative analysis of previous chapter have illustrated according to the purpose of this research were settle in the first chapter.
This exploratory research can be concluded on the research topic “Thai consumers’ segmentation for Ready-to-eat meals in Thailand” in order to fulfill the purpose which is to explore the segments of the Thai consumers based on Thai consumers’ affective attitude toward Thai ready-to-eat meals in Thailand and based on theories by separated into 3 types of attitude.
6.1 Affective Attitude (Theoretical implication)
As Peter et al. (1999) mentioned that affective attitude can be measured simply and directly by asking consumers to indicate their feeling about the product. Consumers‟ affective attitude refers to their feeling about the product which should be similar for each segment since consumers in the same segment would response similarly. In other words, effective segmentation should have relationship with consumers‟ affective attitude.
Consumers‟ affective attitude for this research is in form of like-dislike attitude and it has some relationship with some segmentation factors.
Segmentation factors tested in this research is shown in table 6.1.
Table 6.1 Segmentation factors