DEGREE PROJECT IN ENGINEERING PHYSICS, FIRST CYCLE, 15 CREDITS
STOCKHOLM, SWEDEN 2019
A Comparative
Analysis of Linear
and Non-Linear
Classification
methods LDA and
QDA for
Brain-Computer
Interface
KTH Bachelor Thesis Report
Daniel Chikmamat
Ali Abdihakim
EXAMENSARBETE INOM TEKNISK FYSIK, GRUNDNIVÅ, 15 HP STOCKHOLM, SVERIGE 2019
En jämförelse analys
av linjära och
icke-linjära
klassificerings
metoder LDA och
QDA för hjärn-dator
gränssnitt
KTH Bachelor Thesis Report
Daniel Chikmamat
Ali Abdihakim
Abstract
Brain-computer interfaces (BCIs) are systems, communication pathways that enables users to interact with exterior devices without relying on bodily movements. This interaction between human and machine is possible by allowing the system access to read the brains electrical activity, often via electroencephalograms (EEG). The data is afterwards utilized as training sets to teach the BCI to map and predict selective brain patterns to certain commands.
This papers main aim is to investigate the accuracy of two classification methods, linear discriminant analysis (LDA) and quadratic discriminant analysis (QDA) from two aspects, single-subject cross-validation and cross-subjects generalization. The data consisted of 30 subjects, two sessions for a binary classification task, that being, closing right/left hand.
The results show that the accuracy of the classifiers LDA and QDA are relatively similar. The accuracy is defined as the number of correctly classified tasks in relation to the number of classes. For the result one-way Analysis of Variance (ANOVA) was utilizes, with the null-hypothesis that the mean-accuracy are the same for LDA and QDA. The mean-value results for single-subject cross-validation were between 57-59% . The accuracy for cross-subject generalizations were between 49-51 % . Both classifiers performed similarly, and the null hypothesis could not be rejected. However there are differences in performance when comparing single-subject cross-validation and cross-subject generalization. This paper further discuss factors that provided the results such as classification models LDA vs QDA, subjects and other causes.
Abstract
Hjärn-dator gränssnitt (BCI) är system, kommunikationsvägar som gör det möjligt för användare att interagera med externa enheter utan att förlita sig på kroppsrörelser. Denna växelverkan mellan människa och maskin är möjlig genom att tillåta systemåtkomst för att läsa hjärnans elektriska aktivitet, ofta via elektroencefalogram (EEG). Uppgifterna används därefter som träningsmaterial för att lära BCI att kartlägga och förutsäga selektiva hjärnmönster till vissa kommandon.
Huvudmålet i denna projekt är att undersöka noggrannheten av två klassificerings metoder, linear discriminant analysis (LDA ) och quadratic discriminant analysis (QDA) från två aspekter, crosss- validation och cross-subject generalization. För projekten togs data som bestod av 30 subjekt, två sessioner för en binär klassificerings uppgift, det vill säga stängning av höger / vänster hand.
Resultatet visar att noggranheten hos klassificeringserna LDA och QDA är relativt lika. Noggrannheten definieras som antalet korrekt klassificerade uppgifter i förhållande till antalet klasser. För resultatet användes one-way Analysis of Variance (ANOVA), med noll-hypotes att medelvärdes noggranheten är densamma för LDA och QDA. Medelvärdesresultatet för cross-validation var mellan 57-59%. För cross-subject-generalization var medelvärdes noggranheten var mellan 49-51%. Båda klassificerars noggranhet var nära och noll-hypotesen kunde inte förkastas. Dock finns det skillnader i prestanda vid jämförelse med ett-subjekt cross-validation och cross-subject generalisering. Studien diskuterar ytterligare faktorer som ger upphov till dessa resultat t.ex klassificeringsmodeller, LDA vs QDA, subjekterna och andra faktorer.
Keywords
• Brain-computer interface (BCI) - A communication pathway that enables human to control exterior systems by allowing devices to read brains electrical activity.
• Electroencephalography (EEG) - is an electrophysiological monitoring method to record electrical activity of the brain.
• Classifiers - A machine learning algorithm that utilizes training data to understand how given inputs relates to the classes, in our case closing left/right hand. The classifiers we analyse are linear discriminant analysis (LDA) and quadratic discriminant analysis (QDA).
• Cross-validation - Is a statistical method used to estimate the skill of machine learning models. K-fold cross validation is a procedure used to estimate the skill of the model on new data by splitting data into k-1 training parts and the k:th one being the validation partition.
• Cross-subject generalization - Is a statistical method in which the training set is data from entire subjects, while validation set are other subjects which were not utilized in previously used training sets.
Authors
Ali Abdihakim <aliaa6@kth.se> and Daniel Chikmamat <dchi@kth.se> Electrical Engineering and Computer Science
KTH Royal Institute of Technology
Place for Project
Stockholm, Sweden
Examiner
Hedvig Kjellström
KTH Royal Institute of Technology
Supervisor
Pawel Herman
Contents
1 Introduction 3 1.1 Purpose . . . 4 1.2 Scope . . . 4 1.3 Thesis Outline . . . 5 2 Background 6 2.1 Brain-Computer Interface (BCI) . . . 62.2 Electroencephalography (EEG) . . . 8
2.3 Classifiers . . . 10
2.3.1 Linear Discrimination Analysis (LDA) . . . 10
2.3.2 Quadratic Discriminant Analysis (QDA) . . . 11
2.3.3 Theoretical Difference LDA vs QDA . . . 12
3 Methodology 14 3.1 EEG-data . . . 14 3.2 Feature Extraction . . . 14 3.3 Method of Classification . . . 15 3.3.1 Cross-validation . . . 16 3.3.2 Cross-session generalization . . . 16
3.4 One-way Analysis of Variance (ANOVA) . . . 17
4 Result 18 4.1 Cross-validation . . . 18 4.2 Cross-subject Generalization . . . 20 5 Discussion 23 5.1 Result Analysis . . . 23 5.1.1 LDA vs QDA . . . 23
5.1.2 Cross-validation vs cross-subject Generalization . . . 24
5.2 Project Improvements . . . 24
5.3 Ethical Examination . . . 25
5.4 Future Work . . . 26
1
Introduction
Ever since the development of the first computer device technologists have been in constant search of creating a direct connection between computer and the human brain. In comes the brain-computer interface.
Brain-computer interface (BCI) is a relatively newly emerging field of science that provides an interaction between the brain and an exterior device and allows a person to control devices such as computers and prosthetic with ones thoughts. Not only will BCIs allow severely physically disabled to utilise prosthetic as a replacements for extremities and other parts of the body, BCIs have the potential to eventually replace the entire canon of human knowledge. No more searching the internet via typing or voice commands needed. In a near future, we will be able to think about what we need and pull whatever relevant information is available directly from a cloud and into the forefront of our minds [1].
Brain-computer interface works by interpreting acquired brain signals. Many kinds of signals could be used in BCI, however, the most predominant BCI systems are based on the discrimination of EEG [2]. Thus this work solely focuses on the study of EEG-based brain-computer interface.
Of course, the performance of the BCI is lower than wanted [3] and researchers are actively working on enhancing it. For further enhancement, it is paramount that, when using a BCI, the process of classification is working as good possible. Therefore, a goal of ours is to compare linear and non-linear methods of classification, and to find out which of the LDA or QDA that produce the best results.
This paper focuses on studying and comparing the accuracy of these classifiers when classifying certain brain pattern signals using two statistical models of validation, single-subject cross-validation and cross-subject generalization. Most successful attempts of BCI application are limited to single-subject cases. The accuracy suffers greatly when training and testing data across subjects [23], [24]. It is paramount for the future of BCI to further enable generalization across subjects in order for BCI to become a feasible device for common use. Therefore, another main objective in this paper is to analyze the difference in performance of
the two classifiers depending on the method of model validation.
The data is taken from electroencephalogram (EEG) recordings in which the subjects imagine moving their left arm and then their right arm.
1.1
Purpose
The goal and purpose of this research is to investigate and compare linear and non-linear classification methods: LDA and QDA, to a certain brain pattern to determine ,which of the two classifiers is best suited to classify the chosen brain pattern signals.
The project is aimed at examining the potential of classification algorithms to generalise, considering the accuracy, over separate sessions and subjects. Moreover, it examines and compares the accuracy between the classification algorithms LDA and QDA in two aspects, that being validation and cross-subject generalization.
Accuracy means the rate of correctly classified data points that the brain patterns give rise to.
1.2
Scope
In order to assure a feasible scope of the thesis the paper upholds some limitations to limit the research.
• Only two different classifiers are used for evaluation. One linear, LDA and one non-linear (quadratic), QDA.
• The data is only acquired via EEG.
• Only signals from 18 of 64 channels are investigated
• The data used are from binary classification task. Closing of the right and left hand.
• Models of validation used in this paper are limited to: - single-subject cross-validation, 5-fold - Cross-subject generalization
1.3
Thesis Outline
This paper starts and provides an introduction to the concept of brain-computer interface and also provides the problem statement. The second section introduces fundamental concepts to the thesis such as brain-computer interface (BCI), electroencephalography (EEG) and machine learning algorithms known as classifiers. Subsequently the methodology is presented and explains the process of collecting EEG-data, extracting data, method of classification for testing cross-validation and cross-subject generalization and utilization of statistical test ANOVA. The fourth chapter displays the accuracy of LDA and QDA for cross-validation and cross-subject generalization. For each classifier and method of validation the results are represented with tables and graphs, as well as two additional graphs demonstrating the accuracy for LDA and QDA with method of cross-subject generalization depending on the quantity of patients used as training. The fifth phase discusses and analyses the results in a broader context. The final synopsis contains a conclusion, highlighting the results as well as the most important takeaways from the thesis such as the ethical aspects of BCI and its future.
2
Background
This chapter explain in overview the concepts of brain-computer interface and the signal it interprets, EEG. It also explains the two classifiers used in this paper.
2.1
Brain-Computer Interface (BCI)
A brain-computer interface is a communication pathway that enables human beings to interact with exterior devices via way of electrical activity of the brain. It interprets the activity of the brain by classifying signals, often retrieved by electroencephalograms, and later on pass these commands to the exterior device. In practise, it works by putting a headgear on for signal acquisition of the brain. It later on processes these signals, and command the exterior device to act on these commands [3].
A predominant motive of BCI is affiliated with the rehabilitation of the physically disabled [4]. So much so that some developers call the BCI ”Freedom of the disabled”. Although the BCI research and development is in its early stages, and is far from effective in increasing the quality of life of handicapped people, the progressive development of the BCI is looked on with great anticipation. Furthermore , the BCI can also be a promising interaction tool for healthy people, with several potential applications in the field of multimedia, VR and video games among many other potential applications.
The utilization of the BCI is however a daunting assignment. One of these challenges are the training sets. Training sets is a way for the user and the system to ”get to know each other” by letting the user continuously provide consistent brain pattern activation and the system to learn to recognize the specific brain pattern signal. This is often a very time consuming task. Because of this, there is a paradoxical problem researchers battle with. More training is often more time consuming but lead to classification of the signals with better accuracy.
The BCI also come with performance issues. Again, the BCI works by interpreting brain signals acquired via EEG. EEG often becomes fairly unreliable because of artefacts, emanating partly from bodily movements and surrounding noises, thus affecting the validity of the EEG signals. Another complication is the logistics. The fact that BCI is supposed to enable the disabled, yet require them to insert a headgear, which can be hard to put on, for signal acquisition could be next to impossible for physically or cognitive debilitated people.
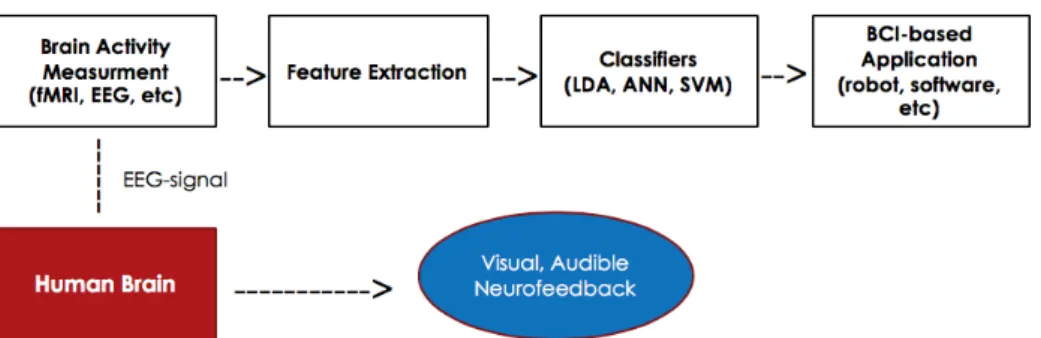
The process of BCI can be divided into 4 parts(see figure 2.1): 1. Brain signal measurement/acquisition via EEG. 2. Feature extraction 3. Classification 4. BCI-based application.
Figure 2.1. General process of Brain-computer interface. The subject generates
a signal, which in many cases are acquired via EEG. The BCI processes the signal and removes artifacts such as bodily movements and disturbing noises. The now extracted signal is thereafter passed on to the classifier which works to determine the brain pattern command to pass to the BCI-based application. The application executes the command prompted by the subject, and any further feedback is provided to the subject.
This paper is mostly focused on the aspect of classification in which the BCI system works to determine what type of action the user desires to execute by interpreting the acquired brain pattern signal. Furthermore, not only does the classification need to interpret the brain signals, it also need to do so in real time with, at the very least, reasonable degree of accuracy.
The aspect of classification is looked from two angles. One being how well do these classifiers perform when training and testing on one subject, as well as how well they perform when training on one or more subject and testing on others.
2.2
Electroencephalography (EEG)
In order for the BCI to function it has to measure the electrical activity of the brain, hence the electroencephalography (EEG).
EEG is a method of documenting the electrical signals produce by a persons brain activity. When one has a thought, for instance to move an extremity, it causes the brain to release electrical potential which are registered by the EEG [5]. EEG utilizes electrodes that usually are either attached to ones scalp or attached to a headgear which then is inserted on top of ones head. The electrodes are glued in a grid pattern that covers the scalp according to an international convention, the so-called 10-20 system, with reference points in the nasal root and the nib-bone branch point (see figure 2.2.1). The graphical representation of the signals are called electroencephalogram [6].
All electrodes in the 10-20 convention are labelled with a letter that describe their anatomical position, theses are: F lobe, T temporal lobe, C central lobe, P -parietal lobe, O - occipital lobe. The 10-20 convention place the odd numbered electrodes to the left side of the head and the even numbers to the right side of the head.
Figure 2.2. EEG electrodes placed according to international 10-20 convention.
[7]
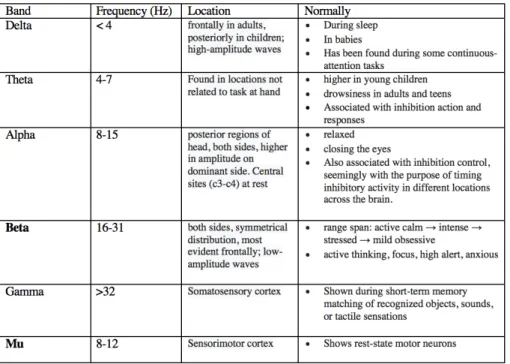
EEG often describes the rhythmic activity of the brain which are partitioned into bands of frequencies [8]. This division was made because certain types of rhythmic activity in different frequencies appear to be distributed differently or have different biological properties. For instance, the rhythmic activity between 8-12 Hz can be described as ”alpha” and is mostly detected when the subject are relaxed and close their eyes (see table 2.2.1).
Table 2.2. Table containing band of frequencies, their respective frequencies,
location on the brain and related functions. The two highlighted bands Mu beta band are strongly correlated with motor movements and are of importance further in this paper. [7]
2.3
Classifiers
Classifiers are an integral part in the BCI system. They are responsible for correctly interpreting the recorded EEG signals as a command to execute an action. There exist many different classification algorithms of which many are based on the concept of machine learning [2]. Machine learning is a subcategory of the broader concept known as artificial intelligence, which is about methods for getting computers to ”learn” from data without the computers being programmed for that particular task. One well known ”learning” mechanism is supervised learning. The idea is to use old sample as training sets to later on classify new samples called test sets. By then classifying the training set you get the training accuracy, in which it is very important to get a good result on as it can not be expected to perform better on new set of data (test set) than an older one (training set). After classifying the training set the classifier enters the testing phase, in which testing is made on how accurate the classifier is on input (test set) it has never encountered before [9]. The higher the accuracy is on the test set, the better the classifier is considered to be at generalizing. Note also that the true measurement of a classifiers performance is based on the accuracy of the test set. Furthermore, when accuracy is mentioned it always refer to the accuracy of the test set.
In this report two classifiers based on the machine learning concepts are utilized, that being, Linear discrimination analysis (LDA) and Quadratic discriminant analysis (QDA).
2.3.1 Linear Discrimination Analysis (LDA)
The idea with discrimination analysis is to assign an object with an observation vector x to any of two or more classes (in our case two classes are more than enough). The LDA projects the given classes on the vector and the vector is supposed to maximize the separation of the classes when projected on. LDA seeks to reduce the dimensionality while preserving as much of the class information as possible [10]. In the given example, figure 2.3.1, a 2-dimensional information is reduced to a 1-dimensional problem.
Figure 2.3.1 Left graph: A project with non-ideal separation. Right graph: A
projection with ideal separation .
Assume we have a set of D-dimensional samples x(1), x(2), ... x(N) ,N1 of which belong to class w1, and N2 to class w2. LDA seek to obtain a scalar y by projecting the samples x into a line : y = wTx. Of all the possible lines LDA selects the one that maximizes the separability of the scalars.
LDA is a very useful method to, for example, diagnose sickness [11] in which you are able, by measuring some chosen critical variables decide if a subject should be diagnosed as sick or not. In the most common form of discriminant analysis, linear discriminant analysis, it is assumed that the variance in the two populations are equal. If this is not the case, one can instead use quadratic discriminant analysis, QDA, the problem with this method is that it is not considered as reliable as LDA.
In an LDA implementation your input is an n-dimensional data set and the output is the classification of each element in the data set. LDA project the given classes on a vector.
2.3.2 Quadratic Discriminant Analysis (QDA)
QDA is closely connected with linear discriminant analysis (LDA). For both classification methods the presupposed assumption is that the data is normally distributed. The difference in assumption is that QDA assumes that each class has its own covariance, while LDA assumes that the covariance is the same for
different classes. Also again, the idea with QDA, as is with discriminant analysis methods, is to project the given classes on to the designed hyper-plane to [12]: a) Separate the classes of data
b) reduce dimensionality of the problem.
What is obvious in the name Quadratic discriminant analysis is that the hyper-plane is quadratic as opposed to LDA in which it is linear.
2.3.3 Theoretical Difference LDA vs QDA
As previously mentioned, the difference in assumptions in LDA and QDA being the covariance of the data classes. LDA assumes the covariance for each class is the same while QDA assumes each class has its own covariance, thus covariance for different classes aren’t necessarily the same. Hence a covariance matrix has to be estimated for each class in QDA, thus the number of parameters can, in some cases, be very large.
Figure 2.3.3 Number of estimated parameters, LDA vs QDA [14]. The black
curved graph represents parameters in QDA and the red dotted line represents parameters in LDA.
The graph illustrates that the higher the dimension of the data set the more parameters have to be estimated. This can lead to a high variance, therefore QDA is hesitantly utilized and is generally seen as more unreliable as LDA [13].
3
Methodology
This paper examines the two mentioned linear and quadratic classification methods for classifying EEG data. Beginning with the linear discriminant analysis and thereafter moving on to the quadratic discriminant analysis.
The methodical process starts with finding EEG-data (section 3.1). Thereafter features were extracted from the data to be used as input for the classifiers (section 3.2). LDA and QDA were implemented via method of validation and cross-subject generalization (section 3.3).
3.1
EEG-data
The EEG data originated from Physionet [25]. The project consisted of classifying EEG data signals sampled from 30 subjects imagining opening and closing their left hand or right hand. Sampling frequency of data was at 160 Hz samples per seconds. There were, for every subject, 45 trials, 23 for closing right hand and 22 for closing left hand or vice versa. The documented signals had been measured for a duration of 4.1 seconds with a rest of 4.1 seconds between each trial. The values were divided into 3 annotations, that being between: rest, imagining closing left hand, imagining closing right hand and each action were labeled´
3.2
Feature Extraction
The data were acquired from a total of 18 EEG-channels, 9 corresponding to each half of the brain (see figure 3.2a), and these values were averaged out. These were the selected channels since their position are closely affiliated with the motor cortex, making it likely to pick up brain activity for motor related tasks. From each brain half the derived data were from µ (8-13Hz) and β-frequencies (18-30Hz), as these again are staunchly related to motor activity and are good for training the classifiers (see table 2.2). For this periodogram was utilized (see figure 3.2b), a power spectral density estimation method converting the sampled
signals from time domain to frequency domain. The parameters for periodogram were the frequency and frequency samples with input values of 160 Hz and 256 Hz respectively. Mean values were extracted from each frequency spectrum, hence there were four signal-values for each imagining task, that being:
- Left brain, µ-band - Left brain, β-band -Right brain, µ-band -Right brain, β-band
Figure 3.2a An illustration of the the 10-20 EEG international convention. The
18 channels studied are highlighted and are part of the motor cortex of the brain which enables movement of extremities. [13]
3.3
Method of Classification
For implementation of LDA and QDA the input data for training consisted of four dimensions, which were the four averaged signal-values of mentioned in section Feature Extraction above.
The classes are vectors, labeled with zeros and ones in which 0s represents left hand closing and 1s represents right hand closing.
The goal was to classify the data into two classes based on which hand the subject imagines closing, and to then compare the classifiers accuracy in terms of cross-validation and cross-session generalization. The accuracy is defined as:
Accuracy = right classes correctly tasks/tasks
3.3.1 Cross-validation
K-fold cross-validation splits the data into five partitions. For every stage of validation four of the five partitions were utilized as training data and the fifth one for validation. This process was iterated for all partitions of data. The partition of data were sampled randomly.
Figure 3.3.1 Illustration of k-fold validation [15].
3.3.2 Cross-session generalization
As an additional reference of classification accuracy a model was trained on a number of entire data from subjects. The classifiers were trained on one subject and validated on one other subject, thereafter trained on 2 subjects and validated on one subjects. This iteration continued recursively to maximal training input of 29 subjects and validation on one subject. Cross-session generalization resembles cross-validation with the main differences being [16]:
- The training/validation data are from entire subjects. - The training/validation process is recursive.
By doing this split, the intention was to gain insight in how different the results are between single-subjects, single session classification and multiple-subjects generalization.
3.4
One-way Analysis of Variance (ANOVA)
For implementation of analysis of variance the averaged cross-validation and cross-session accuracy data was collected and ANOVA was utilized . ANOVA is a statistical test [17]. It works by testing the hypothesis and returns if null-hypothesis can be rejected or not, for a balanced on-way ANOVA. In this case the null-hypothesis was decided to be that the accuracy of LDA equals that of QDA.
4
Result
For the results analysis of variance (ANOVA) tables and plots are presented and explained for each classifier (LDA, QDA), for each statistical method (cross-validation, cross-session generalization).
4.1
Cross-validation
Table 4.1 Individual subject-wise cross-validation results for LDA and QDA in a
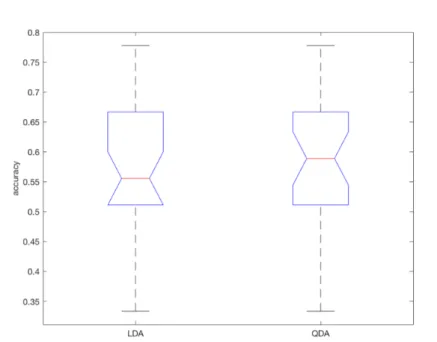
Figure 4.1 Analysis of variance (ANOVA) plots highlighting the accuracy of LDA
and QDA with method of intra-session cross-validation.
The red lines represent the mean-value of accuracy which are 0.5741 (57%) for LDA and 0.5911 (59%) for QDA both with a variance of +/- 10%. The blue upper/lower edged are quartiles, meaning that the number of observations over/under the mean value correspond to the value of the blue edged. As the result graphs show the accuracy and variance both are very close to each other. The decided null-hypothesis is that the mean-value accuracy are the same for LDA and QDA implemented with cross-validation method. The resulting p-value = 0.53 (» 0.05). Because of p-value » 0.05 one can not reject the null-hypothesis, rather the opposite, that accuracy for LDA and QDA have no significant differences in this instance
4.2
Cross-subject Generalization
Table 4.2 Individual subject-wise cross-subject-generalization results for LDA
Figure 4.2a Analysis of variance (ANOVA) plots highlighting the accuracy of
LDA and QDA with method of cross-subject generalization.
Figure 4.2b Graph highlighting the accuracy of classifiers LDA in cross-subject
generalization when trained on one subject, tested on another, then trained on two subjects, tested on another until the training data consists of 29 subjects and
test data consist of the one untrained subject. The x-axis represents the quantity of patients, describing the number of trained subjects. All validation were then tested on one subject.
Figure 4.2c Graph highlighting the accuracy of classifiers QDA in cross-subject
generalization when trained on one subject, tested on another, then trained on two subjects, tested on another until the training data consists of 29 subjects and test data consist of the one untrained subject. The x-axis represents the quantity of patients, describing the number of trained subjects. All validation were then tested on one subject.
The first graph, ANOVA-plot, works similarly as figure 4.1. Again the accuracies are relatively close, the mean-accuracy being 49% with +/- 2% variance for LDA and 51% with variance of +/- 4% for QDA. In this case the p-value = 0.1344 > 0.05 hence again one can not reject the previously stated null-hypothesis.
The two graphs 4.2b and 4.2c are meant to highlight how the accuracy would differ depending on the number of trained subject with cross-subject generalization. It is visible that they are spiky and unpredictable.
5
Discussion
The results are analyzed and discussed in relation to the problem statement. Factors that could potentially alter the result are also evaluated. An ethical discourse is later on mentioned and lastly, potential future works and impact of BCI is discussed.
5.1
Result Analysis
The intention was to evaluate the classification capacity of linear and non-linear classifiers LDA and QDA via method of intra-subject cross-validation and inter-subject cross-inter-subject generalization. Cross-validation mean-accuracy was 57% with LDA and 59% with QDA. Cross-subject mean-accuracy was 49% with LDA and 51% with QDA. There are, based on the derived results, 2 main topics to discuss:
• Difference in accurate results with LDA and QDA, LDA vs QDA
• Discrepancy in accuracy depending on method of validation, single-subject cross-validation vs cross-subject generalization
5.1.1 LDA vs QDA
If one were to look at the result, it would be a slightly more viable options to prefer QDA as oppose to LDA. Now , given that QDA requires more parameters to estimate depending on the dimension of the problem, the method of choosing linear or non-linear classification methods are not clear and is still an issue. An accepted guideline is that QDA is a better option for large data sets, as it tends to have a lower bias and a higher variance while LDA is more suitable for smaller data sets because it has a higher bias and a lower variance. Obviously this paper accord with binary brain pattern, thus the parameters to estimate are binary.
mean-accuracy and variance are practically indistinguishable, this paper can strongly conclude that the performance of LDA and QDA with our choose binary brain-pattern are identical. The fact that ANOVA test suggest that there is no statistically difference in the two classification accuracies is interesting. This implies that the choose of classifiers is irrelevant . Therefore the two classifiers are interchangeable in the problem statement. It would be interesting to see how accuracy would develop if there were more data sets and see if the accuracies would follow the well-accepted general convention, that being that QDA performs better with higher dimension of data.
5.1.2 Cross-validation vs cross-subject Generalization
The discrepancies in LDA/QDA accuracy with cross-validation and cross-session generalization is relatively high. Both classifiers had a decrease in 8 percent accuracy, thus you clearly see both classifiers accuracy clearly worsen across subject than during single-subject, cross-validation. This supports that the accuracy is lessened across subjects than single-subject sessions. Perhaps it would potentially provide more accurate results by from carefully selecting which subjects to generalize over [18], as the accuracy tend to increase the more the subjects are utilizing BCI and getting to ”know” the BCI.
5.2
Project Improvements
There are a few adjustments that could be made for potential project improvements such as:
- More subjects. Observing figure 4b and 4c in result section, there are no strict relation between number of training sets and test-accuracy. Both graph are noticeably spiky and the graph does not trend towards any direction. By including more subjects, that would potentially point the graph towards a certain trajectory, giving more insight in how many subjects are needed for a feasible generalization.
suggest that there are no statistical difference between the accuracy of either classifier LDA and QDA. Referring back to section 2.3.3 Theoretical difference LDA vs QDA, it suggest that QDA performs better with higher dimension of data. Therefore it would be alluring to witness if that would be the case with more classes of brain-pattern signals.
- More classifiers. Support vector machine (SVM), Convolutional neural network (CNN), the later being a case of Artificial neural network (ANN), are other well known classification methods for BCI-applications. Comparing more of these classifiers were not in the scope of the project, but it would furthermore highlight which classifier should be preferred over the other in relation to the problem statement.
- Binomial distribution. Both LDA and QDA performance hover around 50 percent both with cross-validation and cross-subject generalization. Implementation of binomial distribution would further highlight if the classifiers are simply ”guessing” what binary brain signal to classify.
5.3
Ethical Examination
With BCI the user controls an external device with their thoughts, but what happens if the BCI device sees a harmful thought and acts upon it? Normally one would not act upon it, it happens to all humans that we get strange thoughts and we cannot control our thoughts the same way we move a body part. Can one say that the BCI user fully responsible for this action [19]? Is there a way to filter out harmful thoughts and only act upon reasonable commands? If so, what about in the case of self-defense, where one must harm someone to be safe? The underlying issue is that it is not possible to control ones thoughts and a BCI device may pick it up and output the command, even though the user did not desire to do so. Brain processes are intimately connected to us as individuals. Our privacy concerning on our innermost thoughts and unconscious attitudes may be at risk in the future with the technological development in brain reading. However, the technology we have today is very limited. In the future it might be possible
to extract personal information from the brain such as personality features, psychiatric history, truthfulness and hidden deviation from brain scan. This could be exploited for different purposes such as screening job application, assessing insurance risks, detecting a vulnerability to mental illness, determining who qualifies for disability benefits, and so on [20]. Additionally, this could also be exploited by governments in surveillance, they could be monitoring what we are thinking in real time.
5.4
Future Work
Classifying brain-pattern signals and generalizing across subjects are vital components for the functionality of BCI. Although the machine learning process of classifying single-subject signals seems encouraging, the issue of generalizing across subject is a hurdle researchers are constantly striving with [21]. Generalizing is very important for BCI to become common usage for the everyday man, since good generalization would enable society to easily use BCI-based application without the complication of constantly training the device with their own individual brain-pattern signals. This would also further commercialize BCI-based equipments.
Feature extraction is another critical component in the BCI-process. EEG-data can be too prone to artefacts, noise and interference, making it hard for practical use which requires high demand on accuracy and real-time responsiveness. There exist alternatives to consider such as fMRI, although fMRI are expensive and not as compatible with BCI as they do not perform well in real time [22]. Perhaps one solution is to classify a limited amount of brain-patterns for different BCI-devices and to then focus on enhancing the machine learning aspect of BCI. Despite our result, indicating that generalization across subjects is difficult to achieve, the ambition is to make the process more feasible in the future.
6
Conclusion
The accuracy of a single-subject using 5-fold validation is averaged around 59-57% for both respectively QDA and LDA while the accuracy generalizing across subjects hover around 51-49%. The ANOVA results implies no statistical difference in accuracy between the two assessed classifiers. There is a relatively significant drop in performance when training and testing on single subjects as oppose to training and testing across subjects. Therefore cross-subject generalization still seem like difficult tasks to achieve. Generalizing across-subjects seems to not depend on the quantity of training subjects. The result does not show any improvements when training on more subjects which again emphasizes on the difficulty of generalizing across subjects. A potential improvement may be to carefully select subjects to generalize after exposing them to BCI. Or perhaps it would be more feasible to limit the number of brain-pattern signals for BCI-application, making it easier to train on while focusing on enhancing the machine learning aspect of classification. Nevertheless, Brain-computer interfaces are increasingly becoming reliable pieces of technology and the future of BCIs are viewed with great anticipation.
References
1. L. F. Nicolas-Alonso and J. Gomez-Gil, “Brain Computer Interfaces, a Review,” Sensors, vol. 12, no. 2, pp. 1211–1279, Jan. 2012.
2. I. Lazarou, S. Nikolopoulos, P. C. Petrantonakis, I. Kompatsiaris, and M. Tsolaki, “EEG-Based Brain–Computer Interfaces for Communication and Rehabilitation of People with Motor Impairment: A Novel Approach of the 21st Century,” Frontiers in Human Neuroscience, vol. 12, Jan. 2018.
3. Abdulkader S, Atia A, Mostafa M-S (2015) ”Brain computer interfacing: Applications and challenges”, pp 213-230
4. R.Sucholeiki,“Normal EEG Waveforms,”Overview, Frequency, Morphology, 20-Feb-2019.
[Online]. Available: https://emedicine.medscape.com/article/1139332-overview. [Accessed: 07-Mar-2019].
5. R. Sucholeiki, “Normal EEG Waveforms,” Overview, Frequency, Morphology, 06-Oct-2017.
[Online]. Available: https://emedicine.medscape.com/article/1139332-overview. [Accessed: 20-April-2019].
6. E. Niedermeyer and L. da S. F. H., Electroencephalography: basic principles, clinical
applications, and related fields, 5th ed. Philadelphia: Lippincott Williams Wilkins, 2005. https://en.wikipedia.org/wiki/Electroencephalography 7. Electrode locations of international 10-20 system for EEG
(elecroencephalography) recording. 2010
8. McFarland D. (2000) “Mu and beta rhythm topographies during motor imagery and actual movements”. In: Brain topography 12.3, pp. 177–186. 9. F. Lotte, M. Congedo, A. Lécuyer, F. Lamarche, and B. Arnaldi, “A review
of classification algorithms for EEG-based brain–computer interfaces,” Journal of Neural Engineering, vol. 4, no. 2, Apr. 2018.
10. G. James, D. Witten, T. J. Hastie, and R. J. Tibshirani, An introduction to statistical learning: with applications in R. New York: Springer, 2017. Pp-138-140
11. A. L. Spedding, G. Di Fatta, J. D. Saddy, ”An LDA and Probability-based Classifier for the Diagnosis of Alzheimer’s Disease from Structural MRI”, BIBM IEEE International Conference on, pp. 1404-1411, 2015.
12. Srivastava, Santosh R. Gupta, Maya Frigyik, Andrew. (2007). Bayesian Quadratic Discriminant Analysis.. Journal of Machine Learning Research. 8. 1277-1305.
13. Tharwat, Alaa. (2016). Linear vs. quadratic discriminant analysis classifier: a tutorial. International Journal of Applied Pattern Recognition. 3. 145. 10.1504/IJAPR.2016.079050.
14. P. Schmidt, “Linear vs. Quadratic Discriminant Analysis - Comparison of Algorithms,” Linear vs. Quadratic Discriminant Analysis - Comparison of Algorithms -, 07-Oct-2018. [Online]. Available:
http://thatdatatho.com/2018/02/12/linear-vs-quadratic-discriminant-analysis/15/. [Accessed: 10-Apr-2019].
15. Wikipedia, the free encyclopedia. (2019) ”Cross-validation (statistics)” https://en.wikipedia.org/wiki/Cross-validation_(statistics)
16. S. Handiru, Vinod A. Prasad, ”Optimized Bi-Objective EEG Channel Selection and Cross-Subject Generalization With Brain-Computer Interfaces”, IEEE Transactions on Human-Machine Systems, vol. 46, no. 6, pp. 777-786, 2016.
17. “ANOVA,” Statistics Solutions. [Online]. Available:
https://www.statisticssolutions.com/manova-analysis-anova/. [Accessed: 17-may-2019].
18. Handiru, Vikram Vinod, A.P.. (2016). Optimized Bi-Objective EEG Channel Selection and Cross-Subject Generalization With Brain–Computer Interfaces. IEEE Transactions on Human-Machine Systems. 1-10. 10.1109/THMS.2016.2573827.
19. S. Burwell and E. Racine, “Ethical questions raised by brain-computer interfaces,” BMC Series blog, 18-Dec-2017. [Online]. Available:
https://blogs.biomedcentral.com/bmcseriesblog/2017/12/18/ethical-questions-raised-by-brain-computer-interfaces/. [Accessed: 25-May-2019].
20. T. Fuchs, “Ethical issues in neuroscience,” Current Opinion in Psychiatry, vol. 19, no. 6, pp. 600–607, Nov. 2006.
21. B. Bateman, “Challenges of Generalization in Machine Learning,” Oracle DataScience.com, 17-Sep-2018. [Online].
Available: https://www.datascience.com/blog/machine-learning-generalization. [Accessed: 03-Jun-2019].
22. B. Farnsworth, “EEG vs. MRI vs. fMRI - What are the Differences?,” iMotions, 13-Mar-2018. [Online].
Available: https://imotions.com/blog/eeg-vs-mri-vs-fmri-differences/. [Accessed: 19-May-2019].
23. James C Christensen et al. “The effects of the day-to-day variability of physiological data on operator fumctional state classification”. In: NeuroImage 59.1 (2012), pp. 57-63
24. Samaneh Nasiri Ghosheh Bolagh et al. “Unsupervised cross-subject BCI learning and classification using riemannian geometry”. In: 24th European Symposium on Artificial Neural Networks, Computational Intelligence and Machine Learning (ESANN 2016). 2016.
25. Goldberger Al, Amaral LAN, Glass L, Hausdorff JM, Ivanov PCh, Mark RG, Mietus JE Moody GB, Peng C-K, Stanley HE. PhysioBank, PhysioToolkit, and PhysioNet: Components of a New Research Resource for Complex Physioogic Signals. Circulation 101(23):e215-e220 [Circulation Electronic Pages; http://circ.ahajournals.org/cgi/content/full/101/23/e215]; 2000 (June 13)

![Figure 2.3.3 Number of estimated parameters, LDA vs QDA [14]. The black curved graph represents parameters in QDA and the red dotted line represents parameters in LDA.](https://thumb-eu.123doks.com/thumbv2/5dokorg/4264216.94418/18.892.144.561.630.932/figure-number-estimated-parameters-represents-parameters-represents-parameters.webp)

![Figure 3.3.1 Illustration of k-fold validation [15].](https://thumb-eu.123doks.com/thumbv2/5dokorg/4264216.94418/22.892.130.609.498.728/figure-illustration-of-k-fold-validation.webp)