STATENS VÄGINSTITUT - STO CKHOLM
The National Road Research Institute, 114 28 Stockholm, SwedenCHANGES IN SPEEDS OF VEHICLES ON HORIZONTAL
CURVES
by
C; Holmquist
RAPPORT Nr 104
StOckholm 1970
CHANGES IN SPEEDS OF VEHICLES ON HORIZONTAL
CURVES
by
C. Holmquist
RAPPORT Nr 104
Stockholm 1970Holmquist, C: Changes in Speeds ... l.
CHANGES IN SPEEDS OF VEHICLES ON HORIZONTAL CURVES
An essential part of the model for traffic simulation which is in prepara-tion at the Naprepara-tional Swedish Road Research Institute is a descripprepara-tion of the variations in the speeds of road vehicles during their passage through
horizontal curves.
Studies of the speed adaptation on horizontal curves have beenmade at the Road Research Institute on several occasions in the course of the period from 1965 to 1967. A common feature of these studies is that they have been carried out under left-hand traffic conditions. It was therefore desirable to examine, among other things, the effect produced by right-hand traffic on the speeds of vehicles on curves. It was to be expected that the sight from the inner lanes of the curves would be improved for vehicles equipped with steering wheels on the left-hand side, which are completely predominant in Sweden. In order to study the above-mentioned
effect, investigations have been made in 1969 at some places where similar
measurements had been performed in left-hand traffic, so that reference data were available for these places.
In the first investigations, a study was made of free-moving vehicles.
They were defined as vehicles separated by a time gap of at least 6 seconds from the vehicle ahead. The results of these investigations proved to be in close agreement with those of Taragin's tests carried
out in 1954. It was found, among other things, that the speed adaptation took place in most cases before the curve, and was then maintained constant throughout the curve. Furthermore, the difference in speed between the
vehicles moving in the inner and outer traffic lanes was very slight.
In another investigation, the variation in the Speed of each vehicle with the distance was determined by measuring the travel time over 8 consecutive road sections. This investigation was carried out on freemmoving vehicles at 25 places in Central Sweden, and covered 1 200 vehicles in all.
In the analysis of the observarions, the Speed variable, in kilometres per hour, was replaced by the travel time, in seconds per kilometre. This made
it possible to obtain a Simplified description of the relations between the variables involved in the analysis. The results of the measurements SVT. 3718.33: ort 105:L
Holmquist, C: Changes in Speeds . . . . .. 2.
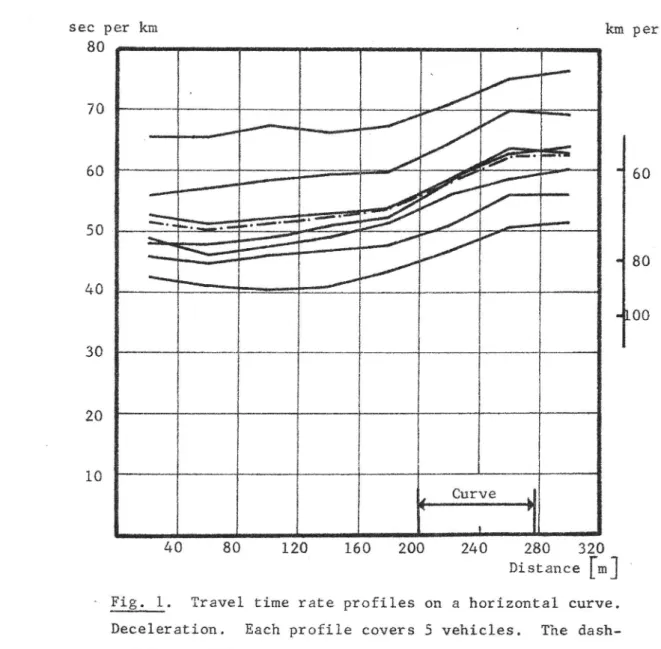
Were used to plot travel time rate profiles, and it was found that these profiles were parallel, irrespective of the initial speed of
the vehicle at the entrance into the curve.i
Fig.l shows the travel time rate profiles obtained at one of the above"
mentioned 25 places.
sec per km - km per hour'
80 0 N
/
70 W50 .
WIMML
w//Au--M
W W W / d 40 M ___/ -fOO 30 20 10 f Curve 1 140 80 120' 160 200 240 280 320 Distance [m] Fig. 1. Travel time rate profiles on a horizontal curve. Deceleration. Each profile covers 5 vehicles. The dash-and-dot profile represents the average speed.
The parallelism of the travel time rate profiles in fig. 1 implies
that the travel time of a vehicle on a curve increases by an amount
which is independent of its speed. In other words, the distribution
curves of the travel time rate are subjected to a parallel diSplacement
See fig. 2. SVI Rapport 104
Pe rc en ta ge of ca rs with tr ave l ti me ra te l e s s t h a n t , ,__._____
Holmquist, C: Changes in Speeds ... 3.
Speed v km per hour
120
100 90
80
70
60
50
20
I I I I f l V" ' 80 _ Sample size i 35 cars 60 s 40 - Section 2-3 5»6 8-9 ZOr" 0. 1 L L 1 I 30 40 50 60 70 80 90Travel timerate t sec per km
Fig. 2. Distribution curves of the travel time rate
Moreover, contrary to the assumptions made by Taragin, among others,
it was found that the speed adaption did not cease at the end of the
straight road section, but continued after the entrance of the vehicle
into the curve. Studies have also been made of the variation in the acceleration of the vehicles with the distance after they left the
curve. These studies showed that the deceleration before, and the
acceleration after, the curve were mirror reflection of each other.
Furthermore, the measurements indicated that the speed was approximately
constant along a road section extending over the central part of the curve. The length of this road section was on an average equal to 1/4 of the arc length of the curve. The variation in the speed of a vehicle passing a curve can be represented in an idealised form by the travel
time rate profile shown in fig. 3. '
For cars, the Speed level, to, (the maximum.travel time rate) on a
curve with good visibility and without speed limits, was found to be
. . , x . . .
closely correlated Witn tne degree of curvature ) The relation obtained
for the mean value of tO was
E'
0 = 1,5 D + 36 sec per kmx) The degree of curvature is defined as the centre angel of a Circular
arch which is limited by a 100 feet Chord.
Travel time rate sec/km Maximum travel time rate on curve 'C 1 e Approach travel time rate tl *wmmüummwmsuu Con- Acceleration stant Speed Deceleration
;e L/4
Distance [En]
Fig 3. Travel time rate profile. Idealised behaviour on a
horizontal curve.
The speed level, tl, (the approach travel time rate) on the attached parts
of the road has been calculated on basis of an another investigation made
The mean value of tl was at the Institute.
't = 27 + 62/(K-2,5) sec per km1
where K is the width of the road, in m.
In addition, the results obtained from the measurements at the 25 sites
of observation showed that the variations in the deceleration and in the acceleration correSponded to approximately linear travel time rate
profiles (See fig 3). The slope, k, of these linear profiles was
calculated from the formula
nu..
/k 2 0,27 to .. 7,8
The increase in the travel time caused by the curve is represented in fig. 3 by the area of the surface which is bounded by the travel time rate profile and by the dash line. This surface area can be calculated
Holmquist, C: Changes in Speeds...v 5.
when t1) tO and k are known. Tue model for the calculation of the increase
in the travel time, AT, due to tne curve is
AT=O,24-L(t ..t.,)+
O-where
AT = the increase in the travel time, in sec,
L - the length of the curve, in m,
to 3 the maximum travel timerate on the curve, in sec per km, t = the approach travel time rate, in sec per km.
The object of the measurements dealt with in the present paper was to find
simple models for the calculation of travel times. Moreover, tne results obtained from the above-mentioned investigations will be used in evolving
a first draft of a model for traffic simulation.
In the subsequent work on this subject, it is intended to devise a more precise model by studying the cumulative effect of an increased number of variables on the speed-distance relation. The data to be used for this
9
purpose will bemore extensive tnan those which have been utilised before.