School of Innovation, Design and Engineering Volvo Construction Equipment
Reducing Uncertainty in
Production System Design
through Discrete Event Simulation
A case study at
Volvo Construction Equipment
Master Thesis Work
30 credits, Advanced Level
Product and Process Development Production and Logistics
Asier Etxagibel Larra˜
naga
Julia Loschkin
Report Code: Commissioned by:
Company Tutor: Mats Jackson
University Tutors: Jessica Bruch and Erik Flores Garc´ıa Examiner: Antti Salonen
Abstract
In a market environment that is subject to continuous changes, companies need to adapt their production systems in order to maintain the competitive edge. Current literature shows that with a successful production system design, higher levels of output, efficiency and quality can be achieved.
However, designing a production system is done infrequently and therefore tends to lack experience. As a result, design decisions have to be made under uncertainty due to a lack of information, structure and knowledge. In fact, the success of a design process is directly linked to the level of uncertainty.
The purpose of this thesis is to reduce uncertainty in production system design through Discrete Event Simulation before an assembly system is implemented. Therefore, a the-oretical study was carried out defining types and sources of uncertainty in production system design. Parallel to the theoretical study, a case study in Volvo Construction Equipment Operations Hallsberg was conducted. Discrete Event Simulation was tested as a tool to reduce uncertainty in production system design.
The analysis illustrates the observed sources of uncertainty in production sys-tem design cover a process, organizational, corporate, market and cultural context. The relevant uncertainty types identified in the case study in Volvo Construction Equipment Operations Hallsberg were environmental, system, technical, structural, temporal, lack of knowledge and lack of information. The information provided by the Discrete Event Simulation in order to reduce uncertainty are in form of KPIs, process structure and visualization. The provided information had a posi-tive impact on the degree of technical uncertainties, the lack of knowledge and the lack of information. As a result, the level of uncertainty in the Volvo Construc-tion Equipment OperaConstruc-tions Hallsberg future line designing process was reduced.
Acknowledgements
Acknowledgements
We would like to express our deep gratitude to Volvo Construction Equipment Operations Hallsberg for the opportunity of developing this project. We would like to thank Mats Jackson, Tommy Karlsson and Thomas Eriksson for making the case study very enriching both academically and personally. We also thank everyone involved in the Cast Assembly Enablers project for the helpful feedback.
Many thanks to Jessica Bruch at MDH for all the constructive criticism and valu-able support received through the whole project.
And last but not least, we would like to express our special thanks to Erik Flores Garcia for the all the guidance, criticism and friendship received.
Confidentiality Clause
This thesis has been concealed by the authors at request of Volvo CE due to confiden-tiality reasons. Any inspection of this thesis by third parties will require the expressed permission of Volvo CE.
Contents
Abstract i
Acknowledgements ii
Confidentiality Clause iii
List of Figures vii
List of Tables ix
List of Abbreviations x
1 Introduction 1
1.1 Background . . . 1
1.2 Problem Formulation . . . 2
1.3 Aim and Research Questions . . . 3
1.4 Scope of the Research . . . 3
2 Research Method and Procedure 4 2.1 Research Design . . . 4
2.1.1 Case Study . . . 4
2.1.2 Simulation . . . 5
2.2 Research Process . . . 6
2.2.1 Literature Overview . . . 6
2.2.2 Production System Design Case . . . 7
2.2.3 Simulation . . . 8
2.3 Analysis . . . 13
2.4 Validity and Reliability . . . 14
3 Theoretic Framework 15 3.1 Production System Design . . . 15
3.1.1 Definition and Differentiation . . . 15
3.1.2 Production System Design Process . . . 16
3.1.3 Challenges when designing the Production System . . . 18
3.2 Uncertainty . . . 19
3.2.1 Definition . . . 19
3.2.2 Sources of Uncertainty in the Production Design Process . . . 22
3.2.3 Reducing Uncertainty in Production System Design . . . 24
3.3 Simulation . . . 27
3.3.2 Simulation in Production System Design . . . 28
4 Discrete-Event Simulation Modelling 31 4.1 Step I. Problem Formulation . . . 31
4.2 Step II. Setting Objectives . . . 31
4.3 Step III. Conceptual Model Formulation . . . 32
4.4 Step IV. Data Collection . . . 32
4.4.1 Line disturbance data . . . 33
4.5 Step V. Model Translation . . . 34
4.6 Steps VI and VII. Model Verification and Validation . . . 34
4.6.1 Results of Current State Simulation . . . 35
4.7 Step VIII. Experimental Design . . . 37
4.7.1 Future State Phase 1: One line concept . . . 38
4.7.2 Future State Phase 2: Volvo CE Operations Hallsberg scenario modelling . . . 38
4.7.3 Assumptions made for the Future State . . . 40
4.8 Steps IX and X. Simulation Runs and Analysis . . . 40
5 Empirical Findings 41 5.1 Company Introduction . . . 41
5.2 The CAST Assembly Enablers Project . . . 41
5.2.1 Future Production System . . . 43
5.3 Product Description . . . 43
5.4 Current State Description . . . 44
5.4.1 Production Process Description . . . 44
5.4.2 Characteristics of the Current State Assembly System . . . 45
5.4.3 Working with Production System Design . . . 46
5.4.4 Justification of the difference in the real and simulated output . . . 47
6 Analysis 50 6.1 Research Question 1: Types of Uncertainties . . . 50
6.2 Research Question 2: Sources of Uncertainty . . . 53
6.3 Research Question 3: Information provided by Discrete Event Simulation . 57 6.3.1 Simulation modelling outcome . . . 57
6.3.2 Information provided by Discrete Event Simulation . . . 60
6.4 Research Question 4: Types of Uncertainties that can be dealt with through Discrete Event Simulation . . . 62
7 Conclusions and Recommendations 66 8 Bibliography 68 9 Appendices 73 9.1 Cycle times . . . 73
9.2 Conceptual Models . . . 74
9.3 Disturbances . . . 77
9.3.1 Current State disturbance tables . . . 77
9.3.2 Current State histograms . . . 77
Contents 9.4 Total Assembly Distributions . . . 79
Figure 2.1 Applied Research Process . . . 6
Figure 2.2 The simulation modelling process (Banks, Carson, Nelson and Nicol, 2005) . . . 10
Figure 3.1 Elements in a production system (Bellgran and S¨afsten, 2010) . . . 16
Figure 3.2 Typical activities carried out when designing the production system (Bruch, 2012) . . . 17
Figure 3.3 Sources of uncertainty (De Weck Olivier, John et al., 2007) . . . 23
Figure 3.4 Uncertainty versus available information in the design process (Rajabalinejad and Spitas, 2011) . . . 25
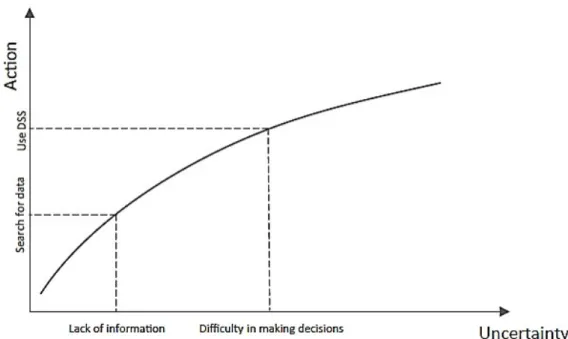
Figure 3.5 Uncertainty versus the action to address the uncertainty in problems and the use of decision support tool (DSS) (Rajabalinejad and Spitas, 2011) 26 Figure 3.6 Tools to deal with uncertainty in the design timeline (Rajabalinejad and Spitas, 2011) . . . 26
Figure 4.1 Structure of the Verification and Validation of the Current State Simulation . . . 35
Figure 4.2 Distribution total cabs assembled yearly . . . 36
Figure 4.3 Normal curve of the total cabs assembled distribution . . . 37
Figure 4.4 Average Lead Time Distribution . . . 37
Figure 4.5 Simulation of Future State: Phase and Scenario Description . . . . 37
Figure 5.1 CAST project time plan . . . 42
Figure 5.2 Structure of the CAST Assembly Enablers Project . . . 42
Figure 5.3 Cab produced at Volvo CE Operations Hallsberg . . . 44
Figure 6.1 Relevant uncertainties in production system design . . . 53
Figure 6.2 Observed sources of Uncertainty . . . 56
Figure 6.3 Information provided by DES to reduce uncertainty in production system design . . . 61
Figure 6.4 Degree of impact on the types of uncertainty by using DES . . . 65
Figure 9.1 Conceptual Model of the current Cab A/Cab D Assembly Line . . . 74
Figure 9.2 Conceptual Model of the current Cab B Assembly Line . . . 75
Figure 9.3 Conceptual Model of the current Cab C Assembly Line . . . 76
Figure 9.4 Histogram of total disturbances of the current Cab A/Cab D as-sembly line . . . 77
Figure 9.5 Histogram of total disturbances of the current Cab B assembly line 77 Figure 9.6 Histogram of total disturbances of the current Cab C assembly line 78 Figure 9.7 Histogram of the total cabs assembled in the current Cab A/Cab D assembly line . . . 79
List of Figures Figure 9.8 Histogram of the total cabs assembled in the current Cab B assembly
line . . . 79 Figure 9.9 Histogram of the total cabs assembled in the current Cab C assembly
2.1 Key words used and their resulting number of hits . . . 7
2.2 Data collected for the DES study . . . 8
2.3 Classification of the data gathered . . . 11
3.1 Types of Uncertainty . . . 21
3.2 Model types summary (Wu, 1994, p. 219) . . . 28
4.1 Assumptions made for Step V. Model Translation . . . 34
4.2 Results of the Validation of the Current State. . . 36
4.3 Cycle Times used for the Future State Phase 2 Scenarios . . . 40
5.1 Number of stations, operators and total work content of the three assembly lines . . . 45
5.2 Evaluation of the possible explanations of the Output Difference . . . 48
5.3 Difference in the Output between the real system and the simulation with and without the rule of thumb. . . 49
6.1 Types of Uncertainty that were observed during production system design 51 6.2 Comparison of the total amount of Operators (Current State versus Future State Phase 1) . . . 57
6.3 Comparison of the total cabs assembled (Current State versus Future State Phase 1) . . . 58
6.4 Comparison of the Lead Time (Current State versus Future State Phase 1) 58 6.5 Comparison of the total cabs assembled of Future State Phase 2 Scenarios 58 6.6 Average Lead Time comparison of the Future State Phase 2 Scenarios . . . 59
6.7 Justification of the total Cabs assembled in Future State Phase 2 . . . 59
6.8 Types of Uncertainty that can be reduced with DES . . . 63
9.1 Current State cycle times . . . 73
9.2 Negative Binomial Disturbance Distribution for the current state of the Cab A/Cab D assembly line . . . 77
9.3 Triangular Disturbance Distribution for the current state of the Cab A/Cab D assembly line . . . 77
9.4 Negative Binomial Disturbance Distribution for the current state of the Cab B assembly line . . . 77
9.5 Triangular Disturbance Distribution for the current state of the Cab B assembly line . . . 77
9.6 Negative Disturbance Binomial Distribution for the current state of the Cab C assembly line . . . 77
9.7 Triangular Disturbance Distribution for the current state of the Cab C assembly line . . . 77
List of Tables 9.8 Allocation of Disturbances into 33 stations . . . 78 9.9 Negative Binomial Disturbance Distribution for the Future State Phase 1 . 78 9.10 Triangular Disturbance Distribution for the Future State Phase 1 . . . 78 9.11 Allocation of Disturbances into 20 stations . . . 78 9.12 Negative Binomial Disturbance Distribution for the Future State Phase 2
Scenario 1 . . . 78 9.13 Triangular Disturbance Distribution for the Future State Phase 2 Scenario 1 78 9.14 Allocation of Disturbances into 20 stations with New Product . . . 78 9.15 Negative Binomial Disturbance Distribution for the Future State Phase 2
Scenario 3 . . . 78 9.16 Triangular Disturbance Distribution for the Future State Phase 2 Scenario 3 79
List of Abbreviations
Cab A . . . . Product A of Volvo CE Cab B . . . . Product B of Volvo CE Cab C . . . . Product C of Volvo CE Cab D . . . . Product D of Volvo CE
CAST . . . . Common Architecture Shared Technologies CES . . . Continuous Event Simulation
DES . . . Discrete Event Simulation KPI . . . Key Performance Index MDH . . . M¨alardalen University
NP . . . New Product introduced by Volvo CE in the Future State TBF . . . Time Between Failure
1 Introduction
1 Introduction
1.1 Background
When two or more companies interfere with each other seeking the same objective, typi-cally using some common resources, competition occurs (Pianka, 1981). Competitiveness therefore is a key factor that firms need to handle in order to gain (and retain) the upper hand in the market (Narver and Slater, 1990).
Because of the changing nature of the market needs, companies need to adapt continu-ously in the same way (Narver and Slater, 1990). Firms are directly linked to their environ-ment when performing their operations, as they need to satisfy it’s demand (e.g. customer orders) by using resources from it (e.g. money, material and labour)(Ruffini, 1999). In line with the above, the chief executive of General Motors Dan Akerson said: ”Every corporation has to change, or it dies. You lose your competitive edge.” (Durbin and Kr-isher, 2011). Hence, firms not only need to grow and evolve in the same way as the mar-kets do, but they also need to maintain a competitive edge (Bennett and Forrester, 1993). However, competition is no longer limited to local challenges, but spread to a global level, setting high product standards (Wu, 2001). Therefore, simultaneous local and global competitiveness can only be achieved by satisfying customer requirements, that imply reducing overall costs, improving product and service quality and reliability, effectively handling fluctuations of the demand and satisfying special customer requests and orders (Bennett and Forrester, 1993).
Those requirements have to be adopted by the current production system in order to retain competitiveness. Two approaches have been proposed to confront these challenges: either by controlling and improving the key parameters of the existing production, or by effectively designing a production system capable of handling changes (Bennett, 1986). In this manner, Bennett (1986) argued that too much effort is spent on controlling current parameters of a production, even if the former would bring greater success:
”As industrial competition increases, it becomes more apparent that improved levels of output, efficiency and quality can only be achieved by designing better production systems rather than by merely exercising greater control over the existing ones.”(Bennett, 1986, p. 1)
Therefore, if companies want to design successful production systems, they need to pay extra attention in the early stages of the design process (Bellgran and S¨afsten, 2010). During the period when an idea is first considered and a concept is judged ready for imple-mentation, design decisions need to be taken, where several alternative system solutions may be elaborated (Kim and Wilemon, 2002). In order to find the most suitable one, these concepts have to be compared against each other considering core criteria (Bellgran and S¨afsten, 2010). However, given that production system design itself is done infre-quently, it tends to require increased time, structure and experience (Krajewski, Ritzman and Malhotra, 2013). A structured approach dealing with production system design is
recommended (Bellgran and S¨afsten, 2010; Suh, 2005), but empirical findings indicate that companies react in fire-fighting manner (Wu, 2003), showing a gap between theory and practise in actual Production System Design application (Wu, 2003). Consequently, early-stage design decisions need to be made under a given lack of information, structure and experience.
1.2 Problem Formulation
When facing the production system design, real-world companies usually have one pre-dominant possible solution in the decision making process, usually originated from cor-porate strategies or even particular engineering guesses. In any case, as in any other decision making process, there is always the doubt whether the possible solution is the right one or not. The lack of knowledge about the consequences of the solution, coupled with the lack of information, structure and experience of the design phases, makes the design difficult and reduces the feasibility to design the best possible outcome (Bellgran and S¨afsten, 2010).
This knowledge gap between the information needed to formulate a well founded so-lution and the information that the designers have is defined as uncertainty (Galbraith, 1973). After all, such uncertainty is mainly caused by either the lack of experience of the company in the field of the solution evaluated or the lack of information of the so-lution caused by the system complexity (Suh, 2005). Complexity can be originated by a lack of understanding of the structure and behaviour of the future process (DeToni and Tonchia, 1998; Efthymiou, Pagoropoulos, Papakostas, Mourtzis and Chryssolouris, 2012) or an inability to predict all the variations of the future system (ElMaraghy, Kuzgunkaya and Urbanic, 2005). In any case, uncertainty in production system design must be care-fully handled, since studies show that the success of a project is linked to the uncertainty level which can be decreased by increasing information (Daft and Lengel, 1986).
The problem arises when trying to reduce the uncertainty by gathering the information required to select the best alternative. To physically build a model or alter the existing system, in terms of information gathering, would probably be the optimum way (Kelton and Law, 2000). However, these tests could be very costly and disruptive in terms of time and money. Hence, other actions need to be carried out to gather information.
Simulation comes very handy for companies in that sense, as it allows the practitioners to model and help understandings the structure and behaviour of the possible alterna-tives (Shannon, 1998), before they are physically built. This way, tests can be carried out without disrupting company activities and allocating fewer resources than physically building the model (Banks et al., 2005).
1 Introduction
1.3 Aim and Research Questions
Since simulation may have a positive effect on the production system, this research will show how simulation, in form of Discrete Event Simulation (DES) can contribute to the reduction of uncertainty in production system design. Thus, the aim of this thesis is the reduction of uncertainty in production system design through the use of Discrete Event Simulation.
In order to full-fill this aim, this thesis will answer the following questions: 1. What uncertainties need to be dealt with in production system design? 2. What causes uncertainty in production system design?
3. What information does Discrete Event Simulation provide to reduce uncer-tainty in production system design?
4. What types of uncertainties can be dealt with through Discrete Event Simu-lation?
1.4 Scope of the Research
The theoretical framework of this thesis was narrowed down to uncertainty in a specific phase of the Production System Development, the production system design. Hence, no further phase such as implementation was studied.
This study assumed that the use of Discrete Event Simulation as an information gath-ering tool would result in an uncertainty reduction in the designing process. This implied that in this thesis no study was carried out to verify this statement.
Due to time restrictions, this thesis was narrowed down to the analysis of the main production lines of the Volvo Construction Equipment plant, in Hallsberg. This implied that all the pre-assemblies that supply the main production lines were not analysed for the purposes of this thesis. In the same manner, the material handling was out of the scope.
All the data, including times, measurements and schedules was provided by the com-pany, thus, no deeper evaluation on the validity of such was carried out in this thesis. Moreover, due to lack of data and in order to build a representative simulation model, some assumptions were made.
The software used for building the simulation model was ExtendSim. This program was provided by M¨alardalen University, putting any kind of software alternatives study out of the scope of this project.
The purpose of the simulation study was to understand the current and future state processes, resulting into a specific comparison of the states in regard of the KPIs previously defined, which were Operator Quantity, Total Cab Assembly and Lead Times. In the same way as the theoretical framework, the simulation study finished with the design and analysis of the future state process, and thus, no implementation was carried out for the purpose of this thesis.
2 Research Method and Procedure
The scientific and systematic search for information in order to find solutions to a problem is defined as research. That includes formulating the problem and hypothesis, collecting data, analysing data and drawing conclusions in form of solutions towards the formulated problem (Kothari, 2004).
Therefore, the following chapter gives an overview of the research design by showing the applied methods of performing a case study and a DES. Moreover, the research process of the literature overview, the production design case and the DES are shown. Hereafter it is described how results were interpreted and the validity and reliability of the research study is discussed.
2.1 Research Design
Within the current literature DES is already known as a possible tool in production system design (Johansson, Skoogh, Mani and Leong, 2009). The aim of this research was to investigate how DES as a tool can reduce the level of uncertainty in production system design decisions before an assembly system is implemented. To make observations about the impact of DES, four research questions were formulated. By performing a DES conducted in a case study, observations were made and activities carried out. These activities and observations were qualitatively analysed by their effect on the observed uncertainties in production system design.
2.1.1 Case Study
By applying the case study method, questions concerning the ’how’ and ’why’ of a par-ticular unit can be investigated intensively (Kothari, 2004; Yin, 2009). By conducting a case study, choices about the amount of case studies to be adduced, the selection of an appropriate case and also the sampling has to be made (Karlsson, 2010; McCutcheon and Meredith, 1993; Meyer, 2001). Since an in-depth investigation was intended, exclusively one case in Volvo CE located in Hallsberg was picked. All models and conclusions were based on this single case study. In order to make first-hand observations, a real-time case study was selected. The chosen sample within the study was expected to be highly rele-vant to the conceptual frame and research question, particularly showing the phenomena of uncertainty in production system design, that was to be studied.
All observations made were based on a set of contemporary events within Volvo CE Operations Hallsberg over which the investigators had little control (Yin, 2009). By using multiple sources of data, details from the viewpoint of the participants were examined (Schramm, 1971). Within the case study qualitative information in the form of documents provided by Volvo CE Operations Hallsberg, interviews and observations were collected. The methodology for performing the case study followed the steps acquired by Yin (2009) that guides the investigator in the process from the problem formulation to the final conclusions by collecting, analysing and interpreting the observations made in the
2 Research Method and Procedure case study: design the case study, prepare to collect case study evidence, collect case study evidence, analysing case study evidence and reporting case studies.
Within the design of a case study the following five components have been considered (Yin, 2009): study questions, its proposition, its unit(s) of analysis, the logic linking of data to the propositions and the criteria for interpreting the findings. Therefore, current literature dealing with production system design, uncertainty and DES have been collected and narrowed down to a key topic. Gaps, open questions and loose ends of the key literature influenced the formulation of the study questions. Further, related literature around this topic has been gathered. Within the study proposition the research aim was connected with the data that could be provided by the case study.
Through interviews and observation, the data for the unit of analysis was conducted in order to answer the research questions. Therefore, the unit of analysis were the types and sources of uncertainties that have been determined within the case study, as well as the information provided from elaborated DES that helped to reduce the uncertainty. The prior literature review and the observations and interviews were compared on basis of the mentioned units. Also data needed to perform the DES was collected and the outcome of the simulation work served as a basis to the study proposition.
2.1.2 Simulation
The simulation modelling and analysis of the simulation case performed were conducted for the purpose of gaining insight into the operation of a production system and testing new concepts and systems before it’s implementation (Chung, 2004).
The simulation model was considered to be a partial model, therefore all aspects of the problem not related to it or not affecting the effectiveness of the problem solution were left out. Given the intention to build a model that would explain and capture parts of the decision making problems that are faced by decision makers in real life operational pro-cesses, this model was quantitative based (Karlsson, 2010). The quantitative model-based research implies a causal relationship of variables, meaning that a change of an input vari-able would lead to a change in the output varivari-able. Changes of the independent varivari-able lead to changes in a quantitative form of dependent variables. Due to the quantitative and causal character, the model could be used to predict the future state of the modelled process, but was not unambiguous and verifiable outside this model (Karlsson, 2010).
The quantitative model-based research can be further divided in two classes: the ax-iomatic and the empirical research (Karlsson, 2010). Since the goal of the simulation model was to fit observations and causalities of the reality and the model made of the reality, the authors chose an descriptive empirical approach.
2.2 Research Process
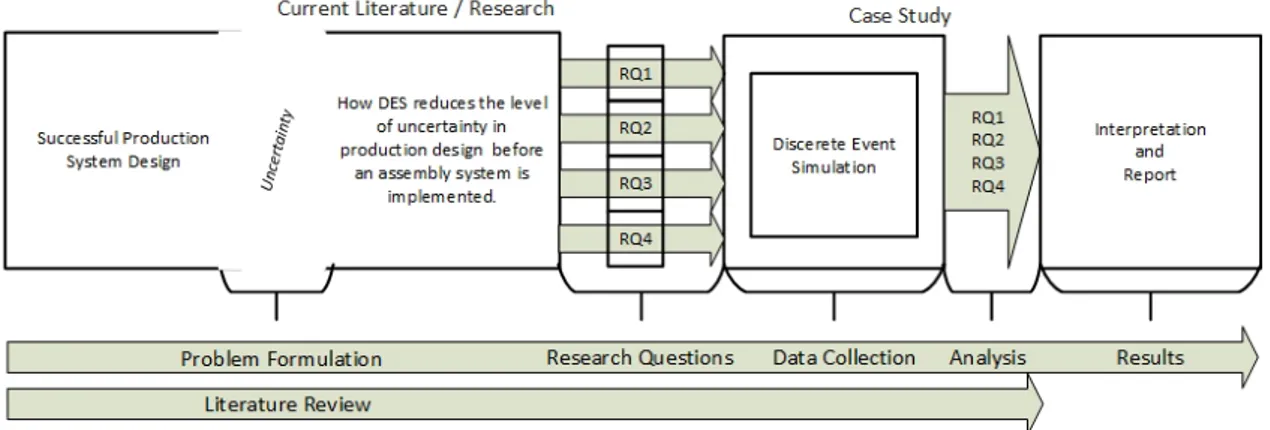
Figure 2.1 shows the research process from the problem formulation to the final results.
Figure 2.1: Applied Research Process
First, through the study of current research papers, a problem was framed addressing the gap of knowledge within this topic. In order to investigate the research aim, four research questions were formulated and a suitable case study located. Parallel to the literature review, data in the case study was collected. Based on the collected data a DES was carried out. Data of the simulation, observations and interviews were analysed and evaluated based on the problem formulation and compared to literature findings. In any case, although the process is illustrated in a sequential way, it has been iterative between literature review, data collection and analysis.
The following sub chapters show how the process of literature overview, the production design case and the simulation has been carried out.
2.2.1 Literature Overview
The literature study was divided into three main sections, covering the subjects of pro-duction system design, uncertainty and Discrete Even Simulation. First, driving factors of production development were described and then narrowed down in detail to produc-tion system design as part of the whole producproduc-tion system development. An overview of the different definitions and types of uncertainties are given. Challenges within pro-duction system design were analysed, connecting it to the topic of uncertainty as one significant challenge. Within this chapter different definitions and sources of uncertainty are presented. After giving a background, tools and strategies to manage uncertainty were presented.
Simulation was introduced as a tool to manage uncertainty. In this particular case, DES was introduced. Further advantaged of performing simulation studies and it’s applicability and types are described. Within this study a structured approach to perform a DES study was applied. Therefore the process is explained in detail later in the chapter.
The gathering of literature was performed though the web search engine for scholarly literature as Google Scholar and using databases as Discovery, DiVA and ResearchGate covering articles, books and research publications. Searched documents include literature over a span of time between the years 1985 and 2015. The emphasis was on the latest
2 Research Method and Procedure publications, though the snowball system was used to detect commonly used concepts. Therefore production system design was mainly based on the concepts developed by Bell-gran and S¨afsten (2010) and manufacturing system design by Wu (1994). The simulation approach was based on commonly used simulation and modelling process developed by Banks and Gibson (1997).
Besides the general topic of production system design and uncertainty, literature within the interface of these two topics was gathered. Table 2.1 shows the key words being used and their number of hits, considering full text search in Google Scholar. Though a great number of literature was available dealing with uncertainty and production systems, a limited amount covers the topic of uncertainty reduction in the process of production system design.
Table 2.1: Key words used and their resulting number of hits
Key words Number of hits “production system” design uncertainty 61.600 “production system design” uncertainty manufacturing 1.060
“production system design” + uncertainty 1.170 “production system design” + “uncertainty reduction” 12
“manufacturing system” design uncertainty 22.600 “manufacturing system design” + uncertainty 1.570 “manufacturing system” “design uncertainty” 49
“uncertainty in design” “production system” 56 “uncertainty in design” “manufacturing system” 33 “design uncertainty” “production system” 81 “design uncertainty” “manufacturing system” 49 “learning before doing” uncertainty manufacturing 406
2.2.2 Production System Design Case
To fulfill research aim of reducing uncertainty in production system design through the use of DES before an assembly system is implemented, a case study at Volvo CE Operations Hallsberg was performed. The information required in form of documents, interviews and observations served the purpose of performing a DES. Therefore, data was collected from the case study in order to build the simulation models and finding the types and sources of uncertainty the company is facing. First, a model representing the current state of the three analysed production lines was built referring to the year 2015 and served as a basis for further assumption when simulating the future state.
Data for the simulation study was collected from calendar week 6 to week 18 of 2016 at Volvo CE Operations Hallsberg on a regular basis of two times per week from 8:00 to 16:00. Here the simulation served as an indication what data was required. By direct observation of the three assembly lines, Value Stream Maps of the processes from Volvo CE Operations Hallsberg and interviews during every on site visit with the Line and Production Managers, a basic understanding of the assembly processes, material handling
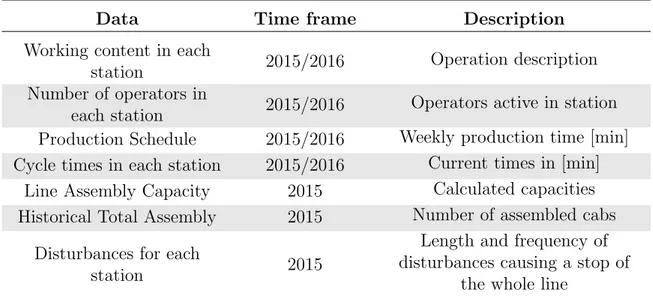
and working content for each line was acquired. Further more detailed information was gathered, shown in Table 2.2. All information in Table 2.2 was collected for each of the three studied assembly lines, using quantitative data of the year 2015.
Table 2.2: Data collected for the DES study
Data Time frame Description Working content in each
station 2015/2016 Operation description Number of operators in
each station 2015/2016 Operators active in station Production Schedule 2015/2016 Weekly production time [min] Cycle times in each station 2015/2016 Current times in [min]
Line Assembly Capacity 2015 Calculated capacities Historical Total Assembly 2015 Number of assembled cabs
Disturbances for each
station 2015
Length and frequency of disturbances causing a stop of
the whole line
Besides the on-site collection of data, regular meetings and follow-ups took place to provide feedback on the simulation model progress. Once a week the simulation progress was presented to an internal group working on related projects at Volvo CE Operations Hallsberg and milestones were presented on-site to the responsible production engineers, manufacturing engineer and line managers.
The future state layout of the production lines was developed by Volvo CE Operations Hallsberg and the CAST Assembly Enablers project group, further describes in Section 5.2. Here, during the design process the authors were passive observers.
The CAST Assembly Enablers group was composed of three units. First the Volvo CE Operations Hallsberg interns as the CAST concept owner for cab assembly deployed in the Hallsberg plant, a production engineer likewise from the Hallsberg plant and a production engineer deployed in a Volvo CE plant located in Poland. Secondly, an external consultant and third, a group composed of MDH interns as the professor for Innovation and Product Realisation, doctoral students in the fields of design of assembly systems, product realization and virtual manufacturing.
Within the CAST Assembly Enablers project group a weekly online meeting was carried out, as well as two workshops where the future concept was discussed. These workshops, the online meetings together with the observations made on-site, served as a basis for the data collection regarding types and sources of uncertainties in production system design, but also the impact of DES.
2.2.3 Simulation
Within the case study a DES was carried out. The data outcome of the simulation study was used to answer the research questions. The following lines show the method, the data collection and how data was analysed.
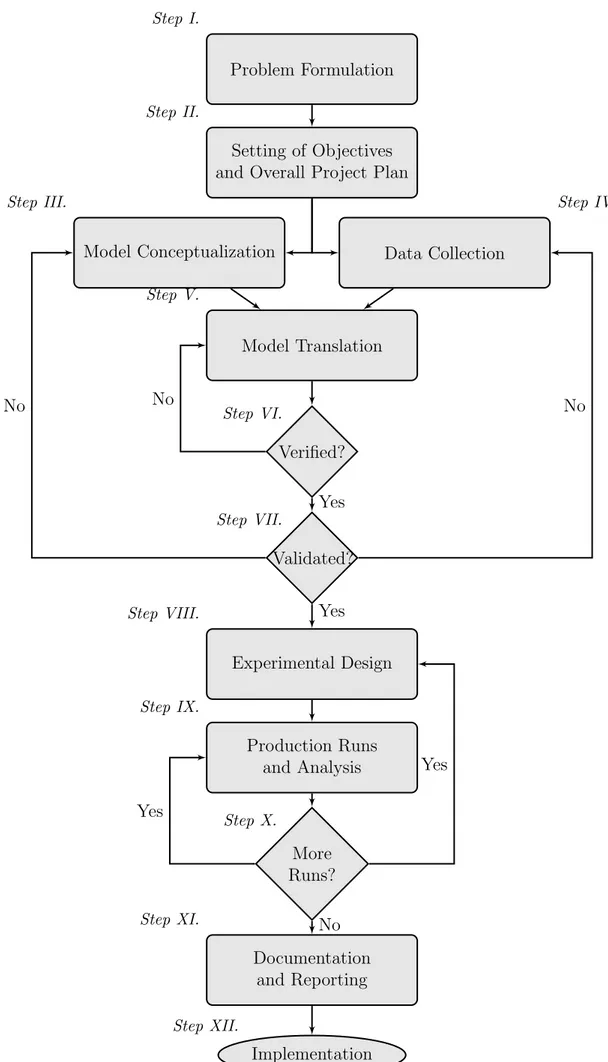
2 Research Method and Procedure The steps followed for the building of the simulation model can be seen in Figure 2.2, based in the 12-step process defined by Banks et al. (2005). Similar approaches were taken by other authors (Chung, 2004; Kelton and Law, 2000; Law and McComas, 1991; Shannon, 1998), but in all of them the core of the process remains intact.
Step I. Problem Formulation
In the first step, the problem was clearly defined and ensured that it was understood by all the parties involved in the study (Banks et al., 2005; Chung, 2004). It was very important to precisely state the problem and the questions that the simulation should answer (Shannon, 1998), since finding the right solution to the wrong problem a waste (Musselman, 1994). Meetings were carried out with the customers and the system experts, together with a presentation of the definitive problem formulation.
Step II. Set Objectives and Project Plan
After defining the problem it was decided if simulation was the right tool to solve the problem or not (Banks et al., 2005) (see 3.3.2.3). Due to the affirmative answer, the project was planned by defining some key parameters such as the people who would take part in the project, the time and the schedule of it and the overall technical goals of it (Chung, 2004; Kelton and Law, 2000; Law and McComas, 1987). Given that the current study was part of the thesis, the time and schedule of it were already defined. Regarding the goals on the other hand, they were described together with the problem formulation. Step III. Conceptual Model Formulation
In the third step, the process was graphically modelled by defining the components, describing the variables and interactions of the system (Shannon, 1998). Robinson (2014) defined a conceptual model as:
”[...] a non-software specific description of the simulation that is to be de-veloped, describing the objectives, inputs, outputs, content, assumptions and simplifications of the model”(Robinson, 2014, p. 65).
This means that the conceptual model was designed as a simplified version of the real life, and complexity was added later (Banks et al., 2005; Kelton and Law, 2000; Pidd, 1999). In this manner, the conceptual models created for the purpose of this project can be seen in the Appendices (see Chapter 9.2).
Step IV. Data Collection
In order to build the simulation model, data was first identified and gathered (Shannon, 1998) (see 2.2). The data collected consisted of a combination of historical data, anecdotal data and observational data (Chung, 2004) (see 2.3).
Problem Formulation
Step I.
Setting of Objectives and Overall Project Plan
Step II. Model Conceptualization Step III. Data Collection Step IV. Model Translation Step V. Verified? Step VI. Validated? Step VII. Experimental Design Step VIII. Production Runs and Analysis Step IX. More Runs? Step X. Documentation and Reporting Step XI. Implementation Step XII. No Yes No No Yes Yes Yes No
2 Research Method and Procedure Table 2.3: Classification of the data gathered
Data Type Data Collected Historical Data
Assembly Line Total Output Assembly Line Capacities
Line Disturbances Cycle Times of the Stations Anecdotal Data
Number of changes in the takt time per year Observational Data Number of Operators per Station / Assembly Line
Working Schedules
The data could be further classified in two different forms: deterministic and proba-bilistic (Chung, 2004). For example, in the case given the deterministic data would be the working schedule of the operators, since occurs in a predictable way. Probabilistic data would refer to the disturbances of each line, since they will not always occur with the same regularity.
In order to define the deterministic data (e.g. the distributions of the station distur-bances), the following four steps were followed, based on Banks et al. (2005):
1. Collect data from the real system of interest. The historical data regarding the disturbances of the main production lines was gathered.
2. Identify a probability distribution to represent the input process. By using histograms, the probability distributions that fit best the disturbances were identi-fied. The Negative Binomial for the disturbances below 30 minutes and Triangular for the ones above were used.
3. Choose parameters that determine a specific instance of the distribution family. In the case of the negative binomial distributions, the number of failures (s) and the probability (p) were defined, while for the triangular distributions, the minimum, maximum and the most likely values were defined.
4. Evaluate the chosen distribution and the associated parameters for the goodness of it. The disturbance distributions were validated by the production engineers in Volvo CE Operations Hallsberg.
Due to time and resource restrictions, some data was not possible to gather (Banks et al., 2005). Hence, some assumptions were made (see Table 4.1), with their respective validation process (Musselman, 1994).
All in all, this data collection step constituted an important and difficult phase in the simulation model building. Difficult because it was not always available or recorded in the form needed, and important because even if the model structure was the correct one, with inaccurate, inappropriately analysed or not environmentally representative data, the output of the simulation would not be the proper one (Banks et al., 2005).
Because of its importance, and since data collection takes a large portion of the total simulation building time, this step was carried out together with the previous step, the conceptual model building (see 2.2.3). As it can be seen in the Figure 2.2, this is a very common approach (Banks et al., 2005).
Step V. Model Translation
Once the conceptual models were built and the data was gathered, the simulation model was designed by using ExtendSim (Shannon, 1998). The model building should have the same approach as the conceptual model building (see Section 2.2.3); in the beginning the model should be simply built, and complexity would be incrementally added (Musselman, 1994).
Step VI. Model Verification
Before analysing any simulation output, it was verified that the model was operating properly (Balci, 1994; Banks et al., 2005; Shannon, 1998). The overall aim of this step simply stated was: ”Building the model right ” (Balci, 1994, p. 215). This meant that the model needed to include all the components previously specified and be able to run without any errors (Chung, 2004).
In this phase, verification of the model and white-box validation was carried out (Robinson, 1997). This two concepts might be theoretically different, but they can be performed at the same time (Robinson, 1997). After all, they both consist of micro checks. Examples of these micro checks performed for the project were timings (e.g. cycle times), control elements (e.g. station breakdowns) and control logic (e.g. scheduling of the production).
Step VII. Model Validation
Validation constituted the calibration of the model, ensuring that the output of the model was representative to the real-world system (Balci, 1994; Banks et al., 2005; Shannon, 1998). Simply stated, the aim of this step was: ”Building the right model ” (Balci, 1994, p. 215).
In addition to the previously described white-box validation two other validation tech-niques were used during the simulation building process: face validation and black-box testing. The first one consisted of subjective evaluation of the model based on experience, knowledge and intuition of the production engineers of Volvo CE Operations Hallsberg (Balci, 1994a). They reviewed the model assumptions and overall behaviour to check if the model was representative or not of the real-world system (Law and McComas, 1991). In the black-box testing on the other hand, the accuracy of the input-output transforma-tion was checked (Balci, 1994a). Different input data was given to the model, as cycle times, takt times and breakdowns, and the output was evaluated, checking whether it was representative to the real-world system or not.
Step VIII. Experimental Design
Once the model was validated, the design of the experiments or scenarios that would yield the information needed were defined (Chung, 2004; Shannon, 1998). For each alternative decisions concerning the simulation length and the number of simulation runs needed to be taken were defined (Banks et al., 2005). Following Law and McComass advice, each alternative was run hundred times, using the average output of those runs as an overall output (Law and McComas, 1991). This overall estimate should be more precise than the result of just one run, since many times random variables are used in simulation models.
2 Research Method and Procedure Step IX. Production Runs and Analysis
In the next step, the scenarios were carried out as previously designed, generating the expected data (Shannon, 1998). Analysis and interpretation of the information followed (Banks et al., 2005), where statistical techniques were needed (Kelton and Law, 2000). In the end, a comparison between the model’s output and the production engineer of Volvo CE Operations Hallsberg output estimation was done (Musselman, 1994).
Step X. More Runs?
An analysis whether it was necessary or not to perform more runs and scenarios was carried out (Banks et al., 2005).
Step XI. Documentation and Reporting
Following Musselmans (1994) guidelines, frequent reporting and documentation was used through the simulation model building process. All the input, output, assumptions and model itself was documented, in case the simulation model would be used in the future for other purposes (Kelton and Law, 2000). Regarding the assumptions, they were clearly described in order to enhance the credibility of the model (Law and McComas, 1991).
All in all, together with all the reporting and documentation, it should be possible for other analysts to conduct the same simulation study by using the same input values (Banks et al., 2005). This also makes easier for other parties to understand the model and its output.
Step XII. Implementation
The last step would be to put all the results gathered into use (Shannon, 1998). In any case, this final step was out of the scope for this project, and therefore the implementation was not reported and documented.
2.3 Analysis
The analysis was based on the data conducted within the case study and the executed simulation. Before the analysis was performed, information was gathered and filtered in order to elaborate a detailed case description. Accordingly, a data coding was performed in three steps as suggested by Miles and Huberman (1994). First, all the data that was collected through documents, observations, interviews and the outcome of the simulation study was filtered to the information that serve the purpose of answering the four research questions. Second, data was categorized into types of uncertainty, sources of uncertainty, information provided by the DES and their impact on the previous elaborated types of uncertainty. Third, the data was displayed by matching to the respective research questions.
After the data coding the analysis was performed as suggested by Eisenhardt (1989). The first step was the analysis within the case data. Here the data was processed and visu-alized by constructing arrays and displays. Within the arrays causality and explanations were elaborated.
Exclusively one case was investigated, literature in this research area was enfolded (Voss, Tsikriktsis and Frohlich, 2002). Since the literature gave a broad spectrum of different
types and sources of uncertainty, the first step was to compare the definitions in theory to the empirical findings. Also a comparison between DES literature and the executed simulation was done. The degree in which empirical and theoretical findings matched was evaluated.
After performing the DES study, the outcome of the simulation in form of predefined KPIs were compared to the real KPIs in current production. By performing different scenarios within the simulation, design alternatives were evaluated and presented to the CAST project group and Volvo CE Operations Hallsberg.
2.4 Validity and Reliability
Due to Yin (2009) four tests have been commonly used to establish the quality of an empirical social research: construct validity, internal validity, external validity and reli-ability. This tactics can also be applied to case study research as one form of empirical research (Yin, 2009; Karlsson, 2010).
Construct validity occurs during the data collection and composition strengthened by a clear chain of evidence and triangulation (Mathison, 1988; Karlsson, 2010). Here mul-tiple sources of evidence were used, as own on-site observations, interviews with distinct employees and historically by Volvo CE Operations Hallsberg recorded data. Through weekly meetings and presentation on the progress in front of different audience, review of key data was gathered on a regular basis. Since the data gathering was also performed within the CAST Assembly Enablers projects, triangulation was feasible due to employees and project members of different backgrounds.
Internal validity during the phase of data analysis is described by a causal relationships between variables and results and can be strengthen by a clear research framework, pattern matching and theory triangulation (Mathison, 1988; Karlsson, 2010). To achieve a clear research framework, how and which information leads to a decrease in uncertainty was analysed. Later on, the empirically observed patterns were compared with previous study outcomes based on theory triangulation. Therefore, already the literature study provided a broad overview on the approached topics in order to be able to compare the empirical findings to a variety of theory concepts.
Eisenhardt (1989) argues that even if there is no ideal number of cases it should be not less than four in order to generate theory and provide a good basis for analytical generalization. Since the research was based on exclusively one case, construct validity and internal validity were emphasized and triangulation with current literature performed. Further the research reliability should enable other the same insight if they conduct the study along the same steps. Therefore transparency and replicability in form of careful documentation, especially following an established step approach by Banks et al. (2005) when performing the simulation, and clarification of research procedure were enhanced. The model verifications and validation was described in detail in Chapter 2.2.3.
3 Theoretic Framework
3 Theoretic Framework
The purpose of this chapter is to describe the theoretical background that is relevant for this research study and give an overview of previous research. The chapter is divided into three parts: production system design, uncertainty and simulation. The first part gives an overview of production system design as part of Production System Development, the importance, but also challenges of production system design. The second part focuses on uncertainty as one of the challenges that has to be managed in the context of production system design. Definition, differentiation, types, sources and tools in order to handle uncertainty are described. The last part details DES as a tool in production system design. Advantages, disadvantages and the application of DES are further described.
3.1 Production System Design
3.1.1 Definition and Differentiation
Production systems, manufacturing systems and assembly systems are often used as syn-onyms, but it is important to make a distinction between these terms before enlarge upon production system design (Bellgran and S¨afsten, 2010). In general, a system is defined as a set of connected parts that operate together to produce a desired output by using definite inputs (Cochran, 1999). A system consists of many sub-systems that interact and influence the system output as a whole. All the sub-systems must act as a whole to produce the desired output (Cochran, 1999).
In that manner, a production system consist of the arrangement and operation of machines, tools, material, people and information employing a series of value adding manufacturing processes to produce a physical, informational or service product (Wu, 1994; Cochran, 1999).
Production is defined as a process of creating goods and services though a com-bination of capital, material and work (Bellgran and S¨afsten, 2010). Bellgran and S¨afsten (2010) differentiate manufacturing from production systems by an hierarchical approach: manufacturing is superior to production. Therefore, manufacturing systems contain production systems that in turn contain sub-systems as the technical system, the material handling system, the human system and the control system (Bellgran and S¨afsten, 2010; Groover, 2008). From a structural perspective, production systems cover a range of different elements that interrelate with each other, as shown in Figure 3.1.
Figure 3.1: Elements in a production system (Bellgran and S¨afsten, 2010)
When designing a system, sub-systems, elements, events and their relationships in this system have to be conceived and planned. The design of a production system can be described as
”[...] defining the problems, objectives and outlining the alternative course of action(problem-solving), and the evaluation, choices among alternatives and detailed design of proposed production systems (decision-making). The result of the design work is a description (specification) of the production system. Along with the definition of the product development process, the term produc-tion system development comprises both the design and the realisaproduc-tion of the production system” (Bellgran and S¨afsten, 2004, p. 5).
Production system design is referred the production of goods within the industrial production henceforth, where the transformation of raw material into products is carried out.
3.1.2 Production System Design Process
The organizational transformation can be a complex, dynamic, unpredictable and a chaotic process, but at the same time the need for ”[...] flexible processes that give customers what they want, when they want it, at the highest quality and affordable cost”(Liker, 2005, p. 8) confront many companies with the challenge of developing new production systems in an efficient and fast manner (Sullivan, 2004; Amagoh, 2008).
To achieve the flexibility and responsiveness demanded by the customer, a holistic ap-proach to production system design is required (Gayed, Jarvis and Jarvis, 1998). However, unlike product development, studies have shown that production system design is carried out irregularly and suffers from a lack of interest. As a result structured and systematic ways are used rarely and a holistic approach is not feasible.
The implementation of a structured way of working would counteract the overall chaotic process as introduced above and further activities can be focused, instead of spending time to plan what has to be done and in what order (Bellgran and S¨afsten, 2010).
A structure is also auxiliary in the process of decision making, as it can avail to make the decision process understandable, rational and communicable throughout the whole organization (Bellgran and S¨afsten, 2010; Cochran, 1999). In order to help industry to tackle the issues, a high amount of research has been carried out and techniques, tools and structured approaches have been developed (Wu, 2001).
3 Theoretic Framework One approach developed by Bellgran and S¨afsten (2010) shows a structured way of working with production system development that contains production system design, realization and ramp up of the production system. Below this concept is detailed, with the focus on production system design.
The production system design process is part of production system development that can be divided into five phases: management and control, preparatory design, design specification, realisation and planning and start-up. Within the production system de-velopment, production system design covers the first three phases of management and control, preparatory design and design specification. In Figure 3.2 the production system design process is summarized. The production system design process include three main phases (see Figure 3.2): the initiation, preparatory design and the detailed design leading to the final solution. Each phase can be further divided into sub phases and corresponding activities (Bellgran and S¨afsten, 2010).
The initiation phase covers the preparation of the investment based on requirements and investment decision process. In this phase the project is planned, including project management, resources, a time plan, work team composition, routines for administration and information (Bellgran and S¨afsten, 2010).
Accordingly, requirement specifications are set by performing a background and a pre-study. Here the current production system is analysed and evaluated. Production analysis and benchmarks can also be considered. Further the development and market potential, as well as requirements from interested parties, management objectives and strategies, in-formation about system factors and processes are analysed. System functions and system tasks are defined and objectives set. The elaborated requirements serve as a basis for the design specification and guide future work (Bellgran and S¨afsten, 2010).
The design of conceptual production systems deals with general questions of layout, process choice, material supply, work place design and work environment. Building a conceptual model the production designer will face and be in the need to manage com-plexity. In this phase a number of possible alternatives are elaborated. The alternatives are evaluated based on a determined method. Finally a detailed design of the chosen production system is elaborated and communication and support established (Bellgran and S¨afsten, 2010).
Figure 3.2: Typical activities carried out when designing the production system (Bruch, 2012)
3.1.3 Challenges when designing the Production System
Research provides techniques, tools and structured approaches within production system design, but there is still a gap between industry and academic perspective (Bellgran and S¨afsten, 2010). Since designing a production system is not a every day activity, estimation in form of a rule of thumb and a trial-error approach are used instead.
Chryssolouris (2013) describes this trial-error approach in two steps. First, a suitable production system is guessed. Then the performance of this system is evaluated. If the results are satisfying the process is completed, otherwise step one is repeated again. Wu (2001) researched causes for the lack of application of structured approaches in industry. He came to the conclusion that there are problems using design methodologies. Due to Wu (2001) companies lack awareness of actual application of methodologies in practise. There are also barriers within the planning and documentation of assumptions, design notes and justification. Also the manufacturing strategy formulation and analysis is considered to be difficult in practise.
When companies adapt a framework or a structure while designing the production sys-tem they are confronted with other challenges, as the structuring of their organisation to be able to apply these. Ruffini, Boer and van Riemsdijk (2000) discovered the phenom-ena related to decision making under uncertainty, when characterising the structuring of organisations. They found the importance of different roles of individuals and organised groups in the decision making process through power and politics, bounded rationality, personal preference, imperfect information, limited processing capacity of information, opportunism, satisfying behaviours and coalition forming.
Especially when studying the designing process as it is shown in Figure 3.2, it occurs that in every phase and step decisions have to be taken, starting with setting system requirements and objectives up to evaluating different system solutions. Choudhari, Adil and Ananthakumar (2010) summarized the decision areas within the production system design process into the following six:
1. Production planning and control 2. Organisation structure and control 3. Human Resources
4. Facilities 5. Sourcing
6. Process Technology
In every of this areas, decisions have to be taken by individuals or a group of people under uncertainty. Considering for example a predicted annual production volume as a basis for the production system, a change or divergence in practise in this predicted number would cause dramatic consequences in the prerequisites and accordingly in the production system itself (Bellgran and S¨afsten, 2010).
3 Theoretic Framework
3.2 Uncertainty
3.2.1 Definition
In organizational theory the uncertainty concept has been a central and historically sig-nificant aspect (Frishammar, Floren and Wincent, 2011). High dynamics and variability of current and future production paved its way into production system development, but considering the beginnings of the term uncertainty in manufacturing, sources go back to 1879 (Shenhav and Weitz, 2000). Journals and magazines like the American Machinist and the Engineering Magazine were the main trade journals, forums for discussions and sources of documentation of management practice and techniques.
As the science based industry in the middle of the 19th century emerged, companies started to pay more attention to increase their profits in higher rates than their competi-tors. To achieve these goals they had been seeking for complete control over the production processes, in mechanical and labour context. As a result, standardized parts and work-ers’ practice were introduced as a first attempt to reduce uncertainty in manufacturing (Shenhav and Weitz, 2000).
The approach of dealing with uncertainty was based on the success of mechanical engi-neers, working with technical uncertainty. Thereafter, it expanded to the organizational level. Uncertainty has been a dominant threat to all organizations on their way to achieve stability, order and efficiency (Shenhav and Weitz, 2000). A major example for uncer-tainty in the 19th century has been the labour unrest (Shenhav and Weitz, 2000).
Due to the change of market requirements these days uncertainty might not be in the form of labour unrest, but still it is present though all areas and so there are many interpretations and faces of uncertainty (Shenhav and Weitz, 2000).
The most common definition used in today’s literature and also applicable to historical development is the definition by Galbraith (1973): ”the difference between the information one has and the information one needs to complete a task.” (Frishammar et al., 2011, p. 551). Further definitions followed, as the one based on early psychology work of Daft and Lengel (1986) defining uncertainty as the absence of information. The lack of information may regard goals, alternatives and consequences (Zhang and Doll, 2001). Uncertainty can also include, besides the things that are not known, the things that are just known imprecisely (McManus and Hastings, 2005). Stochastically speaking uncertainty is defined as the inability to assign probabilities to outcomes and risks (Zhang and Doll, 2001). The overall consensus of these definition is the absence of specific information to accomplish a task. This condition is served as a basis for this paper.
Even though there is a consensus, uncertainty derives from multiple dimensions that can be categorized (Galbraith, 1973). The awareness of different types of uncertainties is major in order to apply the suitable approach to the given dimensions (Olausson and Berggren, 2010). The categorization can be performed based on distinct point of views or sources. Therefore Table 3.1 shows an overview of common types of the uncertainty phenomenon sorted by authors and date of release.
Some of the types resemble, as for example the classifications by Milliken (1987), Rowe (1994) and Lane and Maxfield (2005) which focus on market changes, its’ effects, the interpretation and response to those. The definitions provided by Gerwin (1988) ad-dresses the three areas (technical, financial and social) where uncertainties can appear. Current research conducted by McManus and Hastings (2005) and Clarkson and Eckert (2010) address the difference of uncertainties into those that are known and those that are unknown.
One of the most apparent and commonly used classification in current literature is developed by Ho (1989) who separates uncertainties into environmental and system. Some of the authors use the internal and external as a subdivision of the main classification. As an example external and internal uncertainties defined by Clarkson and Eckert (2010) can occur in product, process and organization itself (internal) and political events, in the context of product or process operates (external).
3
Theoretic
Framew
ork
Table 3.1: Types of Uncertainty
Definition Author (year) Types Description
Milliken (1987) State, Effect, Response
The state uncertainty of the environment addresses the non-understanding how components of the environ-ment might be changing. Effect uncertainty is the inability to predict the character of the future impact on the organisation. Response uncertainty in form of response options that are available and what the value of each might be.
Gerwin (1988)
Technical, Financial,
Social
Technical uncertainty refers to the difficulty in determining the precision, reliability and capacity of new processes and further if new technologies may appear and make the current equipment obsolete. Financial uncertainty covers the uncertainty whether return on investment should be the major criterion and whether returns can be forecasted properly. Social uncertainty covers questions about the nature of required support systems and possible conflicts during the implementation.
Ho (1989) Environmental, System
Environmental uncertainty refers to the production process such as demand and supply uncertainty. System uncertainty appear within the production process for example in operation yield, production lead times, quality issues, failure in production and possible changes in production structure.
Rowe (1994)
Temporal, Structural, Metrical, Translational
Temporal uncertainty addresses the future state and past tense uncertainties while structural uncertainty appears due to complexity issues, metrical within measurements and translational while explaining uncertain results. McManus and Hastings (2005) Lack of knowledge, Lack of definition
Lack of knowledge addresses facts that are not known or known just imprecisely, but are needed. Things about the system that have not been decided or specified are defined as lack of definition. Further, each of the classes can come with the following characteristics: statistically characterized random variables, known unknowns and unknown unknowns.
Lane and Maxfield (2005)
Truth, Semantic, Ontological
When it is uncertain if a statement is true or not it is defined as truth uncertainty while the uncertainty about the meaning or interpretation of the proposition is called semantic uncertainty. Ontological uncertainty depends upon the concept of actors’ ontology, therefore the uncertainty conducted by the actors’ being, becoming, relations and reality.
Clarkson and Eckert (2010)
Known, Unknown
Known uncertainty can be described as variability in past cases and can be characterized by probability distribution. The key problem here is the estimation of the known uncertainties in unique or new product and processes. Unknown uncertainties occur unexpected and can be internal or external. Both known
Reducing Uncer t ainty in Pr oduction System D esign thr ough DES
21
3.2.2 Sources of Uncertainty in the Production Design Process
Since the success of any process change depends on the level of uncertainty, particular attention needs to be paid to this issue (Rajabalinejad and Spitas, 2011). Sources of uncertainty are multitudinous and can be split into types as shown in the previous section (McManus and Hastings, 2005). Besides the categorization, sources of uncertainty have to be identified and approaches to reduce them have to be instituted (Yang, Burns and Backhouse, 2004). The importance of generating awareness of uncertainty sources is stated by Carrillo and Gaimon (2002) as following:
”From the empirical and case literature, we know that uncertainty plays a crucial role in process change strategy formulation and success. A variety of sources of uncertainty exists that impact the resources required for process change and the ultimate performance gains attained” (Carrillo and Gaimon, 2002, p. 420)
Even though the importance of uncertainty awareness is well stated in current liter-ature, there is still little research within sources, levels and tools to handle uncertainty in production system design. On the other hand, the area of product design process has been in researched largely. Since the process of designing a product and a production sys-tem are comparable, in the following research papers have been conducted dealing with uncertainty in product design processes.
Looking at the system design process, uncertainty may arises from internal and also from external sources and feature an important part for future success (Rajabalinejad and Spitas, 2011).
As summarized in Section 3.2.1 uncertainty is defined as the lack of information. Within production system design that might lead to a significant problem when proceeding to the next steps of the design process, since decisions have to be made under lack of information (Rajabalinejad and Spitas, 2011). Especially if design decisions are based on market forecasts, for instance demands, uncertainty may arise from market changes (Verworn, 2006).
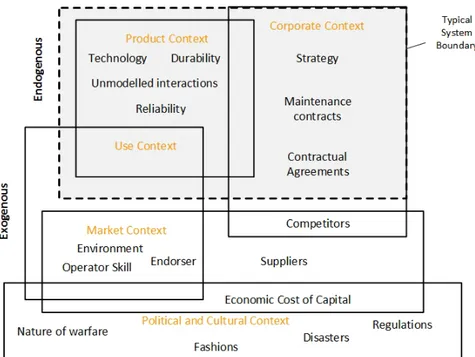
A more holistic overview illustrating sources of uncertainty within the product and system design process by De Weck Olivier et al. (2007) who based his model on the as-sumption that sources of uncertainty appear in a range of known and unknown, depending on the understanding of the issue. Figure 3.3 shows a variety of uncertainty sources and their context developed by De Weck Olivier et al. (2007).
3 Theoretic Framework
Figure 3.3: Sources of uncertainty (De Weck Olivier et al., 2007)
The dashed box in Figure 3.3 encloses the system boundary, the endogenous (internal) uncertainty. The uncertainties within this box arise from within and can be influenced by the product or system designer while the uncertainties outside the system boundary are subject to restricted influence. Besides the differentiation of endogenous (internal) and exogenous (external), sources of uncertainty can be subdivided into contexts of product, corporate, use, market and political and cultural context (De Weck Olivier et al., 2007). Each development process carries an aggravated technological risk due to the novelty of a product or process. Usually, these technical uncertainties are estimated in the beginning and resolved over the design process. Interactions between part of the system as hardware, software and humans might lead to uncertainty, due to unmodelled interaction in case of changes within the process or even occurring failures. Reliability and durability of components over its’ life cycles can also be causes of uncertainty. Within the corporate context uncertainties may arise from the business context as company strategies influence the design process (De Weck Olivier et al., 2007).
Many uncertainties are outside the companies’ direct control, arising form the market, the way the product is in operation and cultural and political influence. Especially the market environment causes a high level of uncertainty due to the degree and speed of change for example in demands and innovation (De Weck Olivier et al., 2007).
Another approach concerning sources of uncertainty in engineering system architecture is conducted by McManus and Hastings (2005). He defines empirical quantities as mea-surable properties of real world systems and categorizes seven sources of uncertainty in these empirical quantities:
1. Statistical variation: from random error in direct measurement of quantities due to imperfection of measuring instrument and techniques.
2. Systematic error and subjective judgement: due to biases in measurement apparatus and experimental procedure and key assumptions by the experimenter.