THE AgI SEEDING CLOUD IMPACT INVESTIGATION (ASCII)
CAMPAIGN 2012: OVERVIEW AND PRELIMINARY RESULTS
Bart Geerts
a, Binod Pokharel
aKatja Friedrich
b, Dan Breed
c, Roy Rasmussen
c, Yang Yang
a,
Qun Miao
d, Samuel Haimov
a, Bruce Boe
e, and Evan Kalina
ba Department of Atmospheric Science, University of Wyoming, Laramie, Wyoming 82071 USA b Department of Atmospheric and Oceanic Sciences, University of Colorado,
Boulder, Colorado 80309 USA
c Research Applications Laboratory, National Center for Atmospheric Research, Boulder, Colorado 80307, USA
d Department of Applied Mathematics, Ningbo University, Ningbo Zhejiang, 315211, PR China e Weather Modification, Inc., Fargo, North Dakota 58102 USA
Corresponding Author: Bart Geerts (geerts@uwyo.edu)
ABSTRACT.
The ASCII campaign was conducted in early 2012 over the Sierra Madre range in Wyoming, to examine cloud microphysical changes resulting from the ground-based injection of silver iodide (AgI) into shallow orographic clouds. The campaign in-cluded a dual-polarization Doppler-On-Wheels radar on the mountain pass, the University of Wyoming King Air aircraft with profiling mm-wavelength radar (the Wyoming Cloud Radar or WCR) and polarization backscatter lidar, two Ka-band profiling radars, and a number of instruments on the ground to characterize the cloud liquid water content and the in situ snow particle characteristics. The experimental design supports both simultane-ous (upstream/ downstream) and non-simultanesimultane-ous (before/ during) comparisons of snow and cloud characteristics, intended to tease out the impact of glaciogenic seeding on cloud and precipitation. This study examines the seeding impact using profiling mm-wavelength radar data only, both from the Ka-band radars on the ground (one upstream of the AgI generators and one downstream, allowing simultaneous comparison) and from the WCR (non-simultaneous comparison, i.e. untreated period followed by a treated period). Only a few good cases were encountered, as the period was drier and warmer than normal, and storms evolved rapidly. The preliminary analysis indicates that under suitable conditions AgI seeding of shallow orographic clouds can significantly increase radar reflectivity in the boundary layer.1. INTRODUCTION
Ground-based glaciogenic cloud seeding has been conducted over the mountains of southeast Wyoming as part of the Wyoming Weather Modi-fication Pilot Project (WWMPP) since the winter of 2007-08 (NCAR 2009; Breed et al. 2013). A cross-over design involving two serial mountain ranges, both with control and target snow gauges, is being used in the WWMPP randomized seed-ing experiment. Here we report on a piggy-back study that uses data from vertically-pointingmm-wavelength Doppler radars to study the cloud mi-crophysical effect of glaciogenic seeding of cold-season orographic clouds.
This piggyback study, referred to as ASCII (AgI Seeding Cloud Impact Investigation) and fund-ed by the National Science Foundation, aims to study the cloud microphysical changes resulting from the injection of AgI nuclei in orographic clouds. Several previous studies have attempted to document the cloud microphysical “chain of events”, starting with Project Whitetop (Braham 1966). A number of experiments have succeeded in documenting AgI plumes and/or microphysi-cal changes within these plumes as they disperse in orographic clouds (e.g., Super and Boe 1988; Super and Heimbach 1988; Deshler et al. 1990; Holroyd et al. 1995; Super 1999; Huggins 2007). These studies generally examine individual cases
rather than a population of storms. The results of these studies emphasize the challenges involved in ascertaining the transport and dilution of the AgI nuclei over the target area and in relating changes in liquid water content (LWC) and ice particle size distributions in cloud to seeding activity. Given the complexities of chain-of-events studies, and the statistical uncertainty of outcome-focused randomized experiments (e.g., Morrison et al. 2009), progress is most likely through measurements of cloud microphysical processes by means of instruments not available several decades ago (when most chain-of-events studies were conducted), for instance an airborne cloud radar.
Geerts et al. (2010) focus on data from such radar collected in a small ASCII pilot project. Using data from just seven research flights (~22 flight hours), each with an untreated period followed by a treated period, Geerts et al. (2010) find increas-es in radar reflectivity confined to the boundary layer (0.5-1.0 km deep) over the mountain dur-ing seeddur-ing. They also show, by means of in situ particle probes and close-range radar data, that an increase in reflectivity implies an increase in snowfall rate, for the observed range of reflectiv-ity values.
An overview of the experimental design is given in Section 2. Section 3 evaluates ambient con-ditions of all storms sampled during the 2012 ASCII campaign (ASCII_12). Section 4 exam-ines mm-wavelength radar reflectivity transects for one of the storms, and questions storm steadi-ness. A composite of these data for all storms in ASCII_12 is analyzed in Section 5, and this study’s findings are summarized in Section 6. 2. EXPERIMENTAL DESIGN
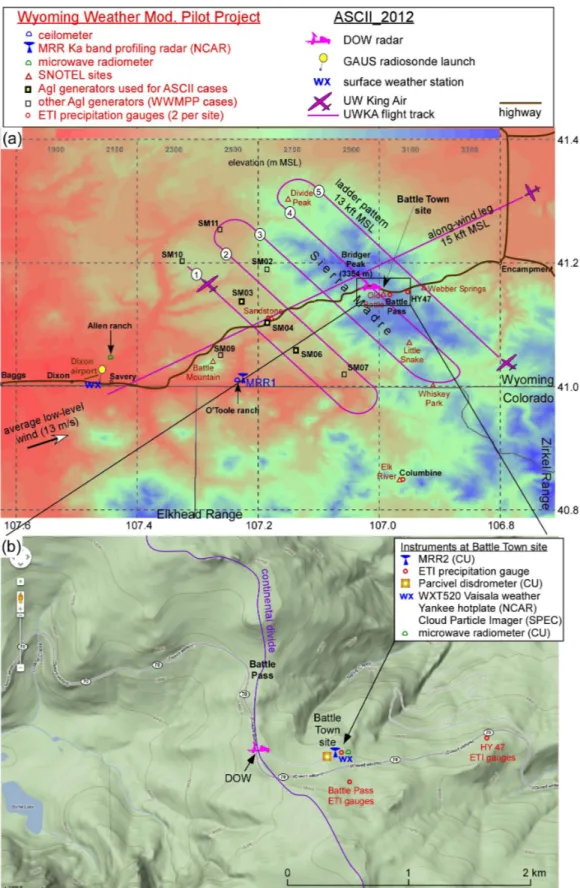
The target mountain for ASCII_12 was the Sierra Madre, a Continental Divide range in southern Wyoming (Figure 1a). This mountain was cho-sen because of suitable climatological conditions (prevailing southwesterly flow and heavy snow-fall during the months of interest, between Janu-ary and March), a high probability of significant concentrations of supercooled liquid water in
winter storms (based on passive microwave ra-diometer data collected as part of the WWMPP between 2008-11), and logistical reasons. While the Sierra Madre is remote from significant popu-lation centers and is not accessible by car in win-ter, there are some private inholdings in National Forest Service land around Battle Pass (elevation 3034 m MSL, Figure 1b). This enabled the de-ployment of a Doppler on Wheels (DOW) radar, a dual-polarization X-band truck-mounted Dop-pler radar, as well as the construction of a scaf-fold extending above the snowpack for in situ probes powered by a truck-based power genera-tor (Figure 1b). The DOW radar and one of the probes on this scaffold, the Cloud Particle Imager (CPI) from SPEC, Inc., are not designed for con-tinuous autonomous operations, therefore each Intensive Operations Period (IOP) required the presence of personnel, ferried up the mountain by snowmobile.
The challenge of any experimental evaluation of the impact of cloud seeding is natural variabil-ity at a range of time and space scales, since the experiment cannot be repeated without treatment. In ASCII_12 the emphasis was on physical evi-dence of changes in cloud and snow character-istics above the ground, rather than on changes in surface snowfall accumulation. Even these changes require a baseline comparison, i.e., “con-trol” conditions. The ASCII_12 experimental de-sign includes simultaneous, quasi-simultaneous, and consecutive controls. The simultaneous con-trol employs two fixed profiling Ka-band radars, one located ~10 km upwind of the AgI generators, and one ~20 km downwind of the generators, at Battle Pass (Figure 1). The quasi-simultaneous control involves a geographically fixed flight track upwind of the AgI generators (labeled track 1 in Figure 1a), and four flight tracks downstream of the generators, at increasing distance (fetch) from the generators (tracks 2-5). This fetch ranges from 3-21 km for wind from 226°, and becomes longer when the wind is not normal to the tracks. Track 4 covers the highest terrain, and track 5 clearly is in the lee of the mountain. Final-ly, the consecutive control generally involves a period free of AgI nuclei (referred to as NOSEED hereafter), followed by the switch-on of the AgI
26 VOLUME 45
Figure 1: ASCII experimental design map, showing UWKA flight tracks and ground-based instruments. The terrain is shown in the background, in color in (a) and using contours in (b). The highways and some place names are shown as well. Panel (b) is a zoom-in of (a) around Battle Pass, with a background ob-tained from google.com. The scale in (a) can be derived from the latitude/longitude values.
generators (referred to as SEED hereafter). The NOSEED and SEED periods are equally long. A key forecast parameter for this consecutive data collection is relative steadiness of cloud base and cloud depth, liquid water path, and upstream wind and stability during the duration of the flight. All these variables were measured, thus steadiness can be validated, but of course the atmosphere is never fully steady.
The University of Wyoming King Air (UWKA) aircraft carried in situ cloud probes, which are of limited value for the purpose of ground-based seeding signature detection, as the flight level (13 kft, the lowest permitted under instrument flight rule over the Sierra Madre, corresponding to 607 m above the highest terrain) was gener-ally too high to sample boundary layer air, and no independent tracer gas was released from the AgI generator sites. Potentially more revealing is the 95 GHz (3 mm) Wyoming Cloud Radar (WCR), a Doppler radar with fixed antennas pointing down and up from the aircraft. The nadir view provides radar data within ~30 m of the ground, whereas the commonly used ground-based scanning ra-dars can only provide measurements above the crests of complex terrain. The ability to detect changes near the ground is important because the WWMPP AgI generators are ground-based, and because a pilot project of seven flights in 2008-09 revealed that the target orographic clouds are generally rather shallow (radar echo tops 2-3 km AGL, ignoring elevated cloud layers not feeding the shallow orographic clouds, see Geerts et al. (2010)). In fact much natural snow growth tends to occur within the boundary layer (~0.5-1.0 km deep) in these conditions (Geerts et al. 2011; Chu et al. 2013).
Two profiling Ka-band (24 GHz) Micro-Rain Radars (MRRs) are used in study, one located in the upwind valley (MRR1, from NCAR), and one at Battle Pass (MRR2, from the University of Colorado) (Figure 1a). These radars are less resolved and less sensitive than the WCR, and they only provide data starting at some distance above the ground. This radar blind zone (700 and 450 m for MRR1 and MRR2, respectively) is a function of the selected gate spacing, which is
larger for MRR1 because cloud tops typically are higher upwind than above the terrain crest. But the MRR profiles allow a simultaneous compari-son. Clearly, a large part of the difference in re-flectivity profiles between the two sites is due to natural orographic precipitation growth. Of par-ticular interest, then, is the difference in the non-simultaneous comparison (SEED – NOSEED) between the treated site (MRR2) and the untreat-ed site (MRR1). The latter comparison is taken as a measure of mountain-scale natural variability. Finally, the experimental design calls for GPS-equipped radiosondes to be released at roughly hourly intervals during IOPs, from the upwind valley, at the site of an automated surface weather station (Figure 1a).
This preliminary study focuses on the data from the profiling cloud radars only. Clearly the ground-based facilities at Battle Pass are impor-tant as well in ASCII, given the shallowness of the storms and the seeding impact. Radar re-flectivity is only an integral measure of the par-ticle size distribution. The CPI probe captures particles as small as 20 micron, and CPI images are sufficiently detailed to qualitatively examine riming amounts and crystal habits (Lawson et al. 2006). The Parsivel disdrometer provides snow size distributions starting at 1 mm diameter, and the hotplate provides instantaneous snowfall rate estimates (Rasmussen et al. 2012). These datasets will be analyzed in follow-up studies.
3. TEMPERATURE, STABILITY, WIND AND CLOUD CONDITIONS DURING THE ASCII IOPS
A summary of twelve IOPs in ASCII_12 is given in Table 1. The UWKA had technical problems between 19 January and 12 February, which pre-vented its participation in three IOPs. The five across-wind tracks shown in Figure 1a constitute what we call a “ladder”. On all flights, two com-plete ladder patterns were comcom-pleted in the SEED period, and two in the NOSEED period, except on 22 February, when the last (4th) ladder pattern was aborted after completion of track 3, i.e. tracks 1 and 2 were not flown a 4th time. (The flight tracks are numbered as shown in Figure 1a).
The SEED start and end times in Table 1 refer to the period of ground-based AgI seeding. The pre-ceding NOSEED period in this table starts when the UWKA commences the first ladder pattern, and ends when the AgI generators are switched on. In one case the SEED period preceded the NOSEED period (29 Feb), with a buffer period in between. In that case the listed NOSEED period starts and ends with the UWKA starting and end-ing the ladder patterns. In all other cases, the start of the SEED period is adjusted for each flight track, and for the MRR, to account for the de-layed arrival time of the AgI plume. For simplic-ity this delay is estimated based on the average wind speed and direction between the surface and wind speed and direction between the surface and mountain top level (Table 1). The WRF Large Eddy Simulations of one of the ASCII pilot proj-ect cases, validated in Chu et al. (2013), show that plume arrival is a more complex, gradual process. The temperature was rather high in most cases (> -8 °C), in fact in 7 of the 12 IOPs, the tem-perature at 700 mb (very close to the elevation of Battle Pass) was too high for a WWMPP case, which uses a threshold 700 mb temperature of -8 °C (Breed et al. 2013). A cloud base temperature significantly above -8 °C, and limited vertical mixing, may render AgI seeding ineffective, as the AgI activation (measured as the number of crystals yielded per gram of AgI) increases by 2.5 orders of magnitude between -6 and -10 °C (De-Mott 1997). The De(De-Mott (1997) study refers to aerosols generated using airborne wing-tip burn-ers, but its results can be generalized to ground-based burners used in the WWMPP, as the AgI solution vaporized in the WWMPP burners is the same as the one tested in DeMott (1997) (Super et al. 2010). Thus the seeding effectiveness for the warmer ASCII cases (700 mb temperature as high as -3 °C, Table 1) may depend strongly on the planetary boundary layer (PBL) mixing depth. The low-level Brunt-Väisälä frequency N up-stream of the target mountain, a measure of the static stability or stratification of the air ap-proaching the mountain, was rather low (< 10-2 s-1 in all but one case) (Table 1), compared to typical winter conditions in the western US (e.g.,
Mar-witz 1987; Medina et al. 2005). None of the days experienced inversions below mountain top, and the low-level wind upwind of the range was rath-er strong (> 10 m s-1) during most IOPs (Table 1). Strong winds and low stability favor a deep PBL, in which ground-released AgI nuclei can be mixed by turbulence. Geerts et al. (2011) used WCR data from the ASCII pilot flights to show that this turbulence can be observed in the high-resolution WCR vertical velocity data. In ASCII the turbulent mixing depth along the flight tracks upwind of the mountain crest averaged between 450-740 m for the nine IOPs with UWKA (Table 1). The overall average mixing depth (~600 m) in ASCII_12 over the Sierra Madre was ~200 m less than the seven-flight average over the Medi-cine Bow Range located to the east of the Sierra Madre (Geerts et al. 2011), and the PBL top was often less defined in ASCII_12. This is consistent with the higher average wind speed observed on the seven flights over the Medicine Bow Range. Mixing depth is important for effective AgI nu-clei dispersion into orographic clouds, and for natural and modified snow growth. In the rela-tively warm cases mixing depth is important also to ensure sufficiently low temperatures near the PBL top over the mountain.
Typically strong winds and low stability in ASCII_12 imply typically high Froude number (Fr) values, although a broad range of values was encountered (Table 1). We calculate the Froude number from upwind sounding data, between the surface and mountain top level. The lowest Fr value was 0.9 during the 13 February flight. In all but two IOPs Fr ≥ 1.0, and in all but four IOPs Fr ≥ 1.7. In general, Fr > 1 implies flow over (rather than around) the mountain, a nec-essary condition for natural and enhanced oro-graphic snowfall. The upwind airmass remains trapped in the upwind valley when Fr << 1. The fixed flight tracks were designed such that AgI plumes from the three main generators would be fully advected by the low-level winds between 215-290° (Figure 1a). In ASCII the prevailing low-level wind direction ranged between 237-283° (Table 1).
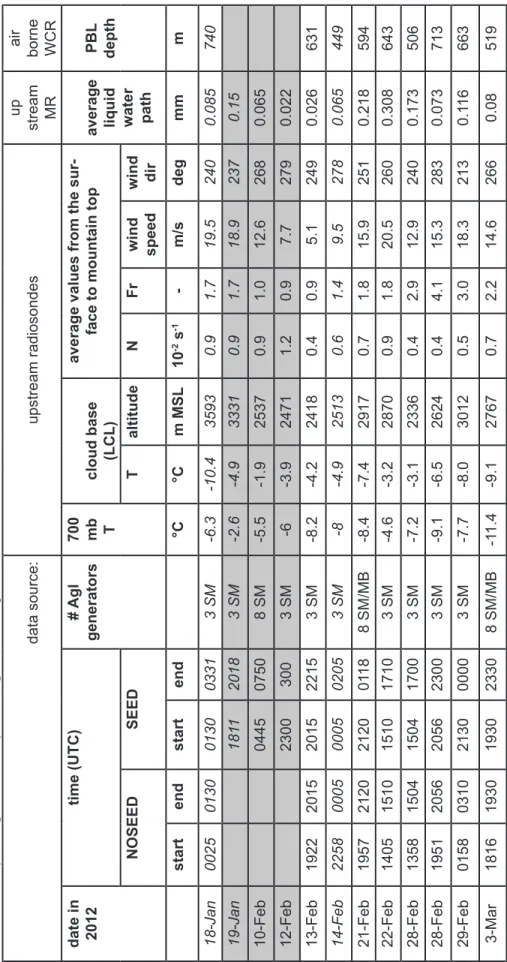
Table 1: Summary of the upstr eam envir onment for the 12 ASCII_12 IOPs. The number of AgI generators activated was either thr ee (shown in bold in Fig. 1a) or eight (all generators over the tar get range). The UWKA did not participate in the thr ee IOPs highlighted in gr ey . Insufficient MRR data wer e available to assess seeding impact for the thr ee IOPs in italics. Most information in this Table is derived from a series of radiosondes released from Dixon (Fig. 1a), during the IOPs. Average values ar e shown, based on 3-4 soundings. The Brunt-Väisälä frequency N is the dry (moist) value below (above) the cloud base (LCL). The Fr oude number Fr is calculated as the wind speed divided by N and the height of Medicine Bow Peak above Saratoga. The elevation of the thr ee generators ranges between 2431-2551 m, Battle Pass is at 3034 m (~700 mb). The LWP in the penultimate column is inferr ed from a dual-fr equency passive micr owave radiometer (MR), located at Savery (Fig. 1a), but with an antenna pointing such that it captur es clouds in the dir ection of the Sierra Madr e’s highest point, Bridger Peak (elevation 3354 m). This slant path is converted to a zenith one, i.e. it repr esents the vertically integrated liquid water . The PBL depth in the last column is the depth of the turbulent layer estimated from the WCR
vertical velocity along tracks 1-4, following the technique in Geerts et al. (201
1). data source: upstream radiosondes up stream MR air borne WCR date in 2012 time (UTC) # Agl generators 700 mb T cloud base (LCL)
average values from the sur
-face to mountain top
average liquid water path PBL depth NOSEED SEED T altitude N Fr wind speed wind dir start end start end °C °C m MSL 10 -2 s -1 -m/s deg mm m 18-Jan 0025 0130 0130 0331 3 SM -6.3 -10.4 3593 0.9 1.7 19.5 240 0.085 740 19-Jan 181 1 2018 3 SM -2.6 -4.9 3331 0.9 1.7 18.9 237 0.15 10-Feb 0445 0750 8 SM -5.5 -1.9 2537 0.9 1.0 12.6 268 0.065 12-Feb 2300 300 3 SM -6 -3.9 2471 1.2 0.9 7.7 279 0.022 13-Feb 1922 2015 2015 2215 3 SM -8.2 -4.2 2418 0.4 0.9 5.1 249 0.026 631 14-Feb 2258 0005 0005 0205 3 SM -8 -4.9 2513 0.6 1.4 9.5 278 0.065 449 21-Feb 1957 2120 2120 01 18 8 SM/MB -8.4 -7.4 2917 0.7 1.8 15.9 251 0.218 594 22-Feb 1405 1510 1510 1710 3 SM -4.6 -3.2 2870 0.9 1.8 20.5 260 0.308 643 28-Feb 1358 1504 1504 1700 3 SM -7.2 -3.1 2336 0.4 2.9 12.9 240 0.173 506 28-Feb 1951 2056 2056 2300 3 SM -9.1 -6.5 2624 0.4 4.1 15.3 283 0.073 713 29-Feb 0158 0310 2130 0000 3 SM -7.7 -8.0 3012 0.5 3.0 18.3 213 0.1 16 663 3-Mar 1816 1930 1930 2330 8 SM/MB -1 1.4 -9.1 2767 0.7 2.2 14.6 266 0.08 519
30 VOLUME 45 4. DETECTING THE SEEDING
EFFECT: A CASE STUDY
4.1 Upwind atmospheric structure, and
storm steadiness during the IOP
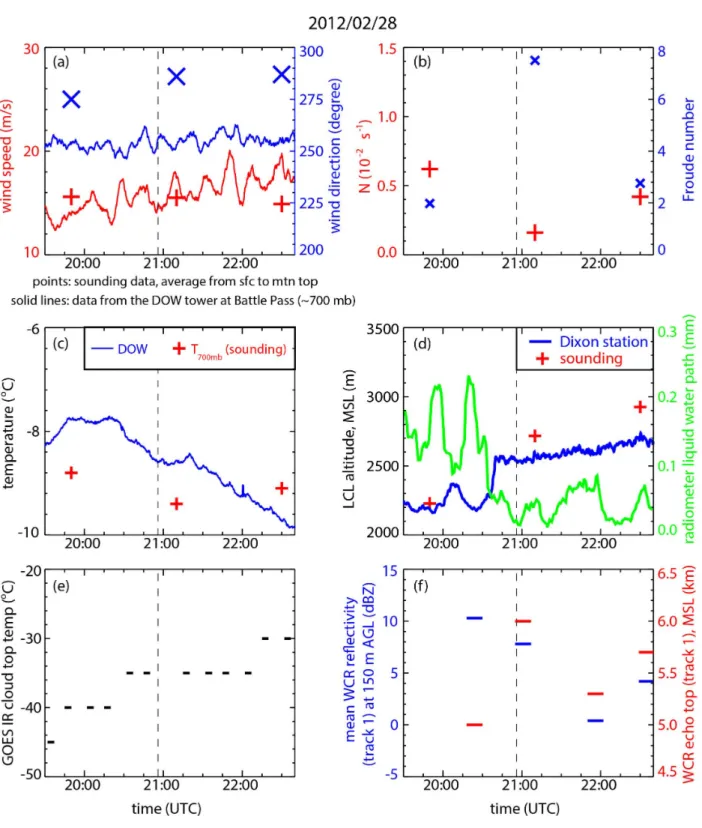
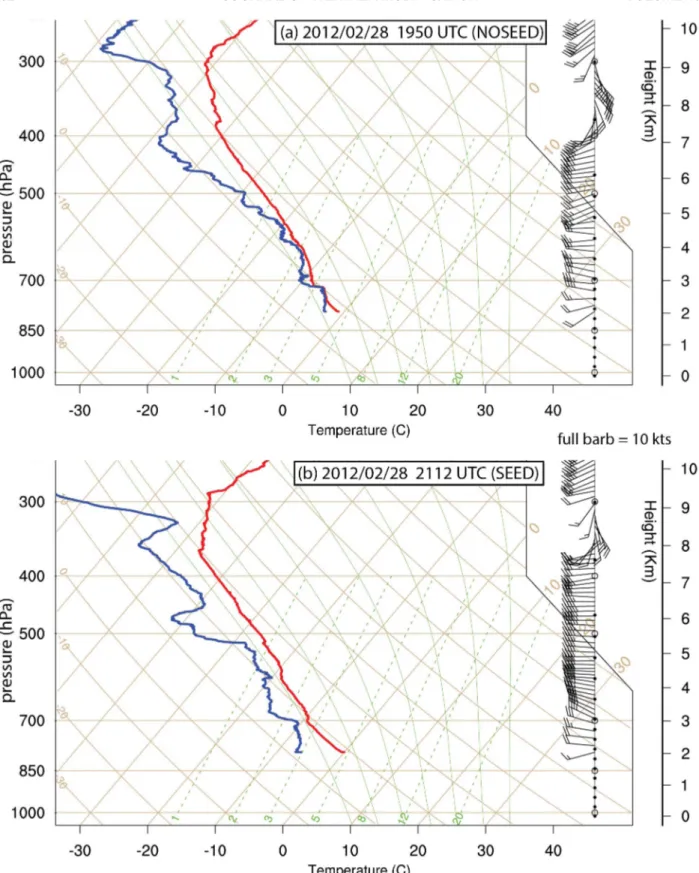
We illustrate ASCII observations by means of the second IOP on 28 February 2012. This case is selected not because it was the “best one” (the seeding signature is most apparent for the 21 Feb-ruary IOP, which will be the subject of a separate study), but rather because it nicely demonstrates the challenge of extracting a seeding signal from a noisy background of natural variability. We focus on the profiling cloud radar data. A more in-depth analysis using DOW and in situ ground sensors is beyond the scope of this survey. A deep upper-level trough extended south to New Mexico in the afternoon of 28 February 2012, and a 850 mb lee cyclone was present over eastern Colorado. Widespread light precipitation occurred during the UWKA flight (according to imagery from two distant National Weather Service radars, in Riverton and Cheyenne, Wyo-ming), although it decreased towards the end of the flight as the upper-level cloud shield drifted off to the east, according to GOES infrared data. According to three soundings from Dixon (Fig-ure 1a) during the course of the UWKA flight over the Sierra Madre (1951-2300 UTC), the 700 mb temperature dropped from -8.3 to -9.7 °C (Figure 2), and the precipitable water (verti-cally integrated water vapor) decreased by 19%. The cooling and drying of the upstream lower tro-posphere from the NOSEED to the SEED period can be seen in the soundings (Figure 3). The low-level atmospheric stability was low (N ~ 0.4 10-2 s-1) and decreased slightly, and the mean westerly wind through Battle Pass increased in strength from 13 to 17 m s-1. The surface-to-mountaintop Froude number Fr was larger than 2.0 in the three soundings, suggesting transport of the full upwind low-level airmass over the Continental Divide range (no blocking).
The average liquid water path (LWP) (0.07 mm) was below the average value for all IOPs (0.12 mm) and decreased during the flight, according
to a passive microwave radiometer located near Dixon (Fig.ure2). The LWP is estimated from two microwave frequencies (23 and 31 GHz), and the typical surface pressure and temperature & hu-midity profile (Ware et al. 2003). This technique compares rather well with independent measure-ments (Crewell and Löhnert 2003). These rather low values could be attributed to the wind which was from the WNW, yielding some subsidence along the radiometer’s angle of view. Snow fell continuously at Battle Pass, but the WCR low-level reflectivity along track 1 (upwind of the AgI generators) decreased during the flight. The WCR echo top along track 1 remained rather steady, but the GOES infrared temperature increased ~10K, implying cloud top descent (Figure 2).
In short, changes did occur during the course of this IOP, but they were rather small compared to those during other IOPs. In particular, reflectiv-ity upwind of the AgI generators decreased dur-ing the IOP, accorddur-ing to the WCR, MRR and DOW radars, and upwind LWP decreased, i.e. the orographic cloud thinned and precipitation dwindled. This IOP satisfied the WWMPP seed-ing criteria, i.e., it was sufficiently cold with T < 8 °C at 700 mb, the wind direction was westerly, and supercooled water was present in orographic clouds, according to the microwave radiometer, and several flight-level probes.
4.2 Cloud radar reflectivity profiles
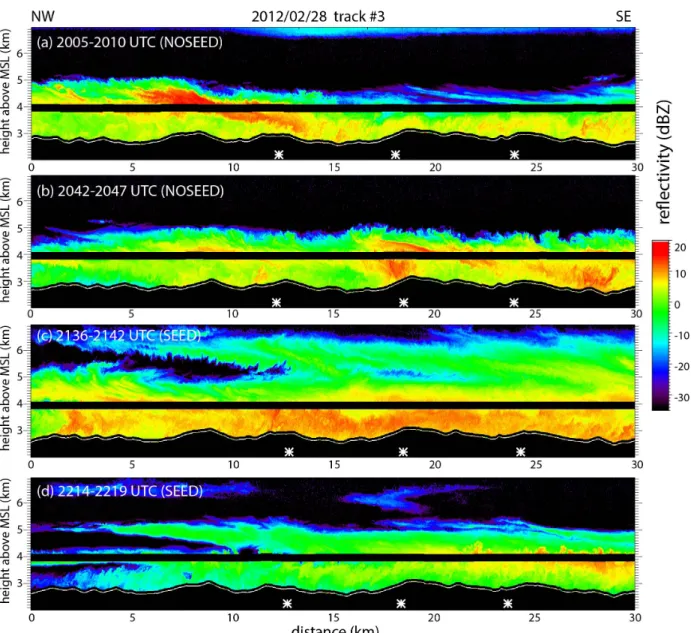
The first conclusion to draw from the WCR reflec-tivity transects, some of which are shown in Fig. 4, is that this storm was remarkably shallow, no more than ~2 km above the terrain. The reflectiv-ity transects also show that snow fell quite steadi-ly over the mountain (no gaps between echoes), i.e. precipitation was stratiform in this IOP. An upper-level cloud layer (above 6 km MSL) was evident in the western WCR transects during the first two ladder patterns (Figure 4a), but it thinned and eventually vanished, consistent with GOES IR imagery (Figure 2e). Natural seeding from this upper-level cloud (present between 2005-2047 UTC) onto the shallow orographic cloud never occurred, according to the WCR profiles. The transects in Figure 4 come from track #3,
lo-Figure 2: Evolution of several atmospheric parameters during the course of the second IOP on 28 Febru-ary 2012, as measured by radiosondes, weather stations in the upwind valley and on the mountain, WCR, and satellite.
Figure 3: Data from radiosondes launched at Dixon WY (Fig. 1a) plotted on a skew T log p for (a) NOSEED and (b) SEED conditions.
cated 11 km downwind of the line of three AgI generators (Figure 1a). This distance is measured normal to the flight legs; during this IOP the wind direction was such that the advection distance was ~19 km, implying some 22 minutes for the AgI nuclei to act on the cloud. (This assumes the mean wind between the surface and mountain top, see Table 1). The storm’s decay towards the end of the flight is apparent in Figure 4d.
The projection of the three AgI plumes onto the flight track is shown in all panels of Figure 4. Clearly the impact of AgI seeding is not imme-diately evident in the W-band reflectivity: there are no regions of enhanced reflectivity downwind of the generators in Figure 4c, d. In the Rayleigh regime reflectivity (Z) increases are largely due to the growth of the few largest particles (Z~D6, where D is the particle’s diameter) in the
popula-Figure 4: Example UWKA radar reflectivity transects, collected along flight track #3 (popula-Figure 1a) on 2012/02/28. The upper two panels apply to the NOSEED period, the lower two panels to the SEED period. The underlying terrain is in black. The black belt near 4 km MSL is the radar blind zone for the zenith and nadir antennas. The white stars are the projected locations of the AgI generators (11 km into the page) onto this transect, assuming the mean wind direction between Dixon and mountain top level (Table 1). The wind component along these transects is from left to right (Figure 3).
tion. But at W-band (i.e., 3 mm wave length) scat-tering from large hydrometeors (larger than about 800 micron) scatter in the Mie regime. Mie scat-tering is complex and highly dependent on crystal shape, orientation, and size distribution, but, in general, the number concentration becomes more important, and the diameter less important, com-pared to Rayleigh scattering. Glaciogenic seeding may increase the overall snow particle concentra-tion, but decrease the number of large particles, so the impact in reflectivity is not obvious. But an increase in W-band reflectivity can be inter-preted as a “positive” seeding effect, i.e., it im-pliesan increase in snowfall rate (S) downwind from the generators, at least for the light snowfall rates observed in ASCII and the ASCII pilot proj-ect. Indeed, theoretical work by Matrosov (2007) shows positive Z-S relationships for a range of values for the snowflake’s mass, terminal fall ve-locity, and aspect ratio. A scatter plot of observed WCR Z (units mm6 m-3) near flight level to the observed liquid-equivalent S (units mm hr-1) at flight-level in other orographic winter storms in Wyoming shows that the theoretical relationship S=0.11 Z1.25 (Matrosov 2007) applies best (Geerts et al. 2010). The same monotonically positive re-lationship between flight-level S and near-flight-level Z is reported in Pokharel and Vali (2011).
5. DETECTING THE SEEDING EFFECT: COMPOSITE RADAR REFLECTIVITY PROFILES
5.1 Composite for the 28 February 2012 IOP As the seeding signature is not immediately obvi-ous in Figure 4 nor along other “treated” (down-wind of the AgI generators) flight tracks on this flight, we composite the WCR reflectivity profiles for all flight tracks conducted on 28 February in frequency-by-altitude diagrams (FADs) (Figure 5). These diagrams show the normalized fre-quency of a reflectivity value at a certain height above ground level (AGL). Our reference is AGL because the seeding is ground-based, and to a first order low-level flow advected over a mountain conserves its height AGL. Adding more WCR profiles to a FAD increases its statistical
signifi-cance (e.g., to detect the impact of the mountain or the seeding), but the sum of all bin values re-mains the same (1.0), because of the normaliza-tion. This allows taking a difference between two FADs, even for non-matching numbers of WCR profiles, as a way to tease out the effect, in this case the effect of glaciogenic seeding.
The FADs in Figure 5 confirm the remark-able shallowness of this storm, esp. over the mountain (tracks 2-5). Reflectivity in-creases steadily towards the ground within the PBL. Significant reflectivity values (say over 0 dBZ) rarely occur above the PBL. The FADs also confirm the stratiform nature of the precipitation: low-level echoes are clustered in a rather narrow range of reflectivity values. Changes are evident in the downwind (of the generators) reflectivity FADs on the 28 Febru-ary flight from the NOSEED to the SEED pe-riod (Figure 5a and b). The question is whether any observed temporal change can be attributed to ground-based seeding. Certainly any changes aloft (> ~1 km AGL) must be unrelated to the seeding, since the AgI nuclei do not mix above the PBL, and any significant dynamical feed-backs to microphysical changes (e.g. convective development due to enhanced latent heat release) are unlikely of the short fetch of the mountain. Certainly any changes aloft (> ~1 km AGL) must be unrelated to the seeding, since the AgI nuclei do not mix above the PBL, and any significant dynamical feedbacks to microphysical changes (e.g. convective development due to enhanced latent heat release) are unlikely of the short fetch of the mountain. For instance, the decrease in echoes aloft (> 3 km AGL) in Figure 5c is associ-ated with the departure of the upper-level cloud deck during the SEED period mentioned above. We are particularly interested in changes in the lowest 0.7 km, the average depth of turbulent eddies upwind of the Sierra Madre during this flight (Table 1). In that layer the average reflec-tivity over the treated tracks is ~2 dBZ less during SEED (Figure 5c) on this flight. This implies a slight decrease in snowfall rate during seeding,
which could be interpreted as a negative seeding effect. (Note the precipitation rate on the upper abscissa in Figure 5c.)
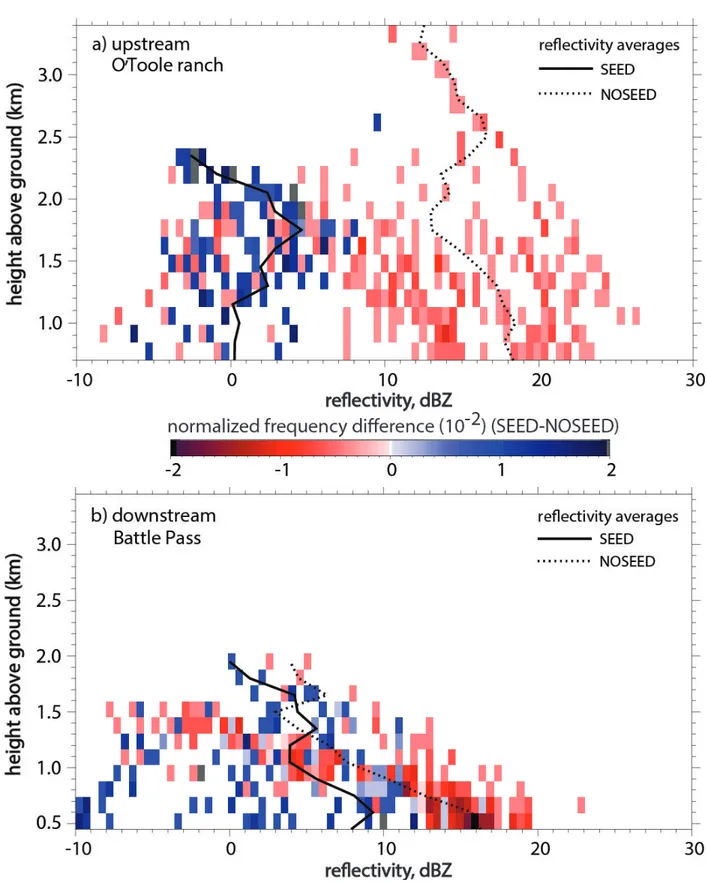
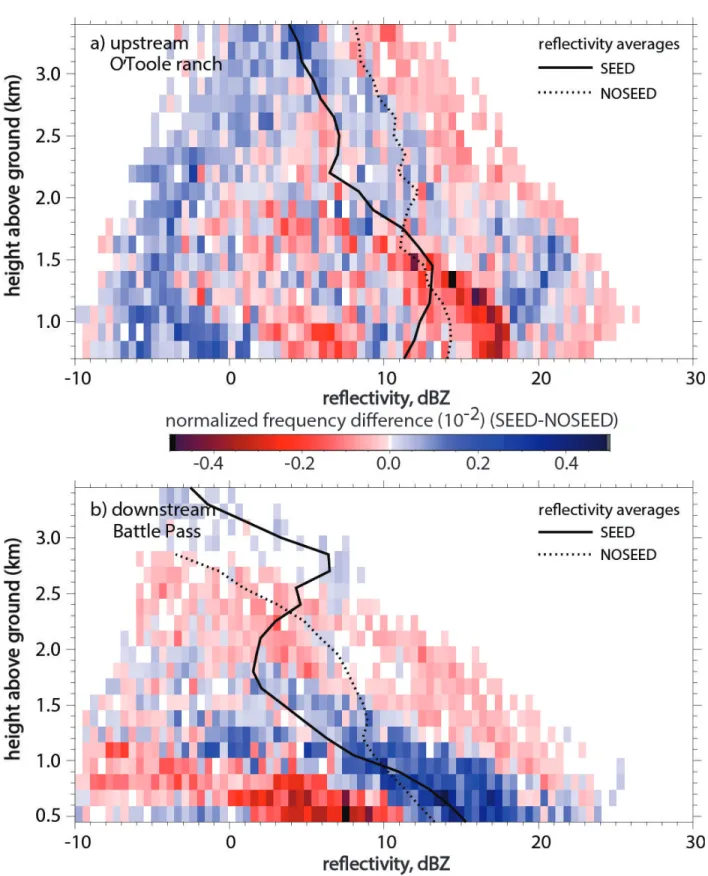
The quasi-simultaneous control (track #1, upwind of the generators) confirms the decrease in echoes aloft in (Figure 5d, e, and f) into the SEED period. Track #1 reveals a significant weakening over the full depth of the storm (Figure 4), with a mean re-flectivity decrease from the two NOSEED passes to the two SEED passes of 6.5 dBZ. Thus, the observed small decrease in low-level reflectivity over the treated tracks during the SEED period may be due to a weakening of storm intensity, too great to be offset by a positive effect of glaciogen-ic seeding. It can be hypothesized that the higher frequency of reflectivity values around 10 dBZ near the surface during SEED over the treated tracks (low-level frequency maximum near x=9 dBZ in Figure 5b, and corresponding blue area in Figure 5c) could reflects the positive effect of ground-based seeding. Such positive area is not found over the upwind control track (Figure 5f). The upstream MRR confirms the dramatic de-crease in storm intensity from the NOSEED to the SEED period (Figure 6a). Snowfall at the surface at the O’Toole ranch ceased during the SEED period, with only weak reflectivity values aloft. Downstream of the generators, at Battle Pass, the low-level reflectivity also decreased,but only ~half as much (Figure 6b), again possibly indicating a positive seeding effect overwhelmed by overall storm weakening. (The Battle Pass MRR was down for some 40 minutes straddling the NOSEED and SEED periods, hence fewer profiles are available, and the FADs are sparser.) 5.2 Composite for all ASCII IOPs:
non-simultaneous comparison
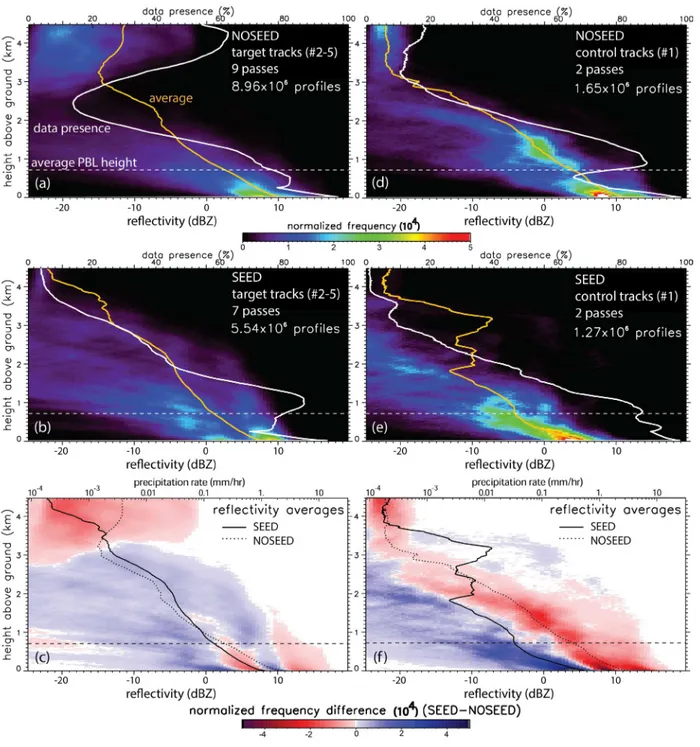
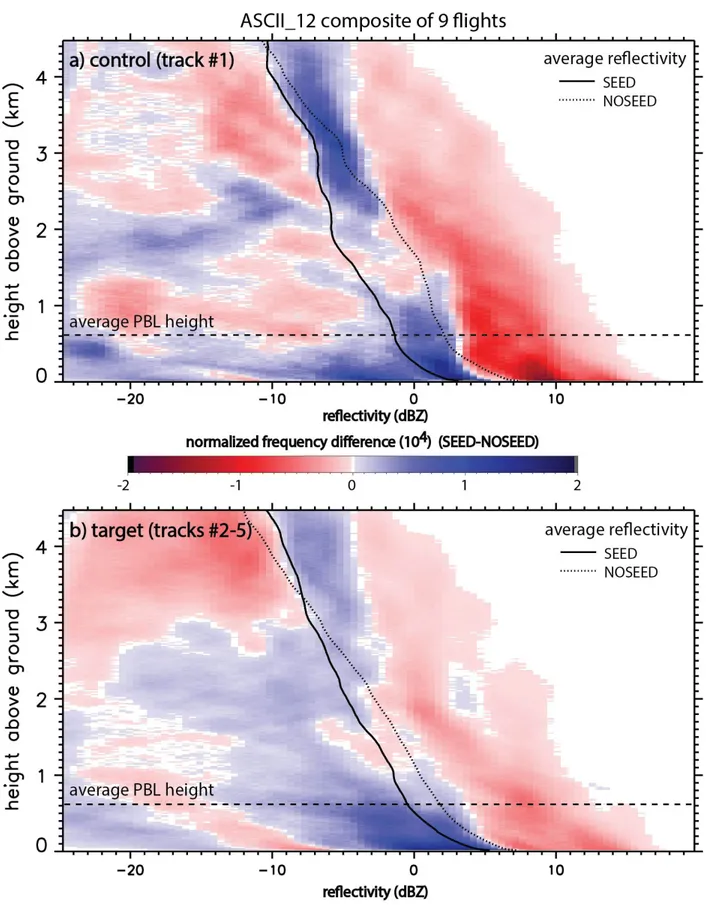
This case study illustrates the unsurprising fact that one IOP is insufficient to elucidate the im-pact of glaciogenic seeding. As mentioned be-fore, FADs can be constructed for any number of profiles. WCR data from all nine UWKA flights are composited in Figure 7. Again, blue areas indicate a higher frequency of those reflectivity values during SEED periods. The upper-level
structure of the two difference FADs in Figure 7 is similar (i.e. the red-blue-red sequence), con-firming that the same storms were sampled in the quasi-simultaneous comparison between up-stream and downup-stream tracks. In some cases the storm weakened, as in the IOP discussed above, in other cases reflectivity above the PBL tended to increase between the NOSEED and SEED pe-riods; the net effect for nine IOPs is relatively lit-tle change aloft during the flights. The difference FAD for all the downstream (treated) flight tracks does not show a positive seeding effect within the PBL (the lowest ~0.6 km) during the SEED peri-od. In that layer the average reflectivity is ~2 dBZ less during SEED (Figure 7b) on the nine flights. But again, this decrease from NOSEED to SEED is much larger over the upstream control track (Figure 7a), near the surface and at all levels. This suggests that most storms were sampled during their waning phase. In all but one IOP (29 Feb-ruary, Table 1), the NOSEED period preceded the SEED period. This sequence was by design, because observations with an ice nucleus counter and large-eddy simulations over this mountain range have shown that AgI nuclei may linger over the mountain for 1-2 hours after termination of the AgI generators (Chu et al. 2013). The limited flight endurance of the UWKA implies that 4 lad-der patterns (Figure 1a) can be flown in a single flight, but not with a 1-2 hour buffer time between NOSEED and SEED. On 29 February the IOP was split into two separate flights, allowing for a two-hour buffer between SEED and NOSEED periods. In this IOP too, the storm weakened be-tween the two (now more distant) periods. 5.3 Composite for all ASCII IOPs:
simultaneous comparison
The reflectivity profiles from the upstream (con-trol) and downstream (target) MRRs are compos-ited for all IOPs with MRR data at both locations during both periods in Figure 8. This composite includes nine IOPs, seven of which are the same as for the WCR data (Figure 7). The NOSEED and SEED periods of MRR data are the same as for the WCR data. For the two IOPs without UWKA flights (10 and 12 February, Table 1), the
Figure 5: Normalized frequency by altitude (FAD) diagrams of WCR reflectivity for the flight on 2012/02/28. The three left panels show the FADs for the four tracks downwind of the AgI generators (target), and the three right panels show the FADs for the track upwind of the AgI generators (control). The top panels ap-ply to NOSEED (before AgI dispersion), the middle panels to SEED (during AgI seeding), and the bottom panels show the difference (SEED – NOSEED). Also shown are the mean reflectivity profiles (orange lines in the upper 4 panels, and black lines in the bottom panels) and the “data presence”, i.e. the percentage of WCR range gates with radar echo as a function of height (white line in the upper 4 panels). The precipita-tion rate (S) shown in the upper abscissa of the bottom panels is inferred from S=0.11 Z1.25 (Matrosov 2007).
Figure 6: Normalized difference FAD (SEED-NOSEED) for (a) the upstream MRR (control) and (b) the downstream MRR (target). The NOSEED & SEED periods are defined as matching the UWKA periods (NOSEED: 1951-2056 UTC; SEED: 2056-2300 UTC, see Table 1).
Figure 7:Normalized difference FAD (SEED-NOSEED) for (a) the upstream flight track (control) and (b) the downstream tracks (target), for all UWKA flights in ASCII_12.
Figure 8: As Figure 6, but for all IOPs with twin MRR data in ASCII_12 (11 IOPs in total). Three of the IOPs listed in Table 1 are not included because of lack of data (no O’Toole ranch MRR data on 18 and 19 January, and no Battle Pass MRR data for the SEED period on 14 February 2012).
NOSEED period is defined as an equally long pe-riod as the actual seeding pepe-riod before the seed-ing period. The upstream MRR composite reflec-tivity FAD confirms that, on average, storms were weakening between the NOSEED and SEED pe-riods, both aloft and at low levels. The decrease in average reflectivity from 1.0-1.5 km AGL to ground level indicates snow growth aloft and sublimation at low levels. Snow growth aloft is consistent with westward-tilting mesoscale grav-ity waves, which were observed in many WCR vertical velocity transects.
This low-level sublimation is not evident in the downstream MRR composite reflectivity FAD (Figure 8b). Storms are more shallow above the mountain pass, and the mean profiles indicate that reflectivity increases rapidly towards the ground in the PBL, consistent with WCR profiles over the mountain (Figure 5a, b). Even though storms generally were weakening during the IOPs above the PBL at Battle Pass (as at O’Toole Ranch), a positive seeding effect is apparent in the lowest 0.8 km AGL.
The MRR observations are continuous, so the SEED/ NOSEED periods do not need to match those based on flight times (Table 1). If the MRR NOSEED period is defined as a longer, two-part period straddling the (typically two-hour long) SEED period, with a one-hour buffer period af-ter SEED, then the nine-storm composite SEED-NOSEED difference FAD at the control site still shows a somewhat lesser storm intensity during SEED, while the difference FAD at the target site reveals a positive seeding effect at low levels, consistent with Figure 8.
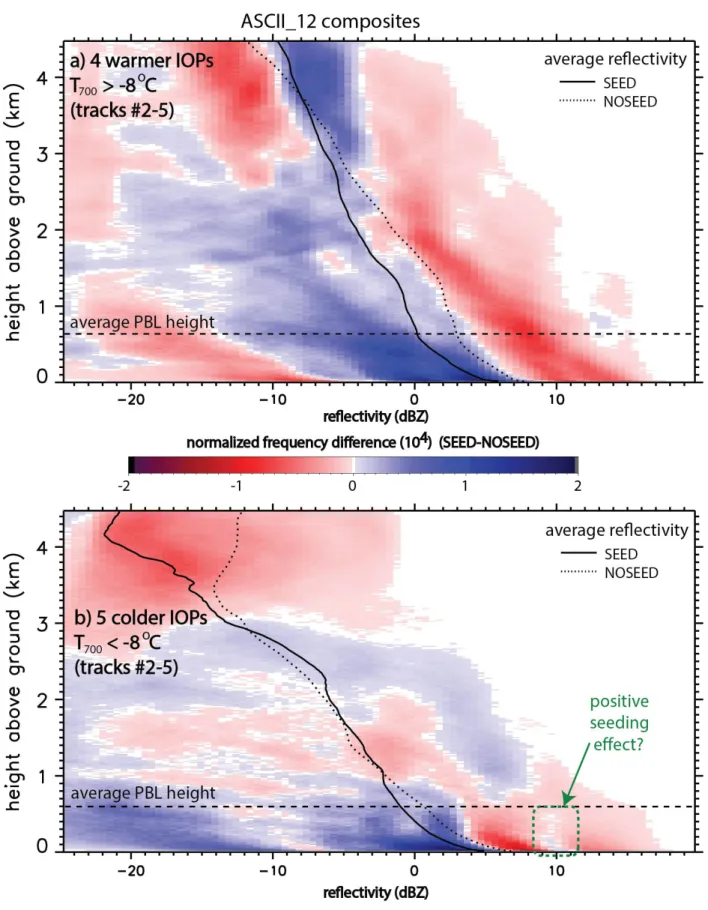
As mentioned in Section 3, the temperature at 700 mb (the approx. elevation of Battle Pass) was above -8 °C on seven of the 12 IOPs. Eliminating these seven warmer IOPs leaves five IOPs with WCR data, and four IOPs with MRR data (Table 1). The restriction of the difference FADs in Fig-ure 7 (WCR profiles) to these colder IOPs reveals a slightly more positive seeding effect within the PBL (Figure 9). Natural variability is over-whelming, but there is a slightly higher frequency of high reflectivity values ~10 dBZ in the PBL
during SEED in these colder cases. Similarly, the seeding effect becomes even more evident in the simultaneous comparison, when the MRR differ-ence FADs (Figure 8) are composed of the colder IOPs only (not shown).
6. CONCLUSIONS
A rich dataset was collected in the ASCII_12 field campaign to study the impact of ground-based glaciogenic seeding on orographic clouds and precipitation. Notwithstanding an unusually dry winter, data were collected over a total of twelve intensive observation periods. In all cases snow-fall occurred naturally. Most storms were rather shallow (~2 km deep above the terrain), and sev-eral were rather warm for AgI nuclei activation in cloud. In all but one IOP, the NOSEED period preceded the SEED period, by design. The em-phasis of this preliminary study is on reflectivity profiles from ground-based and airborne radars, since they are most likely to reveal the impact of ground-based seeding. A preliminary composite analysis of these profiles leads to the following conclusions:
- Storms naturally weakened during most IOPs, resulting in lower reflectivity during the SEED period upstream of the AgI generators, at all lev-els.
- This weakening was more benign within the boundary layer along the target flight tracks (downstream of the generators), suggesting that glaciogenic seeding tends to increase mm-wave-length radar reflectivity, and thus snowfall rate at the ground.
- This weakening was even reversed at low levels according to reflectivity profiles from the target ground-based profiling radar, confirming the positive effect of glaciogenic seeding of oro-graphic clouds on reflectivity. This study will be followed up with several other studies currently in progress, in particular large eddy simulations of ASCII cases, analyses of DOW reflectivity and polarization variables, and analyses of snow characteristics at Battle Pass.
ing Ability of Aerosols Produced by the Lohse Airborne Generator, Dept. Atmos. Sci., Colorado State Univ., Report, Fort Collins, CO, 15 pp. Deshler, T. D., W. Reynolds, and A.W. Huggins, 1990: Physical response of winter orographic clouds over the Sierra Nevada to airborne seed-ing usseed-ing dry ice or silver iodide. J. Appl. Meteor. 29, 288-330.
Geerts, B., Q. Miao, Y. Yang, R. Rasmussen, and D. Breed, 2010: An airborne profiling radar study of the impact of glaciogenic cloud seeding on snowfall from winter orographic clouds. J. At-mos. Sci., 67, 3286–3302.
Geerts, B., Q. Miao, and Y. Yang, 2011: Bound-ary-layer turbulence and orographic precipitation growth in cold clouds: evidence from profiling airborne radar data. J. Atmos. Sci., 68, 2344-2365. Holroyd, E. W., J. A. Heimbach and A. B. Su-per, 1995: Observations and model simulation of AgI seeding within a winter storm over Utah’s Wasatch Plateau. J. Weather Mod., 27, 35-56. Huggins, A. W., 2007: Another wintertime cloud seeding case study with strong evidence of seed-ing effects. J. Weather Mod., 39, 9-36.
Lawson, R. P., and Co-authors, 2006: Micro-physical and optical properties of atmospheric ice crystals at South Pole Station. J. Appl. Meteor. Climatol., 45, 1505–1524.
Marwitz, J.D., 1987: Deep orographic storms over the Sierra Nevada. Part I: Thermodynamic and kinematic structure. J. Atmos. Sci., 44, 159– 173.
Matrosov, S.Y., 2007: Modeling backscatter properties of snowfall at millimeter wavelengths. J. Atmos. Sci., 64, 1727–1736.
Medina, S., B.F. Smull, R.A. Houze, and M. Steiner, 2005: Cross-barrier flow during oro-graphic precipitation events: results from MAP and IMPROVE. J. Atmos. Sci., 62, 3580–3598. ACKNOWLEDGEMENTS
The ASCII campaign is funded by the National Science Foundation grant AGS-1058426. This work also received funding from the Wyoming Water Development Commission and the Unit-edStates Geological Survey, under the auspices of the University of Wyoming Water Research Program. The operation of the AgI generators, the MRR, and the microwave radiometer was supported by the WWMPP, which is funded by the State of Wyoming and managed by Barry Lawrence. The field deployment of the CPI was funded by the Six Agency Committee, Central Arizona Water Conservation District, and the Southern Nevada Water Authority. We appreciate the constructive input of two anonymous review-ers; they significantly improved this manuscript. REFERENCES
Braham, R.R., 1966: Final report of Project Whitetop. Part I: Design of the experiment. Part II: Summary of operations. Dept. of Geophysi-cal Sciences, Univ. of Chicago (available from NTIS, PB-176-622).
Breed, D., R. Rasmussen, B. Lawrence, B. Boe, T. Deshler, C. Weeks, and S Landolt, 2013: Eval-uating winter orographic cloud seeding: Design of the Wyoming Weather Modification Pilot Project (WWMPP). Bull. Amer. Meteor. Soc., in preparation.
Chu, X., B. Geerts, L. Xue, and R. Rasmussen, 2013: Cloud-resolving Large Eddy Simulations of the impact of AgI nuclei dispersed from the ground on orographic clouds and precipitation. Part I: model validation. Mon. Wea. Rev., in prep-aration.
Crewell, S., and U. Löhnert, 2003: Accuracy of cloud liquid water path from ground-based mi-crowave radiometry. Part II: Sensor accuracy and synergy. Radio Science, 38, 8042-8059.
DeMott, P.J., 1997: Report to North Dakota At-mospheric Resource Board and Weather Modifi-cation Incorporated on Tests of the Ice
Nucleat-Morrison, A.E., S.T. Siems, M.J. Manton, and A. Nazarov, 2009: On the analysis of a cloud seed-ing dataset over Tasmania. J. Appl. Meteor. Cli-matol., 48, 1267–1280.
NCAR, 2009: 2009 Interim Report (September 2008-August 2009), Wyoming Weather Modifica-tion 5-Year Pilot Program (EvaluaModifica-tion) – Medi-cine Bow/Sierra Madre and Wind River Ranges, Level II Feasibility Study, Report to the Wyoming Water Development Commission, 184 pp.
Pokharel, B., and G. Vali, 2011: Evaluation of collocated measurements of radar reflectivity and particle sizes in ice clouds. J. Appl. Meteor. Cli-matol., 50, 2104–2119.
Rasmussen, R., and Co-authors, 2012: How well are we measuring snow: the NOAA/FAA/NCAR Winter Precipitation Test Bed. Bull. Amer. Me-teor. Soc., 93, 811–829.
Super, A.B., and J.A. Heimbach, 1988: Micro-physical effects of wintertime cloud seeding with silver iodide over the Rocky Mountains. Part II: Observations over the Bridger Range, Montana. J. Appl. Meteor., 27, 1152–1165.
Super, A. B. and B. A. Boe, 1988: Microphysical effects of wintertime cloud seeding with silver io-dide over the Rocky Mountains. Part III: Obser-vations over the Grand Mesa, Colorado. J. Appl. Meteor., 27, 1166-1182.
Super, A. B., 1999: Summary of the NOAA/Utah Atmospheric Modification Program: 1990-1998. J. Weather Mod., 31, 51-75.
Super, A.B., B.A. Boe, J.A. Heimbach, J.T. McPartland, and G. Langer, 2010: Comparison of silver iodide outputs from two different gen-erators and solutions measured by acoustic ice nucleus counters. J. of Weather Mod., 42, 49-60. Ware, R., and Co-authors, 2003: A multichannel radiometric profiler of temperature, humidity, and cloud liquid. Radio Science, 38, 8079-8098. Yuter, S., and R. A. Houze, 1995: Three-dimen-sional kinematic and microphysical evolution of Florida cumulonimbus. Part II: Frequency distri-butions of vertical velocity, reflectivity, and dif-ferential reflectivity. Mon. Wea. Rev., 123, 1941– 1963.