Economic Impact of Natural Disasters
Tracking the Medium-Short term Growth Time Path in Asian Countries
Bachelor‟s thesis within Economics
Author: Yielmaz Javed 890802-T036 Tutor: Börje Johansson
Bachelor‟s Thesis in Economics
Title: Economics Impact of Natural Disasters: Tracking the Medium-Short term Growth Time Path in Asian Countries
Author: Yielmaz Javed
Tutor: Associate Professor Börje Johansson Ph.D. Candidate James Dzansi
Date: June 8th 2010
Keywords: Natural Disasters, Asia, Agricultural output growth, industrial output growth, Floods, Earthquakes, Storms, Droughts
Abstract
Past decades have witnessed evidence to large-scale upheaval caused by natural disasters. Thus, there is a need for determination of mechanisms through which natural disasters may influence growth, especially for developing countries. This paper traces the medium-short run time path of agricultural and industrial output growth response to four types of disasters in Southern and Southeastern Asian countries. Disasters considered are floods, droughts, storms and earthquakes. The empirical results suggest heterogeneous effects for disasters as well as different economic sectors. In many cases disaster impact was delayed. Generally speaking, floods and droughts have a stronger effect while earthquakes and storms have a weaker one on disaggregated output growth. Floods have a predominantly posi-tive effect while droughts have a negaposi-tive one on both agricultural and industrial sectors. Storms seem to show a stronger negative effect in the agricultural sector than in industrial sector hinting at existence of short lived indirect effects. Earth-quakes, on the other hand, presented ambiguous growth responses.
Table of Contents
1
Introduction ... 1
1.1 Background and Purpose ... 1
1.2 Method ... 2
1.3 Disposition ... 3
2
Economics of Natural Disasters ... 4
2.1 Disaster Impact ... 4
2.1.1 Immediate Aftermath ... 4
2.1.2 Medium-Short Run Impact ... 4
2.1.3 Medium-Long Run Impact ... 5
2.2 Disasters and Growth Theory ... 6
2.2.1 Exogenous Growth Model ... 6
2.2.2 Endogenous Growth Models ... 8
2.2.2.1 Schumpeterian Growth Model ... 8
2.2.2.2 Disasters and Capital Vintages ... 9
2.2.2.3 Summary of Theory ... 11
3
Data ... 12
3.1 Variables ... 12 3.2 Sources ... 124
Methodology ... 14
4.1 Model Specification ... 14 4.2 Robustness ... 14 4.3 Diagnostic Testing ... 155
Findings ... 17
5.1 Statistical Significance ... 17 5.2 Regional Trends ... 17 5.3 Empirical Analysis ... 18 5.3.1 Floods ... 19 5.3.2 Storms ... 20 5.3.3 Droughts ... 22 5.3.4 Earthquakes ... 23 5.4 Theoretical Analysis ... 246
Conclusions ... 26
6.1 Comments ... 26List of references ... 27
7
Appendix ... 29
Figures ... 29 Tables ... 33 Descriptions ... 34Figures
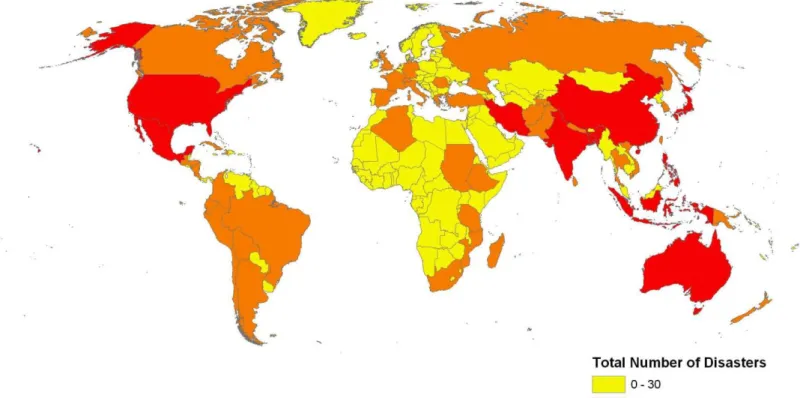
Figure A1 Global Incidence of Natural Disasters ... 29
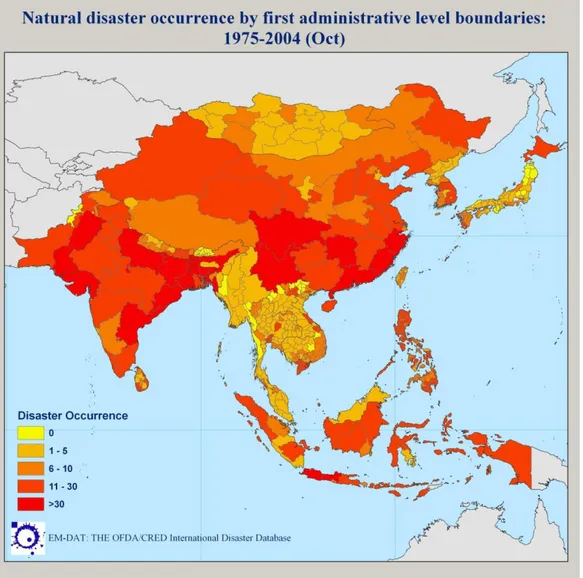
Figure A2 Southern and South-eastern Incidence of Nautral Disasters ... 30
Figure A3 Information uncertainty ... 31
Figure A4 Solow-Swan Exogenous Growth Theory ... 31
Figure A5 Schumpeterian and Steady State Relations ... 32
Tables
Table 1 Weighted Average Percentage of significant coefficients ... 17Table 2 Heterogeneous Effects ... 19
Table 3 Delay Effect Occurrence ... 19
Table 4 CoefficientEstimates for Floods ... 20
Table 5 Coefficient Estimates for Storms ... 21
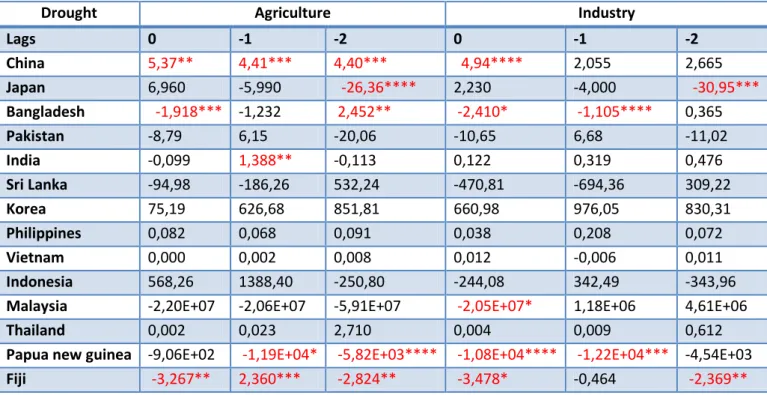
Table 6 Coefficient Estimates for Droughts ... 22
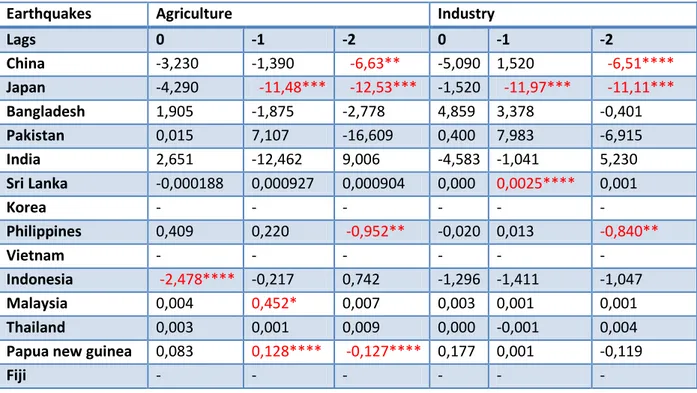
Table 7 Coefficient Estimates for Earthquakes ... 23
Table 8 Excluded Countries ... 33
1
Introduction
1.1
Background and Purpose
Past decades have witnessed evidence to large-scale upheaval caused by natural disas-ters. Cases in point are the May 2008 earthquake in Sichuan China, 2005 hurricane Ka-therine, 2005 Pakistani Kashmir earthquake and the Tsunami disaster in Indian Ocean in December 2004. Looking at disaster statistics showing thousands of casualties and mil-lions, if not billions of dollars in damages, one may only wonder whether or not these disasters have an economic impact. Due to their astronomical costs and unpredictability, there is need for research into mechanisms through which they influence growth. Such research is of interest to insurance firms and governments, especially those of develop-ing countries.
Total economic damages due to natural disasters during the 2000 decade alone were $819.3 billion; a 23% and 372% increase from the 90s and 80s recorded losses respec-tively (EM-DAT). It can be stated with considerable certainty that the majority of these events are occurring or are at least being increasingly recorded in developing countries. From figures 1 and 2, it is simple to infer that within Asia, Southern and Southeastern regions are the most effects in terms of losses due to high disaster incidence. Therefore, there is need for closer scrutiny of these regions in order to disaggregate region-specific natural disaster impacts from already determined net global impacts.
The purpose of this paper is to empirically determine a medium term time-path for eco-nomic growth response in the aftermath of a natural disaster. The study focuses on Southern and South Eastern Asian countries.
The study considers disaggregated output growth i.e. growth of agricultural and indus-trial outputs. Furthermore, the analysis differentiates between effects of four types of disasters; droughts, flood, storms and earthquakes. Such detailed analysis with respect to economic sectors and types of disasters is essential due heterogeneous impact of nat-ural disasters across different types of outputs and disasters as noted by several recent studies (see for instance Loayza, Fomby & Ikeda, 2009a; Raddatz, 2009).
In addition to disaggregation of output, this study also has three features which set it apart from similar strands of disaster literature. First, it uses a simpler case by case me-thodological approach (simple OLS time series analysis) designed to capture possible deviations from the mean response of growth documented by recent literature investi-gating global impact (see Noy & Nualsri, 2007; Noy, 2009; Loayza et al, 2009a; Rad-datz 2009). Need for such disaggregation is emphasized by a generic possibility of some regions being more exposed to particular disasters than other regions. Thus, pooling countries from different regions (with different dominant generic disaster types) togeth-er might be misleading while investigating impact of a particular disasttogeth-er. Thtogeth-erefore, analysis of natural disasters should be held in the context of region if not country specif-ic spatial settings (see Okuyama, 2003).
Second, the study comments on the time-path of recovery instead of just mentioning the
net impact of a natural disaster. Such time path analysis would be able to capture a
poss-ible delay mechanism; it is possposs-ible for a disaster to have a positive (negative) initial ef-fect on growth, followed by a persistent negative (positive) efef-fect.
Third, the natural disaster proxy variables used for this study also account for economic damage as there is a serious disparity between the humanitarian and economic losses among different disasters as well as in different economic sectors. Other studies have only considered humanitarian costs (for instance Loayza et al., 2009b; Raddatz 2009; Noy 2007)
In addition, there are three papers in particular which are closely related to this study. The first study is by Loayza et al (2009b) who analyze medium term disaster effects on growth of agricultural and non-agricultural economic sectors within an exogenous growth theory framework. They employ a GMM-System (used for short panel time ries data) in order to identify net impacts. In contrast, this study uses individual time se-ries data and OLS estimation to draw conclusions.
The second paper is by Raddatz (2009). The author investigates disaster effects on ag-gregate growth without making any distinction between different economic segments. There is, however, a division with respect to disasters but into groups rather than types. On the other hand, this study disaggregates different sectors of growth and considers specific (four) types of disasters. Raddatz (2009) uses a panel VAR approach in order to quantify mean effects. He finds that small states do not react differently to disasters as compared to larger countries on average. He goes further and states that effects of disas-ters are independent of aid flows and indebtedness while level of economic growth does have an influence.
Lastly, Loayza et al. (2009a) analyses the path of adjustment in a post disaster economy by applying a VARX approach to a panel of 87 countries and considering disasters oc-curring in the period 1960-2007. They find heterogeneous effects of natural disasters on growth including some positive effects. Developing countries seemed to experience more pronounced effects of disasters. Loayza et al. (2009a) also find evidence for dif-ferent effects on agricultural and non agricultural output. Their paper can be seen as a companion paper. This study, however, does not use panel time series, thus tries to dis-aggregate disaster effects with respect to countries in Southern, Southeastern Asia. They also differentiate between moderate and severe disasters. Loayza et al. (2009a) is the only study to document any sort of delay effects.
1.2
Method
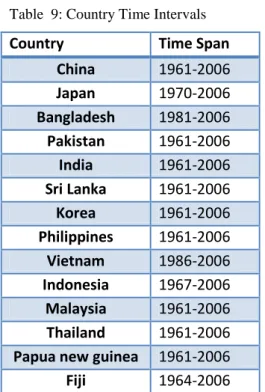
This study arrived at relevant conclusions after analysis of empirical results obtained through the Ordinary Least Squares statistical technique using time series natural disas-ter data from 1961-2006. Only 14 countries1 from Southern and South-eastern Asian re-gion are considered in order to, first, define the geographic space within which conclu-sions of this study are applicable and second to avoid complications introduced by li-mited exogenous nature of a natural disaster in connection to a particular natural hazard area (Jaramillo, 2009). 10 countries from these regions did not have sufficient data ei-ther for natural disasters or sector-specific growth for regression.2 Moreover, some countries had almost no data for certain disaster types purely due to regional climatic
1 See Table 9 in Appendix for complete list of countries considered. 2
factors. Not all countries had a complete data set for years 1961-2006.3 It should be noted that countries included are by default developing countries due to choice of re-gion. All regressions have been carried out using secondary data.
1.3
Disposition
The following section presents the theoretical framework, focusing on previous research regarding effects of natural disasters on growth and possible enabling mechanisms in connection with endogenous and exogenous growth theories. Section 3 comments on the data sources used while section 4 focuses on econometric model specification used for the empirical analysis. Section 5 presents an analysis of empirical results. Section 6 offers conclusions, direction for future research and remarks concerning the study.
2
Economics of Natural Disasters
It is understood, after much research, that natural disasters do have an impact on growth. Different studies have attempted to determine net impact of natural disasters on different macroeconomic measures such as GDP growth rates, exchange rates and ex-ternal and inex-ternal balances. Recent literature can be classified into two main categories;
ex-ante and ex-post (Noy & Cavallo, 2009). Ex-ante literature deals with disaster
miti-gation options such as multilayered insurance systems as well as insurance markets (see Benson & Clay, 2004; Kunreuther & Pauly, 2006; Andersen, 2002; Barnett et al., 2008).
Ex-post literature focuses on mechanisms and determinants of natural disaster impact.
This study aspires to contribute to ex-post literature.
Ex-post literature can be further divided into two major strands. First strand deals with direct/indirect impact of natural disasters while the second one investigates natural dis-asters as external shocks in a growth theory framework.
2.1
Disaster Impact
2.1.1 Immediate Aftermath
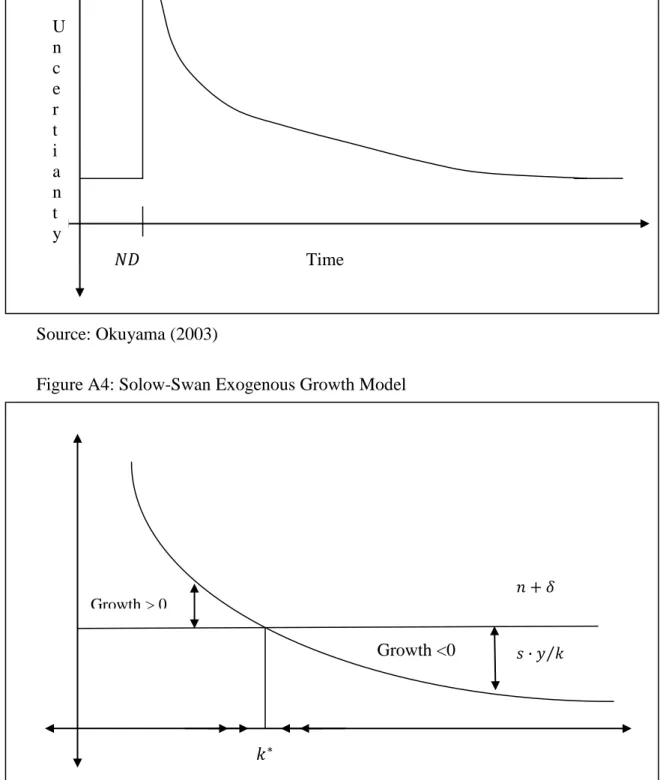
In the immediate disaster aftermath is a combination of information uncertainty (indi-rect effect) and capital destruction (di(indi-rect effect) which determine short run and long run growth responses. Okuyama (2003, p11) defines uncertainty as „[a state in the] af-termath of a disaster where the situations and consequences cannot be expressed in terms of specific mathematical probabilities‟.
In an event of a disaster, optimum resource utilization, at least in theory, is carried out in order to maximize overall future production. Such optimization is sensitive to mar-ginal productivity conditions, among other factors (Dacy & Kunreuther, 1969). In pres-ence of uncertainty, as described above, such optimum allocation is not possible as there may be a considerable discrepancy between subjective and actual probabilities. These allocation inefficiencies may only be evident in the long run when more information is available (Okuyama, 2003). Figure A3 in the Appendix tracks uncertainty in the after-math of a disaster. Therefore, short run growth is adversely affected by disasters due to information uncertainty. Benson and Clay (2004) suggest ear-marking investments for post disaster resource allocation may alleviate ex-post impact. Determination of value of information in uncertain situations may be a solution as well (Dacy & Kunreuther, 1969). Such quantification, however, would be a daunting task. Investigation of above mentioned solutions would entail a discussion of risk and mitigation strategies which are outside the scope of this study.
2.1.2 Medium-Short Run Impact
Literature concerning direct impact of natural disasters on macroeconomic indicators using a multi-event and/or multi-country framework is still in its infancy. One of the pioneering works on macro-aspects of natural disasters is a seminal monograph by Al-bala-Bertrand (1993). The study is based on 28 natural disasters taking place in 26 countries during 1960-1979. Based on statistical analysis, Albala-Bertrand finds that while there is no discernible impact on inflation and exchange rates, there is an increase in measures of GDP, capital formation, agricultural output, trade deficit and reserves. A
similar analysis was carried out by Rasmussen (2004), who focused on disasters occur-ring in the Caribbean Islands between 1970 and 2002. The study showed a median de-cline of 2.2% in GDP and a median increase in the current account deficit of up to 10.8% of GDP for the disaster year.
Closely related to Rasmussen‟s work, Heger, Julca and Passison (2008) examine effects on the Caribbean region. They find adverse effects on external and fiscal balances as well as on growth. Moreover, they identify economic diversification as a helpful meas-ure for mitigating disaster impacts.
Raddatz (2007) investigates impact of external shocks, including natural disasters, on sample of 40 low income countries using a panel Vector Auto-regression model. While he observes a 2% and 4% reduction in GDP for climatic and humanitarian disasters re-spectively, he fails to find variance in GDP due to geographic disasters. His headline conclusion was that exogenous shocks account for a very small part of output volatility as compared to endogenous shocks.
A recent study by Noy (2009) investigates short-run effects on output growth by using panel data for period 1970-2003 while controlling for population size and economy size. He finds statistically significant negative effects on annual GDP growth especially for variables accounting for property damage. These effects were more pronounced in de-veloping countries than developed countries. Moreover, Noy (2009) also finds evidence for positive relationship between higher government spending, institution quality, litera-cy rate and per capita income and countries‟ macroeconomic response after natural dis-asters.
A study similar to Noy‟s (2009) work was conducted by Skidmore and Toya (2007), who determined dependence of natural disaster losses on economic development by in-vestigating natural disasters happening in 151 countries from 1960 to 2003. They find that there are measures of economic welfare, other than income, which can allow poli-cymakers to make disaster mitigation efforts more fruitful. Indicators reducing vulnera-bility to disasters include education, trade openness and development of financial mar-kets.
2.1.3 Medium-Long Run Impact
While most of the studies mentioned so far determine short run or medium-short run impact, there are several other studies determining medium-long run effects. Jaramillo (2007) investigates long run and short run effects of natural disasters through a panel study of 113 countries over the period 1960-1996. His results suggest that both long run and short run effects of disasters depend on population, income level and type of disas-ter. Overall he observes effects ranging from negative 0.9% to positive 0.6% GDP growth response to natural disasters.
One of the earliest ground breaking papers determining long run effects was by Skid-more and Toya (2002). Their cross-country analysis, spanning over the period 1960-1990, yielded seemingly counter-intuitive conclusions; climatic disasters have a positive impact on long run growth while geologic disasters have a negative effect. Among other explanations involving physical and human capital, Skidmore and Toya (2002) attribute the positive impact of disasters to Schumpeterian creative destruction.
In an attempt to decisively establish the impact of natural disasters Raddatz (2009) con-ducts panel VAR and concludes that a disaster occurring every fourth year (medium-short run)and affecting half of a country‟s population will reduce real per capita GDP by 0.6%. Moreover he finds that small states do not experience significantly different impact that those experienced by other countries. Furthermore, developing countries seem to be effected by climatic disasters to a greater degree than developed countries. Effects of factors like Official Development Assistance and initial indebtedness had in-significant effects on impact of disasters. Raddatz (2009) also finds droughts to have the largest cumulative (long run) effect on per capita GDP with climatic and other disasters having insignificant effects.
Hochrainer (2009) takes a markedly different approach and investigates gaps between actual and counter factual GDP. He finds typical storms, droughts and earthquakes to have negative while floods to have positive impact on GDP. It should be noted that his use of ARIMA4 models to obtain counter factual GDP might have introduced prediction biases.
The general consensus seems to be that all general disasters do not effect growth in the same manner and their effect is more amplified for developing countries. Droughts seem to have the strongest but negative effect. Floods on the other hand have positive effects on growth. Other disasters, namely earthquakes and storms, seem to have insig-nificant effects.
2.2
Disasters and Growth Theory
Literature investigating natural disasters as external shocks to growth models finds evi-dence for both positive and negative impacts. Literature theoretically arguing the impact of natural disasters can be divided into two strands; Solow-Swan exogenous growth model and endogenous growth models.
2.2.1 Exogenous Growth Model
Studies investigating natural disasters in an exogenous growth theory framework have extensively used Solow-Swan model or at least as a departure point due to its simplicity and conceptual strength (Loayza, Ollaberia & Christiansen, 2009b). Moreover, the me-dium-term time horizon considered in the model is also relevant to this study. There-fore, I present the Solow-Swan model in order to establish a theoretical foundation for a comparison between exogenous and endogenous explanations for disaster impact.5 Consider a one-good economy where production uses two factors of production i.e. la-bor and capital. Moreover, constant returns to scale and diminishing marginal returns are also assumed. Production takes place according to a production function which may take the Cobb-Douglas form:
𝐹 𝐾, 𝐿 = 𝑌 = 𝐴𝐾𝛼𝐿1−𝛼 (1)
4 Auto-Regressive Integrated Moving Averages
5 Following presentation of Solow-Swan model has been heavily derived from Loayza et al. (2009b) and
where α and 1 − 𝛼 are factor shares (between 0 and 1) and 𝐴 is productivity parameter. The constant return to scale assumption allows us to define capital and output in
inten-sive form. That is, 𝑦 = 𝑌 𝐿 and 𝑘 = 𝐾 𝐿 . 𝑘 is also called capital-labour ratio.
Produc-tion funcProduc-tion can thus be redefined as 𝑌 𝐿 = 𝐹 𝐾 𝐿, 𝐿 𝐿 = 𝐾𝛼 𝐿 𝐿 𝐿𝛼 = 𝑘𝛼 = 𝑦 = 𝑓 𝑘 (2)
Note that marginal product of capital (𝑀𝑃𝐾 = 𝑓′(𝑘)) and marginal product of labour (𝑓 𝑘 − 𝑓′(𝑘)𝑘) are decreasing and increasing functions of capital-output ratio 𝑘 re-spectively (see Carlin & Soskice, 2006). It is also assumed that a fraction of output is saved at an exogenous rate 𝑠 and subsequently invested in order to allow capital forma-tion. Labor also grows at an exogenous fixed rate 𝑛. Therefore, changes in capital and labor over time are given by
∆𝐾 = 𝑠𝑌 − 𝜏𝐾, ∆𝐿 = 𝑛𝐿 (3)
where 𝜏 is rate of depreciation of capital and ∆ indicates change. After some algebra6 and calculus7, growth rate of per worker capital and output can be defined as
𝑔𝑘 =∆𝑘𝑘 = 𝑠𝑦𝑘 − (𝜏 + 𝑛) (4) 𝑔𝑦 = ∆𝑦𝑦 = 𝛼(𝑔𝑘) (5)
It can be seen from equations (4) and (5) that output growth is a function of capital growth which in turn depends upon terms 𝑠𝑦𝑘 and 𝛿 + 𝑛 . Figure A3 plots these terms as functions of capital-labour ratio 𝑘. In the steady state, capital-labour ratio 𝑘∗ be-comes equal to the exogenous population growth rate. This state is denoted by intersec-tion of the two lines. If 𝑘 < 𝑘∗ capital is scare and thus more productive. Therefore, output growth would temporarily increase in order to induce capital formation and would reduce to zero once steady state is reached. On the other hand, if 𝑘 > 𝑘∗, output growth will decline, since capital is abundant and less productive, until capital-labor ra-tio has contracted to 𝑘∗.
It can be intuitively stated that a natural disaster leaves depleted physical and human capital in its aftermath. Solow-Swan growth model predicts that such destruction of cap-ital will cause a country to move away from the steady state. Therefore, in aftermath of a natural disaster, growth would temporarily increase as a response to increased capital returns due to scarcity of capital until steady state is restored (Noy & Nualsri, 2007). Also, reconstruction may further, temporarily, increase growth. However, if a disaster hurts productive capacity (reducing 𝐴) by, for example, reducing human capital or dep-leting natural resources then growth would decrease for all levels of capital-labor ratio.
6 Equation 3 can be written as; ∆𝑘 = 𝑠𝑦 − 𝜏𝑘 − 𝑛𝑘 =∆𝑘 𝑘 = 𝑠𝑦 −𝑘(𝜏+𝑛) 𝑘 = 𝑠 𝑦 𝑘− 𝜏 + 𝑛 = 𝑔𝑘 (4) 7 Differentiating equation 2: 𝜕𝑦 𝜕𝑘 = 𝛼𝑘 𝛼−1= 𝛼𝑘𝛼 𝑘, 𝜕𝑦 𝑘𝛼 = 𝛼 𝜕𝑘 𝑘 = 𝜕𝑦 𝑦 = 𝛼(𝑔𝑘) (5)
Noy and Nualsri (2007) empirically tests validity of neo-classical theory in the context of growth among developing countries in presence of exogenous disaster shocks. They find that a negative shock to human capital reduces growth rate while shocks to physical capital have no statistical significance. They conclude neo-classical theories fail to ac-count for the growth experience of developing ac-countries. Caselli and Malhotra (2004) also come to similar conclusions after failing to find evidence of positive growth re-sponse to natural disasters as predicted by neo-classical theories.
Loayza et al. (2009b) investigates medium term response of growth to natural disasters while disaggregating for agricultural and non-agricultural outputs as well as four differ-ent types of disasters. They find positive effects for moderate floods. But for all severe disasters they find negative growth response. They conclude that a simplified Solow-Swan growth model provides plausible theoretical explanation for their findings through disaster effects on capital and productivity parameters.
2.2.2 Endogenous Growth Models
Disaster impact also finds plausible explanations in endogenous growth theory which uses exogenous growth theory as a departure point. Endogenous growth theory in natu-ral disaster context literature8 concentrates on Schumpeterian growth models (see Skidmore and Toya, 2002; Cuaresma et al., 2008) and the Non-Equilibrium Dynamic Model (NEDyM) (see Hallegate & Ghil, 2008; Hallegate et al., 2007; Hallegate & Du-mas, 2008).
Endogenous growth theory has the potential of supporting all three possible hypotheses in case of natural disaster impact. That is disasters have a positive, negative or neutral effects. While exogenous theory explain growth in relation to capital accumulation, en-dogenous determine growth response solely in relation to technological progress.
2.2.2.1 Schumpeterian Growth Model
Schumpeter‟s notion of creative destruction assumes a dual nature of technological growth. That is creation of new technologies in order to capture a temporary monopoly profit while making old technologies obsolete. If Schumpeterian growth is considered in connection with Solow-swan model instead of Aghion and Howitt‟s (1998) interpreta-tion, it can be proven that a negative shock to capital instilling a decrease in savings and increase in consumption will trigger a decrease in the rate of technological progress and thus growth (Carlin & Soskice, 2006). Diminishing returns to capital can be overcome by three mechanisms mentioned by Carlin and Soskice (2006); Knowledge spillovers, human capital accumulation and research and development.
Consider different steady states for different rates of exogenous technological progress 𝑥. All else constant, an increase in technological progress would entail a de-crease in capital per efficiency unit of labor 𝑘 . This may now be referred to as the steady-state relation. Therefore, a graph of x against 𝑘 would yield a downward sloping line.
8 Computable General Equilibrium (CGE) and World Bank RIMSIM models are not considered in this
Moreover, a „Schumpeterian Relation‟ can be defined by modeling determinants of technological progress as
𝑥 = 𝜆𝜎𝑞 (8)
where 𝜆, 𝜎 and 𝑞 are probability of successful innovation, marginal productivity in-crease per innovation and expected return respectively. Since, 𝑥 is positively correlated with expected return q which in turn increases in-step with capital per efficiency unit of labor, we can obtain an upward slopping Schumpeterian Relation on an 𝑥-𝑘 graph. Figure A5 presents endogenous determination of technology through Steady-state and Schumpeterian relations. Consider a thought experiment; a disaster happens in an econ-omy depleting capital and thus inducing a need for capital replacement. In this case steady state relation will move outwards while pushing capital per efficiency unit (through increase R&D). Therefore a disaster would shift the economy to higher steady state to point B, northwest of A (Carlin & Soskice, 2006).
Let us extend the thought experiment to include a large scale depletion of high quality human capital like that in the aftermath of an intense earthquake in an industrial cluster. In this case the Schumpeterian relation would shift downwards due a decrease in R&D productivity 𝜆. This would shift the economy to a lower steady state at point C, south-east of point A. It should also be noted that such depletion of human capital and subse-quent growth reduction may be rare as compared to growth increase due to savings in-crease.
Developed markets seem to be a prerequisite for Schumpeterian creative destruction but authors such as Skidmore and Toya (2002) have applied this model to developing coun-tries. However, it should be considered that developed market argument can be avoided due to opportunities of international technological transfers.
Skidmore and Toya (2002), as mentioned before, find a positive relation between cli-matic disasters and growth citing Schumpeterian creative destruction as a possible rea-son. Cuaresma, Hlouskova and Obersteiner (2008), however, empirically tested Skid-more and Toya‟s (2002) conjecture to find no evidence supporting creative destruction in the aftermath of a disaster especially in developing countries. They cite lack of inter-national technological transfers as an underlying reason. They find evidence of such transfers in developed countries.
2.2.2.2 Disasters and Capital Vintages
Since disasters alter capital composition, a brief mention of capital replacement me-chanism can provide valuable insight regarding their growth impact. Total capital in an economy may be composed of different capital vintages. That is, capital of different economic ages. If the economic age or vintage 𝜏 of capital 𝐾𝜏 is kept constant then growing wage levels and falling output prices would eventually reduce net profit 𝜋 cap-tured by firms to zero. In order to keep 𝜋 > 0, firms must replace the older vintage of productivity 𝐴𝑡−1with a younger vintage of productivity 𝐴𝑡, where 𝐴𝑡 > 𝐴𝑡−1 (Johans-son, 1990). In context of this study, vintage replacement can be seen as a possible con-sequence of disaster where younger vintages are provided through international tech-nology transfers.
The above mentioned case presents an evolution of industrial vintages. Agricultural vin-tages exhibit almost opposite trends to industrial ones. According to Johansson (1990) agricultural output prices constantly rise as younger agricultural vintages have a lower productivity than the old ones. This is due to utilization of the most fertile land followed by expansion of output through utilization of less fertile (remaining) land (Johansson, 1990).
For purpose of simplicity, assume that in a pre-disaster economy all capital belongs to one vintage. If a disaster happens in such an economy capital would surely need to be replaced either by old vintage or a new vintage. Whether the capital used for replace-ment belongs to the old vintage or a new one, can be theoretically determined by a growth model known as the Non-Equilibrium Dynamic Model [NEDyM].9 Let us first briefly introduce and then apply NEDyM to disaster situations.
NEDyM essentially reproduces the effects of Solow-Swan growth model but allowing for short-run disequilibria in the goods and labor markets and household and producer behaviors during the transition period (Hallegate et al., 2007). These disequilibria allow a much more accurate account of a disaster aftermath.
In a bid to accurately model disaster impact, Hallegate and Dumas (2008) modify the Cobb-Douglas production function by introducing a term 𝜉𝑘 to account for non-destroyed (old vintage) capital such that the effective capital 𝐾 = 𝜉𝑘𝐾0 where 𝐾0 is the potential capital (capital in absence of disasters). The modified production function is as follows:
𝑌 = 𝜉𝑘𝑓 𝐿, 𝐾0 = 𝜉𝑘𝐴𝐿𝛼−1𝐾0𝛼 (9)
Destruction of (𝜉𝑘 − 1)% capital would reduce growth by the same percentage. Defini-tion of capital as menDefini-tioned above renders it necessary to modify modeling of total in-vestment 𝐼𝑡. Following a disaster, total investment would comprise of normal invest-ment 𝐼𝑛 increasing potential capital 𝐾0 and reconstruction investment 𝐼𝑟 replacing non-destroyed capital 𝜉𝑘. Total investment is then given by 𝐼𝑡 = 𝐼𝑛 + 𝐼𝑟. It is the vintage of capital used for restoration of 𝜉𝑘which defines the medium run growth path. Growth rates of capital are
𝜕𝐾0 𝜕𝑡 = −1 𝜏𝑑𝑒𝑝 𝐾0+ 𝐼𝑛 𝜉𝑘 (10) 𝜕𝜉𝑘 𝜕𝑡 = 𝐼𝑛 𝐾0 (11)
where 𝜏𝑑𝑒𝑝 is depreciation. Since reconstruction investments have higher returns, it can be plausibly assumed that destroyed capital will be replaced first (Hallegate & Dumas, 2008). Therefore, theoretically speaking, effects of natural disaster on growth should be evident in the medium-run, if not in the short-run.
Hallegate & Dumas (2008) also apply the NEDyM model in order to theoretically prove that positive effect of natural disasters, such as those documented by Skidmore and
Toya (2002) cannot exist if the Schumpeterian creative destruction is to account for these effects. They call this positive effect of disasters the „productivity effect‟.
Productivity effect occurring through the creative destruction mechanism can be charac-terized through the concept of mean capital productivity, Λ of an economy in a disaster aftermath scenario. For 𝜉𝑘 < 1, Λ represents the weighted average of old and new vin-tage capital productivities. Rate of change of Λ which is synonymous with the rate of technological progress (or vintage replacement) and is given by
𝑑Λ 𝑑𝑡 =
𝐼𝑛+𝜒𝐼𝑟
𝐾𝑡 (𝐴𝑡 − Λt) (12)
Where 𝜒 accounts for technological level of reconstructed capital. If 𝜒 = 1, the de-stroyed capital is replace with new vintage capital. This implies an increased rate of mean productivity change due to a larger effect of the positive productivity gap 𝐴𝑡 − Λt. In case 𝜒 = 0, old vintage is used for capital replacement implying no contribution of post disaster reconstruction to overall rate productivity change. Moreover, holding 𝜒 = 1 and/or 𝐴𝑡 > Λt true for most post disaster scenarios would require overly opti-mistic possibilities (Hallegate & Dumas, 2008). Reasons for this conclusion are as fol-lows:
1. Since the prime concern of producers is to restore production they will prefer not to invest in new technologies due to the possible requirement of adjustment to company organization and personnel training.
2. In many cases replacement of destroyed capital with old vintage is necessary in order to make use of non-destroyed capital
3. Resources occupied by reconstruction would slow down R&D and thus future prod-uctivity.
Therefore, Hallegate & Dumas (2008) conclude that disasters can have negative or neu-tral effect on growth at best.
These results can be slightly modified for agricultural sector. Since vintages are defined by fertile land available, destruction of such land would reduce productivity. As long as fertile land is unusable, agricultural growth will be adversely affected.
2.2.2.3 Summary of Theory
Solow-Swan model presents basic framework for analyzing changes in capital-labor ra-tios as well as (average) productivity. Schumpeterian-Steady state relation extends So-low-Swan model to include creative destruction while allowing for non-exogenous sav-ings rate. Finally, NEDyM combines both Solow-Swan model and creative destruction theory to comment on relevant investment decisions in post disaster scenarios. These three theories are interconnected but will present plausible explanations only for specif-ic disasters. Where one theory may fail, another may succeed.
3
Data
3.1
Variables
Two sets of variables are used for estimations. First set is sector growth variables. These variables were calculated from available percentage value added to GDP values to de-termined annual sector output levels. From these levels, rate of change or growth rate of sector was calculated. Sectors considered were agricultural and industrial. Growth rates were calculated as follows:
𝐺𝑠,𝑡 = (𝑣𝑎𝑙𝑢𝑒 𝑎𝑑𝑑𝑒𝑑 ∗𝐺𝐷𝑃)𝑡−(𝑣𝑎𝑙𝑢𝑒 𝑎𝑑𝑑𝑒𝑑 ∗𝐺𝐷𝑃)𝑡−1
(𝑣𝑎𝑙𝑢𝑒 𝑎𝑑𝑑𝑒𝑑 ∗𝐺𝐷𝑃)𝑡−1
where 𝑠 and 𝑡 denote sector and growth year.
Second group of variables are proxies for natural disaster intensity. For all countries they are defined as follows:
𝑁𝐷𝑡,𝑖𝑘 =𝑘𝑖𝑙𝑙𝑒𝑑𝑡,𝑖𝑘+0.3(𝑡𝑜𝑡𝑎𝑙 𝑒𝑓𝑓𝑒𝑐𝑡𝑒𝑑𝑡,𝑖𝑘) 𝑝𝑜𝑝𝑢𝑙𝑎𝑡𝑖𝑜𝑛 𝑡 + 𝑒𝑐𝑜𝑛𝑜𝑚𝑖𝑐 𝑑𝑎𝑚𝑎𝑔𝑒𝑡,𝑖𝑘 𝐺𝐷𝑃𝑡 (13) 𝑁𝐷𝑡𝑘 = 𝑁𝐷 𝑡,𝑖𝑘 𝐼 𝑖=1
Subscripts 𝑖, 𝑘 and 𝑡 represent annual number, type and year of the natural disasters. It should be noted that these intensity variables have been adjusted to population and GDP of the disaster year in order to remove any bias introduced by population and economic growths over time.
Types of disasters considered are droughts, storms, floods and earthquakes. For years with no disasters occurring 𝑁𝐷𝑡𝑘 takes the value of zero. Moreover, all 𝑖 = 1,2,3, … , 𝐼 are summed up in order to give the total magnitude of a 𝑘-type disaster for year 𝑡. As a matter of statistical simplicity, a disaster occurring in year 𝑡 is assumed to happen in the middle of the year, regardless of the actual date of occurrence.
Natural disasters are assumed to be exogenous shocks to an economy. This assumption may be weakened due to the endogenous nature of occurrence of natural disasters and exogenous nature of only the time of occurrence. This bias is removed by concentrating on a specific region where climatic and geological conditions at a given time are more or less similar.
3.2
Sources
All macroeconomic variables have been obtained from World Bank World Develop-ment Indicators.
All natural disaster values were obtained from Emergency Events Database (EM-DAT) maintained by Centre for Research on Epidemiology of Disasters (CRED). It contains records of around 17000 disasters occurring since 1900 till the present. The database
gathers information from different sources including governments, non-government profit organizations, UN agencies, research institutes and insurance firms.
Definition of a disaster as stated by CRED is “a situation or events which overwhelm local capacity, necessitating a request to a national or international level for external as-sistance; an unforeseen and often sudden event that causes great damage, destruction and human suffering.” For an disaster to be „captured‟ by EM-DAT at least one of the following conditions should be satisfied; 10 or more reported casualties; 100 or more reported affected; declaration of a state of emergency; or request for international assis-tance.
CRED divides disasters into several types (for example floods, storms, heat waves etc). Furthermore it provides the dates at which the disaster occurred and ended. Number of deaths in the database mainly includes people reported dead, presumed dead or con-firmed dead. People affected are those who required immediate assistance. People in-jured or homeless are also accounted for in the „people affected‟ values.
As far as the economic damages are concerned CRED admits that there is not set stan-dard benchmark for the credibility of information or procedure for determination of global economic impacts. In addition to that EM-DAT does not report economic dam-ages for all disasters it documents. Also, it has a more accurate account of certain disas-ter types than others.
Due to such wide range of sources used by EM-DAT it makes it hard to compare infor-mation from different sources. This issue may be a serious one since different sources may highlight or even over-state statistics depending on their purpose. However, as the number of international institutions increases, so does the degree of transparency and re-liability of available information.
4
Methodology
4.1
Model Specification
A Distributed-lag model estimated by Ordinary Least Squares is used for the empirical analysis (Gujarati, 2003). Since the purpose of this study is to track the time path of a disaster, the model uses lagged values of the disaster variable. The statistical model ap-plied is as follows:
𝑔𝑡𝑠 = 𝛽
0+ 𝛽1𝑁𝐷𝑡𝑘 + 𝛽2𝑁𝐷𝑡−1𝑘 + 𝛽3𝑁𝐷𝑡−2𝑘 + 𝑢𝑡 (15) Where,
𝑔𝑡𝑠 = growth rate of sector 𝑠 for year 𝑡 𝛽𝑛 = estimated coefficients
𝑁𝐷𝑡−𝑎𝑘 = intensity of a natural disaster of type 𝑘 occurring in year 𝑡 and 𝑎 is lag number with respect to year 𝑡
𝑢𝑡 = error term
Null and alternative hypotheses for determining disaster impact are as follows: 𝐻0: 𝛽𝑥 = 0 𝑛𝑜 𝑖𝑚𝑝𝑎𝑐𝑡 𝑓𝑜𝑟 𝑎 𝑔𝑖𝑣𝑒𝑛 𝑙𝑎𝑔
𝐻𝐴: 𝛽𝑥 ≠ 0
A significant coefficient would indicate a change in sectoral growth 𝑔𝑠 by 𝛽 percentage points. Consider the issue of lag length of disaster variable. As mentioned in the theo-retical framework, effects of a natural disaster, if there are any, should appear in the medium-short run if not in the short-run. Therefore, including lags 0, 1 and 2 for disas-ter variable is necessary in order to capture the desired growth effects. Moreover, consi-dering two lags allows the model to capture a so called delay effect10. Furthermore, rea-sons for not using information criterions for lag length selection are discussed in Section 4.2.
4.2
Robustness
The econometric model used for this study is robust in spite of its apparent overly par-simonious outlook. This section aims at addressing potential criticisms which may ques-tion the validity of empirical results.
Foremost concern which may be raised is that of lag length. Under normal circums-tances subjectively determined number of lags in the OLS model may either be mislead-ing or produce biased estimates. However, it should be noted that first, the choice of lag length for equation (15) is derived from the economic theory. Second, the Akaike In-formation Criterion generated for regressions of individual sector growth on individual
disaster variables suggested inclusion of either zeroth lag or at least fifth lag. Estimation of only zeroth lag growth would have presented only short-run response. On the other hand estimation of five lags would have not only made interpretation of coefficients even more cumbersome but also increased likelihood of biases like autocorrelation. In order to confirm that priori selection of lag length has not made estimators ineffi-cient, equation (15) was estimated with increased number of lag (up to lag 6). Signifi-cant coefficients were independent of lag length. Signs of coefficients were largely in-dependent of lag length as well but for
Another criticism may be absence of other exogenous shocks, such as terms of trade fluctuations and aid flows, to growth. Exclusion of such shocks was primarily due to the general consensus that external shocks account for a small portion of volatility in growth as compared to endogenous shocks. Although terms of trade shocks are the most pronounced ones, they do not alter the disaster impact captured by a regression similar in nature to equation (15) (Raddatz, 2009). In addition to that, aid flows have almost no effect on post disaster growth (Noy, 2009; Raddatz 2007; Raddatz 2009). An increase in aid flows due to disasters is also very unlikely due to certain investor behaviors. Instead reallocation of a constant flow of aid is more probable (Benson & Clay, 2004). Fur-thermore, factors such as initial indebtedness of the host country have also been found to be insignificant in its contribution to explaining disaster impact (Raddatz 2009). Due to the choice of the region for analysis, majority of countries considered are by de-fault in the category of developing with the exception of Japan. This allows credible cross country comparison while controlling for large variation in disaster impact de-pending upon the level of wealth of the host country (Raddatz, 2009).
Consideration of well-defined and focused regions also eliminates a potential bias in impact which would have otherwise been present due to an increased endogenous prob-ability of a specific disaster happening in a particular country due to its climatic or geo-graphic conditions (Jaramillo, 2009). This probability, of course, varies from country to country but is more or less the same within regions. This conjecture is confirmed by certain disasters (mostly floods and storms) being more frequent in a group of countries. It may also be argued that due to turbulent geopolitical history of southern and south-eastern Asian countries, disaster coefficients may be biased, providing an overestimated or spurious regression. It should be noted that due to consideration of such wide time span (1961-2006), the bias, if any, will be minimized. Incorporating endogenous politi-cal and institutional variables would not only be outside the scope of this study but also a tedious task.
4.3
Diagnostic Testing
Extensive diagnostic testing was conducted in order to make sure that the empirical re-sults were relatively free from biases and inefficiencies.
Null hypothesis were rejected for Jarque-Bera normality test, Breusch-Godfrey test and ARCH-LM (conditional heterscedasticity) test. All variables were tested for unit roots using Elder and Kennedy (2001) proposed strategies. All variables firmly rejected the
null hypothesis of a unit root as a result of Augmented Dickey Fuller test and showed no signs of deterministic trends. Therefore, all variables were stationary and the OLS. For most of the regressions the residuals were normally distributed since null hypothesis for Jarque Bera test could not be rejected. Moreover, autocorrelation among residuals was non uniform; Ljung-Box Q-test was rejected for the majority of countries.
5
Findings
Section 5 presents analysis of results in two subsections; Section 5.3 for empirical anal-ysis while Section 5.4 for theoretical analanal-ysis of results.
5.1
Statistical Significance
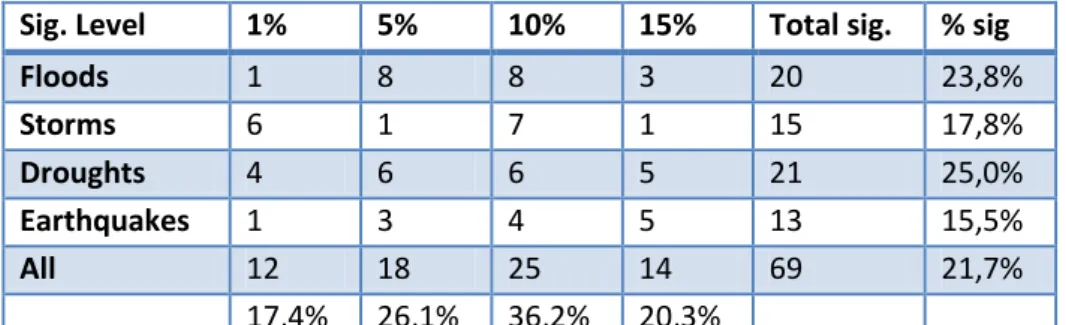
Before diving into the empirical analysis a discussion of statistical significance issues is in order. 15 percent significance level was used to reject the conventional null hypothe-sis that coefficient is equal to zero. Most of the estimated coefficients were insignifi-cant. To be precise out of 318 coefficient estimates only 69 (21.5%) were signifiinsignifi-cant. Moreover, majority (36.2%) of the significant coefficients were significant between 5% to 10% levels. Significance of coefficients is summarized in table 1.
A measure used to benchmark significance of different disasters is weighted average percentage11 of coefficients. It allocates more weight to more significant coefficients.
Table 1: Weighted Average Percentage of significant coefficients Sig. Level 1% 5% 10% 15% Total sig. % sig
Floods 1 8 8 3 20 23,8% Storms 6 1 7 1 15 17,8% Droughts 4 6 6 5 21 25,0% Earthquakes 1 3 4 5 13 15,5% All 12 18 25 14 69 21,7% 17,4% 26,1% 36,2% 20,3%
Mention of significance issues here is important since on several occasions during the analysis only the sign of the coefficients is considered regardless of their significance. It can be argued the insignificant coefficients for high frequency disasters present weak ef-fects rather than no efef-fects. This is true for floods and storms. Analysis for earthquakes and droughts on the other hand considers only the significant coefficients due to their very low frequency in some sample countries.
5.2
Regional Trends
Significance of disaster coefficients is concentrated not within countries (sectors) but within regions. This means that over all insignificance of regression results may be po-larized with one region yielding more significant results than the other. Such concentra-tion of significant impact varies from disaster to disaster. For instance significant effects of floods are mostly concentrated in the South Asian12 countries while being absent from South-eastern Asia13 countries with Fiji being the only exception. Results for droughts and storms are even more polarized. While impact of droughts in Eastern and Southern Asia are significant, such effects are absolutely absent from the South-eastern
11
See appendix for method of calculation
12 Pakistan, India, Bangladesh, Sri Lanka (also China, Japan and Korea)
regions with Guinea and Fiji being the only exceptions. The point of raising these issues is to highlight the variation on a regional level. This should also be kept in mind while analyzing effects of individual disasters.
5.3
Empirical Analysis
Empirical results of this study suggest that there is evidence to establish that natural dis-asters have a limited macro-economically quantifiable effect. They do have effects on economies but on a regional or localized level. Only small numbers of larger disasters yield significant results. Such obstacles make it hard to track the medium short run time path with decisive certainty. Conclusions, none the less, have been derived. As a general comment on the empirical results it can be said that droughts and floods have the strongest effects while earthquakes and storms have relatively insignificant (or weakly significant) effects.
The obtained results, regardless of sector and disaster, show signs of a „delay effect'. In this study the term „delay‟ refers to a persistent output growth (for lags 1 and 2) in a di-rection opposite to that in the disaster year (lag 0). The delay effects of the disasters have been positive as well as negative. It also facilitates meaningful interpretation of a large number of regression coefficient estimates which would otherwise be cumber-some. Delay effects for all countries are summarized in table 3. The only other paper to observe the delay effect, to the best knowledge of this study, is Loayza at al. (2009a). They, however, do not call it the delay effect, since their study was a panel study inves-tigating average effects and did not observe it on a large enough scale. This study
de-fines it as an effect due to its prevalence in many countries and sectors within those
countries. Causes of the delay effect can be:
1. Bias introduced due to the assumption that a disaster is taking place in the middle of a fiscal year. This would allow „real‟ disaster effects to be passed on to the next years‟ GDP.
2. Inter-secotral linkages: Impact on one sector being passed on to another.
3. Increase in import of disaster relief utilities or intermediate products for sectors. To produce the delay effect for specific sectors, such surge in imports should be tem-porary.
Moreover, a comparison of direct and indirect impact of disasters will also give us a qu-alitative measure of the extent of impact. Here a direct effect refers to that in zeroth lag, which is the disaster year, while indirect effect refers to that in the following lags i.e. lags 1 and 2.14 It is the measurement of indirect effect where the delay effect finds its most useful application. Heterogeneity of the delay effect i.e. presence of delay in only on sector rather than both would be an indication of indirect effects.
The study also finds evidence of heterogeneous sectoral-disaster impact. By heteroge-neous sectoral impact I mean non uniform growth response in different sectors. That is, positive effects in one sector while having negative ones in the other. Heterogeneous impact and delay effects are presented in table 2 below.
Disaster by disaster analysis of empirical re-sults is as follows.
5.3.1 Floods
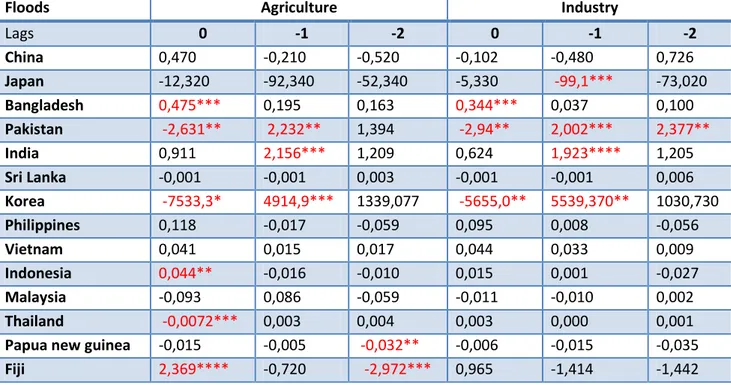
According to table 4, nine out of fourteen countries showed significant disaster coeffi-cients for at least one lag for any sector. The overall weighted average percentage of significant coefficients was 23.8%. Bangladesh, Pakistan, India and Korea showed very significant disaster coefficients for both sectors while south East Asian countries of In-donesia, Thailand, Guinea and Fiji showed moderately significant coefficients only for the agricultural sector. Japan was the only outliers showing significance for industrial sector only.
Table 3 shows an overall neutral zeroth-lag impact of floods in a set of 14 countries. This, however, is not the case. There is a considerable delay effect to suggest a predo-minant positive effect of floods, particularly in the agricultural sector; 6 countries showed the delay effect in agricultural sector while only 3 showed that in industrial sec-tor. These positive effects of floods are in agreement with Skidmore and Toya (2002) and Loayza et al. (2009a).
Existence of identical impact of floods in both sectors (for majority of countries) not on-ly suggests lack of indirect effects but also lasting and widespread direct effects of floods. It is possible that direct and indirect effects of floods may be indistinguishable. Such an inference is rational considering the causes and nature of floods. Most floods are a result of excessive rainfall and storms, both of which are normally localized but their by-product i.e. large amounts of water, is not. Moreover, in most Southern and South-eastern Asian countries there exist large networks of rivers and canals prune to water overflow. Therefore, another reason for significant effects may be proximity of large population and economic activity clusters to rivers and river deltas.
Considering the overall positive impact, the initial negative zeroth-lag response may be explained by temporary damage or physical conditions rendering production unfeasible. This temporary effect may also be due to seasonal nature of floods; they occur during
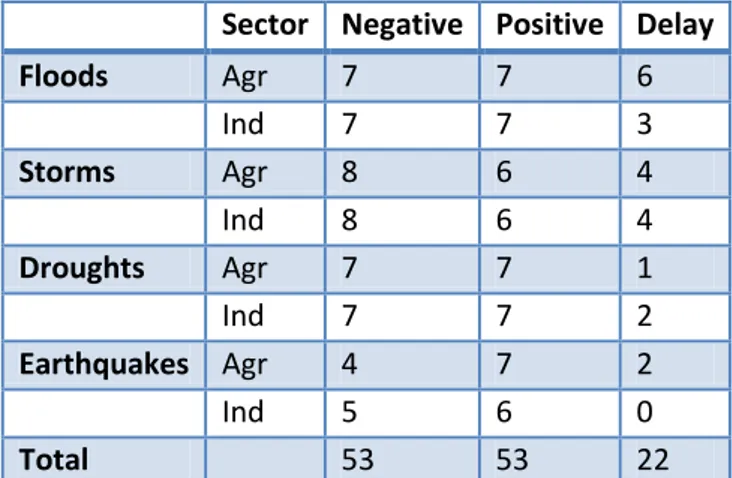
Table 3: Delay Effect Occurrence
Sector Negative Positive Delay
Floods Agr 7 7 6 Ind 7 7 3 Storms Agr 8 6 4 Ind 8 6 4 Droughts Agr 7 7 1 Ind 7 7 2 Earthquakes Agr 4 7 2 Ind 5 6 0 Total 53 53 22
Table 2: Heterogeneous Effects
Disaster Heterogeneous Impact Heterogeneous Delay Floods 2 4 Storms 4 6 Droughts 2 1 Earthquakes 3 2 Total 11 12 % 39% 43%
high-rainfall season normally in the latter part of the year. Positive effects can be attri-buted to increase in water reservoirs essential for agriculture and hydro electricity gen-eration.
Table 4: Coefficient Estimates for Floods15
Floods Agriculture Industry
Lags 0 -1 -2 0 -1 -2 China 0,470 -0,210 -0,520 -0,102 -0,480 0,726 Japan -12,320 -92,340 -52,340 -5,330 -99,1*** -73,020 Bangladesh 0,475*** 0,195 0,163 0,344*** 0,037 0,100 Pakistan -2,631** 2,232** 1,394 -2,94** 2,002*** 2,377** India 0,911 2,156*** 1,209 0,624 1,923**** 1,205 Sri Lanka -0,001 -0,001 0,003 -0,001 -0,001 0,006 Korea -7533,3* 4914,9*** 1339,077 -5655,0** 5539,370** 1030,730 Philippines 0,118 -0,017 -0,059 0,095 0,008 -0,056 Vietnam 0,041 0,015 0,017 0,044 0,033 0,009 Indonesia 0,044** -0,016 -0,010 0,015 0,001 -0,027 Malaysia -0,093 0,086 -0,059 -0,011 -0,010 0,002 Thailand -0,0072*** 0,003 0,004 0,003 0,000 0,001
Papua new guinea -0,015 -0,005 -0,032** -0,006 -0,015 -0,035
Fiji 2,369**** -0,720 -2,972*** 0,965 -1,414 -1,442
Seven countries in the data set experienced persistent but insignificant negative growth. In some cases such negative growth came with a delay effect. This may be explained by floods happening in the latter part of the year. This negative growth was significant only in Fiji at a 15% level, suggesting weak effects.
5.3.2 Storms
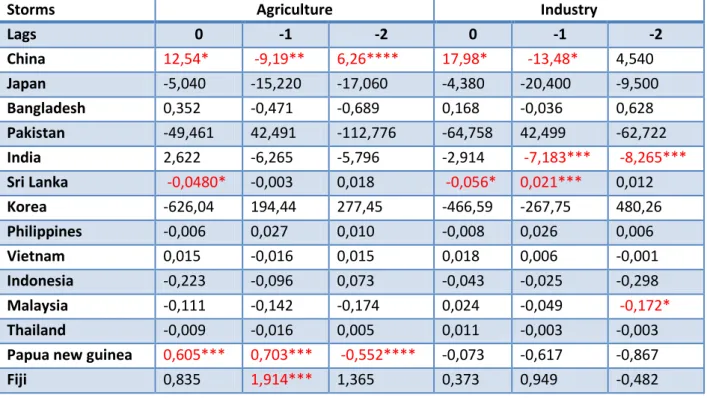
According to results presented in table 5, six out of fourteen countries showed signifi-cant disaster coefficients for at least one lag for any industry. Considering all regres-sions, storms have a weak effect in terms of number of significant coefficients; only 17.8% weighted average percent (table 1) of coefficients were significant. China and Sri Lanka showed significance for both sectors. India, and Malaysia and Guinea and Fiji obtained significant results for industrial and agricultural sectors respectively. Insignifi-cant (or weakly signifiInsignifi-cant) results for storms are in agreement with findings of Raddatz (2009) and Loayza et al. (2009a).
Table 3 shows a predominantly negative zeroth-lag effect of storms for both agricultural and industrial sectors with 8 countries showing negative growth response. Delay effect was found in 4 countries each for agricultural and industrial sectors. There are, however, outliers. China, Guinea and Fiji show very significant positive impact. These results in spite of being significant suggest ambiguous overall effect and are at odds with finding of Loayza et al. (2009a)
15 * 1% significance level, ** 5% significance level, *** 10% significance level **** 15%
Table 5: Coefficient Estimates for Storms16
Storms Agriculture Industry
Lags 0 -1 -2 0 -1 -2 China 12,54* -9,19** 6,26**** 17,98* -13,48* 4,540 Japan -5,040 -15,220 -17,060 -4,380 -20,400 -9,500 Bangladesh 0,352 -0,471 -0,689 0,168 -0,036 0,628 Pakistan -49,461 42,491 -112,776 -64,758 42,499 -62,722 India 2,622 -6,265 -5,796 -2,914 -7,183*** -8,265*** Sri Lanka -0,0480* -0,003 0,018 -0,056* 0,021*** 0,012 Korea -626,04 194,44 277,45 -466,59 -267,75 480,26 Philippines -0,006 0,027 0,010 -0,008 0,026 0,006 Vietnam 0,015 -0,016 0,015 0,018 0,006 -0,001 Indonesia -0,223 -0,096 0,073 -0,043 -0,025 -0,298 Malaysia -0,111 -0,142 -0,174 0,024 -0,049 -0,172* Thailand -0,009 -0,016 0,005 0,011 -0,003 -0,003
Papua new guinea 0,605*** 0,703*** -0,552**** -0,073 -0,617 -0,867
Fiji 0,835 1,914*** 1,365 0,373 0,949 -0,482
These weak effects of storms are strong enough to allow meaningful analysis. High dis-aster frequency, which is the case here, but insignificant effects suggest weak effects ra-ther than no effects. Overall, it may seem that storms have a rara-ther similar effect across sectors. But this may not be the case. Table 2 shows heterogeneous growth responses and heterogeneous delay effects for 4 and 6 countries respectively. These heterogeneous effects are the highest among disasters. Moreover, storms seem to have a larger impact in agricultural sectors.
The evidence above supports possibility of direct effects of storms being localized to the economic sector in which they occur. In this case their indirect effects in the sector other than the „impact sector‟ will have a short lived affect. Evidence for localization of direct effects is heterogeneity of sectoral impact in the zeroth lag coefficients. Evidence of short lived indirect effects due to inter sectoral linkages is heterogeneity of the delay ef-fect. In short, there is evidence suggesting that once a storm happens its direct effect is very limited and may only be passed on to other sectors through linkages.
Cases in point are Sri Lanka and India. Sri Lanka shows negative effects for agriculture for lag 0 and 1 and delay effect for the industry. Here it can be speculated that negative effects of a storm on the agricultural17 sector can reduce the supply of intermediate products for the industry thus adversely affecting industrial sector at least in the initial lags (Loayza et al 2009a). This is captured by delay effect present in the industrial sec-tor for Sri Lanka. Moreover, such short lived effects on industry may also be due to in-creased imports of intermediate products thus reducing the adverse effect passed on by
16 * 1% significance level, ** 5% significance level, *** 10% significance level **** 15%
signi-ficance level
the agricultural sector. India, on the other hand, has the opposite effect. It has a homo-geneous negative impact on industrial sector and a delay effect on the agricultural sec-tor. Here it can be argued that reduced demand from industrial sector suppresses agri-cultural output. There is a chance of an increase in agriagri-cultural exports.
Only other possibility to the above mentioned mechanisms is a homogenous impact in most of the disaster lags. In this case disaster effects would be profound enough to si-multaneously affect both sectors.
5.3.3 Droughts
A note of caution is in order before empirical results for droughts are presented. Fre-quency of droughts is very low in the sample countries. Six countries18 had two or less droughts occurring in the 45 year time span considered. Coefficients for these countries were insignificant as well.
Table 6: Coefficient Estimates for Droughts19
Drought Agriculture Industry
Lags 0 -1 -2 0 -1 -2 China 5,37** 4,41*** 4,40*** 4,94**** 2,055 2,665 Japan 6,960 -5,990 -26,36**** 2,230 -4,000 -30,95*** Bangladesh -1,918*** -1,232 2,452** -2,410* -1,105**** 0,365 Pakistan -8,79 6,15 -20,06 -10,65 6,68 -11,02 India -0,099 1,388** -0,113 0,122 0,319 0,476 Sri Lanka -94,98 -186,26 532,24 -470,81 -694,36 309,22 Korea 75,19 626,68 851,81 660,98 976,05 830,31 Philippines 0,082 0,068 0,091 0,038 0,208 0,072 Vietnam 0,000 0,002 0,008 0,012 -0,006 0,011 Indonesia 568,26 1388,40 -250,80 -244,08 342,49 -343,96
Malaysia -2,20E+07 -2,06E+07 -5,91E+07 -2,05E+07* 1,18E+06 4,61E+06
Thailand 0,002 0,023 2,710 0,004 0,009 0,612
Papua new guinea -9,06E+02 -1,19E+04* -5,82E+03**** -1,08E+04**** -1,22E+04*** -4,54E+03
Fiji -3,267** 2,360*** -2,824** -3,478* -0,464 -2,369**
According to table 6, seven countries showed at least one significant coefficient in any sector. Five of these countries showed very significant coefficients for both sectors while India and Malaysia were the outliers since they showed significance only for agri-cultural and industrial sectors respectively. All significant coefficients were negative with China and India being the only exceptions. Therefore, it can be argued that drough-ts have a negative effect on average. These resuldrough-ts are in agreement to those found by Loayza et al. (2009a). Weighted average percentage of significant coefficients was 25.0% which is the highest among the considered disasters.
18 Pakistan, Japan, Indonesia, Vietnam, Malaysia and Papua New Guinea
19 * 1% significance level, ** 5% significance level, *** 10% significance level **** 15%
Due to homogeneity of (negative) impact across sectors it can be inferred that droughts, like floods, have widespread and lasting effects. Furthermore, lack of delay effects sug-gests a longer duration and very strong effects. A plausible explanation for such homo-geneous effects (in the industrial sector) may be the temporary relocation of labor force due to reduction in food and water supplies.
5.3.4 Earthquakes
A note of caution is in order before empirical results for earthquakes are presented. Fre-quency of earthquakes is very low or absent in the sample countries. Six countries20 had less than two earthquakes occurring in the 45 year time span considered.
Table 7: Coefficient Estimates for Earthquakes21
Earthquakes Agriculture Industry
Lags 0 -1 -2 0 -1 -2 China -3,230 -1,390 -6,63** -5,090 1,520 -6,51**** Japan -4,290 -11,48*** -12,53*** -1,520 -11,97*** -11,11*** Bangladesh 1,905 -1,875 -2,778 4,859 3,378 -0,401 Pakistan 0,015 7,107 -16,609 0,400 7,983 -6,915 India 2,651 -12,462 9,006 -4,583 -1,041 5,230 Sri Lanka -0,000188 0,000927 0,000904 0,000 0,0025**** 0,001 Korea - - - - Philippines 0,409 0,220 -0,952** -0,020 0,013 -0,840** Vietnam - - - - Indonesia -2,478**** -0,217 0,742 -1,296 -1,411 -1,047 Malaysia 0,004 0,452* 0,007 0,003 0,001 0,001 Thailand 0,003 0,001 0,009 0,000 -0,001 0,004
Papua new guinea 0,083 0,128**** -0,127**** 0,177 0,001 -0,119
Fiji - - - -
According to table 7, seven out of eleven countries show significant coefficients for at least one lag for either of the sectors including Sri Lanka and Malaysia. China and Ja-pan show strongly negative growth response earthquakes for both sectors while Philip-pines shows weakly negative one. There are some significant positive responses, Guinea for instance, but are only present in agricultural sector. Overall negative effects of earthquakes is in agreement with Skidmore and Toya (2002)
Overall weighed average percentage of significant coefficients for earthquakes is 15.5%, lowest among all considered disasters. It can be said that earthquakes, on aver-age, have the weakest effect on both sectors. Overall insignificant effects (or limited significant effects) are in agreement with Loayza et al. (2009a) and Raddatz (2009). Positive significant effects found by this study do not find confirmation in previous
20 Sri Lanka, Malaysia, Thailand had one Earthquake each while Korea, Viet Nam and Fiji had no data on
Earthquakes.
21 * 1% significance level, ** 5% significance level, *** 10% significance level **** 15%
aster literature. Moreover, contrary to Loayza et al. (2009a), some scattered significant effects were found in the agricultural sector.
With the exception of China and Japan, earthquake impact seems to be not only spatial-ly localized but also very short lived. Absence of delay effect can be seen as evidence supporting this conjecture
5.4
Theoretical Analysis
Almost all qualitative results derived from the above analyses are firmly grounded in the theoretical growth framework. This section discusses empirical results in the context of theories presented in section 2.2.
Droughts have negative effects on both agriculture and industrial sectors. As mentioned before, their negative effect on agriculture may be due to reduction in water reservoirs, a necessary input for agricultural production. Depending upon their duration, they can al-so reduce agricultural productivity by reducing the fertility of land, rendering it useless at least temporarily. Furthermore, droughts normally entail labor migration, large scale in many cases, mainly due to food shortages.
According to Solow model, negative agricultural effects of droughts are valid since re-duction in amount of water and land mean lower agricultural productivity which shifts the production curve in Figure A4 down until water levels and land fertility have recov-ered; this means negative medium term agricultural growth. Solow model indirectly in-dentifies three mechanisms for negative industrial effects of droughts. First is reduction in intermediate product supply from agricultural sector. Second is an increase in capital-labor ratio 𝑘 since droughts cause large scale labor migration while leaving physical capital largely intact (Loayza et al., 2009b). NEDyM does not provide any theoretical basis for droughts.
Floods seemed to have a predominantly positive effect even in the industrial sector. For agriculture, floods disrupt regular agricultural production activities and damage infra-structure which reduces growth. Positive growth would primarily be due to abundance of water and increase in fertility of land (Loayza et al., 2009b). Thus, floods influence agricultural growth through mechanisms similar to those for droughts but opposite in di-rection by increasing quantity of raw materials (water) and introducing new capital vin-tages (land fertility).
Floods pass on their impact by increasing hydroelectricity generation and agricultural intermediate product supply for the industrial sector as well. Such positive effects be-come evident only in medium short run, not in the very short run. Therefore, it can be argued that there lies a threshold intensity for floods above which they may have a negative effect due to disruption of economic activity (Loayza et al., 2009). Negative fects of floods do not go against the prediction of Solow growth model since these ef-fects are due disruption of economic activity rather than capital destruction.
Negative effects of storms may be explained by destruction of infrastructure and disrup-tion of activities as well. Like floods there lies an intensity threshold here as well. Storms entail destruction physical capital which, according to Solow model, should usher in positive industrial growth. Contrary to this prediction this study finds only