BIM Use in the Production Process Among Medium Sized Contractors – A Survey of
Swedish Medium Sized Contractors
Anders Isaksson1, Henrik Linderoth2, Petra Bosch3, and Martin Lennartsson4 1) Ph.D. Assistant Prof, Chalmers university of Technology, Gothenburg, Sweden. Email:
anders.isaksson@chalmers.se
2) Ph.D., Professor, Jönköping University, School of Engineering, Jönköping, Sweden. Email: henrik.linderoth@ju.se 3) Ph.D., Assoc. Prof., Chalmers University of Technology, Gothenburg, Sweden. Email: petra.bosch@chalmers.se 4) Ph.D., Assistant. Prof., Jönköping University, School of Engineering, Jönköping, Sweden.
Email:martin.lennartsson@ju.se
Abstract:
Building Information Modelling (BIM) is claimed to transform the AEC industry, whereas current research has argued that diffusion of BIM use proceeds at a slower rate than the optimistic predictions. However, governmental initiatives where public clients in countries like Finland, Singapore, United Kingdom and Sweden start to require a Building Information Model as a part of the project delivery, are supposed to increase the pace of diffusion of BIM use. Today, larger contractor firms use BIM to a varying extent. But BIM use in mid-sized contractor firms, with 50 – 500 employees, which successfully can compete with larger contractors on projects up to 50 million Euros, is relatively unknown. The aim of the paper is to explore the current use and perceived challenges and driving forces of BIM-implementation among mid-sized contractors. The data used in this study is collected through a survey send to chief executive officers, or their closest sub-ordinates, of mid-sized construction firms in Sweden. The survey is based on a technology-, organization-, environment framework that is used in information systems research in order to study the use of inter-organizational information systems. The total population of firms in the survey is 136. The preliminary results presented in this paper are based on 31 answers (30 percent response rate).
58 percent of the respondents said that they have been involved in a project where BIM has been used in some way. The most commonly used application is visualization. The highest obstacles perceived are that partners are not using BIM, there is no demand from clients, and there is no internal demand in the company. For the two last obstacles there were significant differences between users and non-users. The most common perceived driving forces were that BIM is a means for following the technical development and BIM can give the company competitive advantages. Moreover, the results indicate that the main driver behind BIM-implementation is mainly determined by an individual’s subjective positive or negative evaluation of BIM, rather than by external pressure from clients and partners, or by internal capacity and knowledge to use BIM.
Keywords: BIM, adoption, use, implementation, medium sized contractors.
1. INTRODUCTION
BIM, (Building Information Modelling) has been an attentive topic among researchers and practitioners in the AEC industry (Architecture, Engineering and Construction Industry). BIM is claimed to be one of the most promising developments in the industry in terms of introducing significant changes for all stages of the construction process (see e.g. Eastman et al. 2011). The confidence in BIM, as a means for increasing efficiency in the industry is for example expressed by governmental initiatives in countries like Great Britain, Singapore, Finland and Sweden, where public clients require a Building Information Model as part of the project delivery. This development is supposed to increase the pace of diffusion of BIM-use. However, despite the optimistic predictions on BIM’s positive effects on the industry, a number of challenges are identified. Demian and Waters (2014), Hartman et al (2012), and Linderoth (2010) argue that the temporary nature of construction projects create challenges when BIM use diffuses to consecutive projects. Moreover, positive effects of BIM use have been questioned. Fox (2014) claims that expectations of BIM benefits may be too optimistic, Kang et al (2013) question whether claimed benefits of BIM have been fully achieved, Vass and Karrbom Gustafsson (2014) claim that BIM professional do not see any business value from BIM today, but it might appear in the future, and Becerik-Gerber and Rice (2010) claim that benefits of BIM use are difficult to evaluate with quantitative measures because claimed benefits are often intangible.
Thus, previous research has focused on identifying benefits of BIM use, but also identified obstacles and questions whether claimed benefits are achieved. However, if BIM would have a transformative effect on the industry, the use of BIM needs to diffuse in an encompassing and integrated mode among actors in the
construction process. The extent of BIM use and what its application field, is not studied to any lager extent. There are scattered success stories from single projects and a diffused discourse that technical consultants and larger contractors are using BIM. But BIM use among medium sized contractors with 50 – 500 employees is less explored. This group of companies are interesting to study because they can successfully compete with larger contractors on projects up to 50 million Euros, but they lack resources for in-house research and development, as the larger contractors. If delivering a BIM as a part of the contract becomes compulsory what happens with these companies’ competitive capabilities? Thus, the issue is how encompassing BIM use is among these companies, what do they use BIM for, and what facilitators and constraints are perceived? Accordingly, the aim of the paper is to explore the use and perceived challenges and driving forces of BIM-implementation among mid-sized contractors. In order to answer this aim, a survey was conducted among Swedish contractors with 50 – 500 employees.
2. UNDERSTANDING USE AND ADOPTION BIM
In order to develop a survey that should help fulfilling the aim of the paper, it is critical to conduct a purposeful literature review that should guide the design of the questionnaire. To inquire what BIM, is used for it is necessary to identify generic categories for BIM use. To identify perceived facilitators and constraints for BIM-use, the point of departure is taken from literature on adoption of information and communication technologies (ICT). At the bottom line, BIM is information and communication technology. Therefore, the wide body of literature in Information Systems research on adoption and use of ICT is needed to form the point of departure if a deeper knowledge on adoption and use of BIM should be acquired (see also Merchenbrock and Munkvold, 2012).
The use cases for BIM can be categorized from different perspectives, including the practical applications and more generic applications. A traditional classification of use has been the 3D-, 4D-, 5D-, and nD, where 3D represents classical visualization, 4D includes the time plan, and 5D the costs. It can be claimed that the nD-definition is an empirical based classification of the kind of data that can be retrieved and in turn gives rise to different applications. For example, by using information from the time plan (4D) and cost of material (5D), a plan for purchases and payments of materials can be generated. Moreover, studies of BIM-use have often concerned the application level, where clash control are the classical example, but other applications like BIM environmental classification has also been studied (see Wong and Kuan, 2014). If practical applications, or the kind of information that is retrieved from the model are discussed, different actors are interested in different applications (data). For example, using the model for maintenance of facilities is a crucial concern for the facility manager, whereas clash controls are of crucial interest for contractors. Moreover, BIM use can be classified on a more conceptual level after its capabilities (see also Carlo et al, 2012). This is, BIM can be used for 3D visualization, analysis and simulation, co-ordination and communication, and data extraction and transfer. These capabilities are in turn build up by two underlying capabilities: object based information and xyz co-ordination that helps to accurately triangulate the geometric position of each object in the design space.
The next issue is how perceived facilitators and constraints for adoption and use of BIM among medium sized contractors can be understood. When adoption of ICT has been studied, a wide range of theoretical frameworks has been applied to explain adoption and use of ICT. Some of these are the technology acceptance model (institutional theory, and social identity (Gal et al.2008).
In order to inquire why technology is used or not, a few research streams can be identified in quantitative research: perceived usefulness and user satisfaction are two prominent research streams in quantitative research. In the research stream on perceived usefulness the so called Technology Acceptance Model (TAM) (see Davies, 1989) has been widely used. TAM origins can be found in the theory of reasoned action (TRA) (Ajzen and Fishbein, 1980) and later by the theory of planned behavior (TPB: Ajzen, 1991). Simply put, TRA/TPB states that ‘behavioral intention’ and subsequent behavior is a function of an individual’s attitude towards the behavior - in this case, technology use- and his/her perception of the subjective norms promoting the behavior. A subjective norm is ‘a person’s perception that most people who are important to her/him think s/he should, or should not perform the behavior in question’ (Fishbein and Ajzen, 1975, p. 302). However, TAM focuses on the intentions of the individual actor in order to understand ICT impacts. But in the literature drawing on TAM, impacts on the individual level have been regarded as antecedents to organizational impacts (e.g., Fishbein and Ajzen, 1975).
In the user satisfaction stream object-based perceptions about the ICT are investigated, whereas TAM investigates behavioral perceptions about using ICT (Wixom and Todd, 2005). In a comprehensive literature
example: performance effectiveness (Rai et al., 2002); decision-making (Vlahos and Ferratt, 1995; Vlahos et al., 2004); and job satisfaction (Ang and Soh, 1997; Morris et al., 2002). In the user satisfaction literature, information- and system quality are major antecedents to user satisfaction and their relation to user satisfaction is strongly supported (see Iivari, 2005). Information quality is described as a desirable characteristic of the ICT system’s output incorporating for example, relevance, accuracy, comprehensibility and usability (Petter et al., 2008).
In the two research streams of perceived usefulness and user satisfaction the focus is on the single user and his/her perceptions of the system and how it affects the job, and an implicit assumption is that perceived positive effects on the job leads to net benefits for the organization. These dimensions are important in order to understand the use of BIM (see Davies and Harty, 2013). BIM can be considered as an inter-organizational system (IOS), or inter-organizational information system (IOIS), this is a system that is used for information exchange between members of two or more organizations. Thus, factors outside the immediate perceptions of the system and how it affects the job need to be taken into consideration. In research on adoption of inter-organizational systems three factors are identified which shape the adoption of IOS: nature of technology, or perceived benefits, capability of organization and external environment (e.g., Grover, 1993; Iacovou et al., 1995; Mishra et al., 2007; Zhu et al., 2003). This framework has also been labelled as the technology, organization, and environment framework (see Henderson et al, 2012). The technology factor captures the dimensions studied in the perceived usefulness and user satisfaction stream, whereas the organizational factors capture the firm’s ability to accommodate the system, and the environmental factor captures environmental pressures, and, or facilitators for adoption of technology.
An underlying assumption in the technology, organization, and environment framework is that the adopting firms are just passive victims of the technology, and therefore, the approach is most suitable for smaller industry players because they are more passive then larger enterprises when it comes to adoption of new technologies (Kurnia and Johnston, 2000). The actions of smaller firms are usually determined by the nature of the technologies, their capabilities, and external forces like for example pressure from other more influential trading partners (Iacovou et al, 1995). In this sense the framework can be useful for studying adoption of BIM among medium sized contractors.
3. METHOD
The data used in this study is collected through a telephone survey to CEOs of mid-sized contractor firms in Sweden. The target population for our study was mid-sized contractor firms, with 50 to 500 employees. Firms belonging to this group was first identified through the membership directory of the Swedish Construction Federation (the trade association for private construction companies in Sweden). Secondly, we did a search based on industry codes in the Retriever Business, a database containing financial information on every limited liability firm in Sweden. After a manual screening of our list of firms, deleting firms that had terminated, could not be seen as a contractor or by any other reason did not belong to our target population the total population consisted of 104 contractor firms.
A preliminary version of the questionnaire was tested with potential respondents and also discussed in the reference group. The final questionnaire was then controlled and scripted by the TNS sifo, who performed the interviews with our respondents. The survey was collected over telephone by one of Sweden’s largest and most respectable marketing research companies (TNS-Sifo). By using an external professional research firm our studies validity and reliability was improved through several levels of quality control of our data collection process. To increase the validity of our measures our questionnaire was doubled checked with regards to language and easiness of understanding the questions by TNS-Sifo. Inter-rater reliability are increased by using randomly selected, experienced professional callers. To ensure consistency and quality of responses the interview process are monitored and taped. If there would have been any problems with the manuscript (e.g. misunderstandings etc.) this would have been captured in the monitoring process.
Of the total population of 104 firm we manage to collect answers from 31 firms (30 percent response rate). An analysis (t-test) of non-respondents vs. respondents using annual report data (number of employees, turnover and total book value of assets) did not reveal anything that indicated that the respondents differed from the total sample. Table 1 contains descriptive statistics of sample and respondents, together with a t-test of mean differences between groups (respondents vs. non-respondents.).
Table 1. Descriptive statistics and analysis of non-respondents
Ratio Group N Mean Min Max Std.Dev Sig.
Number of Employees Population 104 95 40 285 49 Non-respondents 73 98 50 246 46 Respondents 31 86 40 285 56 0,559 Turnover in 000 SEK Population 104 352,885 68,227 1,309,453 296,076 Non-respondents 73 377,571 71,287 1,309,453 300,873 Respondents 31 294,755 68,227 1,100,064 280,600 0,573 Total assets in 000 SEK Population 104 202,617 14,752 2,559,792 367,617 Non-respondents 73 211,760 16,582 2,559,792 398,341 Respondents 31 181,089 14,752 1,396,886 287,201 0,919 3.1 Variable Measurement
The survey contained question regarding if and how BIM is used and what the main driving forces and/or obstacles for their use (or non-use) of BIM are perceived. In order to measure the use and perceived challenges (obstacles) and driving forces of BIM-implementation, a questionnaire was designed with three sets of questions, one set covering activities, a second covering obstacles and a third covering driving forces.
The process of designing the questionnaire followed several interlinking steps. Initially, several interviews were performed with company visits and discussions of BIM with potential users on different levels in small and medium-sized construction companies. A reference group for the research project was also formed with representatives from the industry, who also contributed with input throughout the design stage of the questionnaire. Based on this a list of BIM use (activities) and challenges and driving forces where derived during a series of meetings with the research group.
The theory of planned behavior, TPB (Ajzen, 1991), was used as a theoretical foundation in order to capture relevant dimensions of driving forces to use BIM. TPB is one of the most influential and popular conceptual frameworks for the study of human action. According to TPB, human action - or in our case the use of BIM- is driven by three kinds of considerations: attitudes towards the action, subjective norms, e.g. normative expectations of other, and perceived behavior control – e.g., control beliefs. In our questionnaire we therefore constructed questions or statements around these three dimensions. Attitudes: what we think about BIM. Four statements were defined: We perceive a strong internal demand for BIM; We believe that BIM should give us competitive advantages; We believe that BIM would be of strategic importance to the company; By using BIM we can follow the technical development.
Subjective norms: Outside pressure to use BIM. Three statement where constructed to cover this dimension: BIM was a clear demand from our clients; All our partners use BIM; BIM has become a standard in our environment.
Perceived behavior control - internal capacity and knowledge to use BIM. Three statement were constructed to cover this dimension: We have enough internal competence to use BIM; We have a good network of externa actors who supports the use of BIM; It is easy to implement and use BIM.
4. RESULTS
58 percent of the respondents said that they have been involved in a project where BIM has been used in some way. 39 percent stated that they never have been involved in such a project and 3 percent did not know. For the respondents that have used BIM, we asked them questions regarding the extent of BIM usage for different activities. The results are presented in table 2.
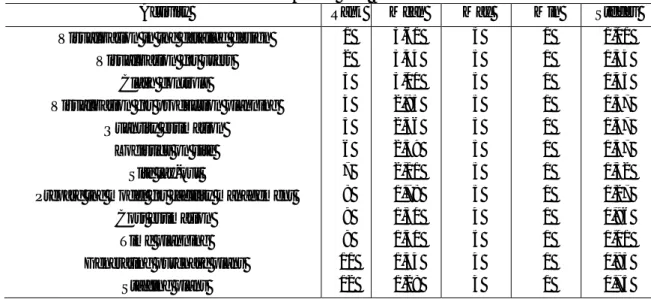
Table 2. To what extent is BIM used for the following activities. Answer on a scale from 1 (never use) to 5 (always use).
Activity Rank Mean Max Min Stddev
Visualization in the detailed design 1 3,61 5 1 1,01
Visualization for users 2 3,44 5 1 1,34
Clash controls 3 3,00 5 1 1,45
Visualization for production planning 4 2,83 5 1 1,57
Quantity estimation 5 2,56 5 1 1,57
Logistics on site 6 2,39 5 1 1,57
Site lay-out 7 2,11 5 1 1,52
Prepare the model for facility management 8 1,78 5 1 1,27
Cost estimation 9 1,50 4 1 0,96
Time planning 9 1,50 5 1 1,01
Generating purchase plans 11 1,44 4 1 0,83
Staffing plans 12 1,28 4 1 0,73
From the answers it becomes rather clear that BIM’s visualizing capabilities are used the most frequently. What is a bit surprising is that clash controls are only the third most used application. However, respondents might have had the production stage in mind and because visualization in the detailed design is the most used application, it is possible to speculate that clashes in field installations are reduced due to visualization in the detailed design. Furthermore, it is worth to note that there is a rather high frequency of use of each application, in some companies in the sample, which is indicated by the “Max” values in table 2.
Next, we asked the respondents what they see as the main obstacles for using BIM. These results are presented in table 3, and four major obstacles crystalized. The biggest obstacles for using BIM can be identified in the contractors’ environment, either clients do not demand BIM, or partners do not use BIM. However, there is a significance in the strength of this perceived obstacle between users and non-users (see table 4). The perceived difference in demands from clients might be explained by the fact that users has been involved in projects where clients have had some kind of demand for BIM; whereas non-users not yet have been involved with clients demanding BIM. Furthermore, it is interesting to note that investments in hard- and software are perceived as one of the major obstacles. Among the users it was even perceived as the biggest obstacle. This is somewhat puzzling because it can be claimed that the initial step for contractors to start with BIM is rather low. This is, by downloading a viewer it would be possible for contractors to start to explore the visualizing capabilities of BIM.
The fourth perceived obstacle is a lack in internal demand in the company. However, here significant differences can be found between users and nonusers (table 4). This obstacle has the highest rank among the non-users, whereas it is of less importance among the users. Finally, there was a significant difference between users and non-users in the perceived obstacle “Partners do not always give access to the 3-D model” (table 4). The scores indicate that the obstacle needs to be taken into consideration, but non-users might slightly exaggerate the obstacle.
When it comes to the driving forces for adopting and using BIM, the technology is first and foremost seen as a means for following the technical development and something that can give a competitive advantage (table 5). What is interesting to note is that non-users do not agree on any of the statements of the perceived driving forces for BIM-adoption. However, some of the non-users see BIM as a means to follow the technical development, but they hardly perceive BIM as something of strategic importance or something that, at the moment, can give the company some competitive advantages. Furthermore, are there significant differences in the perceptions of five of the ten driving forces, and these driving forces are considered more or less important among the users. Finally, the major obstacles for implementing BIM in terms of low use among partners and no demand from clients, are further confirmed, because driving forces of the environment are considered to have a low importance.
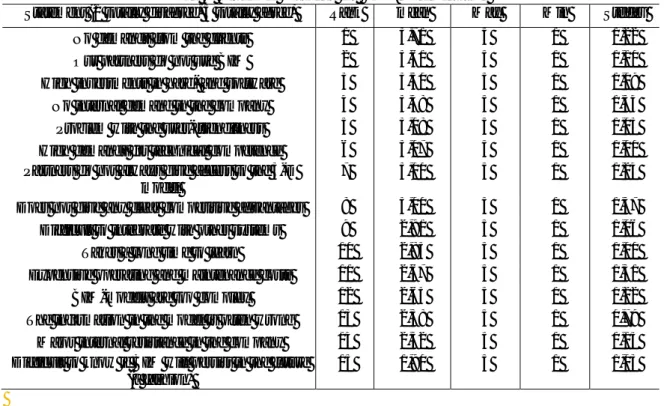
Table 3. Perceived obstacles for BIM-implementation
Statement (1 totally disagree, 5 totally agree) Rank mean Max Min Stddev
No demands from the clients 1 3,71 5 1 1,22
Our partners do not use BIM 2 3,61 5 1 1,10
High investments in hard- and software 3 3,50 5 1 1,09
No internal demand in the company 4 3,48 5 1 1,34
Problem with the user-friendliness 5 3,08 5 1 1,03
High demands for technical competence 6 3,07 5 1 1,00
Partners do not always give access to the 3-D model
7 3,00 5 1 1,24
Does not give any clear competitive advantages 8 3,00 5 1 1,37 Difficult to integrate with other systems 9 2,91 5 1 1,06
Takes a long time to learn 10 2,83 5 1 1,00
Expensive operating and maintenance costs 11 2,67 5 1 1,31
BIM-models are too complex 12 2,63 5 1 1,22
The information in the model is often wrong 13 2,38 5 1 0,79
Major internal resistance in the company 14 2,32 5 1 1,15
Difficult to know if BIM will persist in the future (a fashion)
15 1,90 5 1 1,03
Table 4. Perceived obstacles for BIM-implementation, significant differences between users and non-users
Statement Mean users Mean non-users P value
No demands from the clients 3,11 4,54 p < .005 No internal demand in the company 2,67 4,62 p < .0005 Partners do not always give access to the 3-D
model
2,65 3,67 p < .05
Table 5. Perceived driving forces for BIM adoption and use among users and non-users Statement (1 totally disagree, 5 totally agree) Rank
Mean total sample Mean users Mean non users p-value By using BIM we can follow the technical
development
1 3,57 4,00 2,80 p < ,005
We believe that BIM should give us competitive advantages
2 3,00 3,67 2,08 p < ,0005 We have enough internal competence to use
BIM
3 2,87 3,17 2,46
We believe that BIM would be of strategic importance for the company
4 2,81 3,33 2,08 p < ,05
We have a good network of external actors who support the use of BIM
5 2,77 2,88 2,62
It is easy to implement and use BIM 6 2,66 2,88 2,38
All our partners use BIM 7 2,13 2,35 1,85
We perceive a strong internal demand 8 2,06 2,67 1,23 p < ,0005 BIM was a clear demand from our clients 9 2,03 2,00 2,08
BIM has become a standard in our environment
5. DISCUSSION
When the applications for BIM-use are closer scrutinized, it becomes obvious that BIM’s visualizing capabilities are the most commonly used, compared to the capabilities of analysis and simulation, co-ordination and communication, and data extraction and transfer. However, the visualizing capabilities might also be considered as a proxy for the co-ordination and communication capabilities, because visualization capabilities might be used for facilitating co-ordination and communication.
When it comes to the obstacles for using BIM, environmental variables are perceived as the main obstacles, these are: no demands from the clients, and non-existing use among partners. It might be somewhat surprising that non-use among partners is perceived as a major obstacle, because medium-sized contractors are often co-operating with the same partners as larger contractors who use BIM. The question can be raised if some of the partners are working with BIM, or 3D-models, but this might not be communicated to the mid-sized contractors, or they do not demand BIM? The lack of an internal demand as a driving force for BIM use (see table 5) might indicate that the question whether partners use or do not use BIM is never raised.
Organizational resources are considered as another obstacle in terms of investments in hard and software, and technical competence. However, the perception on high investments in hard- and software is a bit puzzling. The major investments in “BIM-equipment” would be made by technical consultants and the perception might be grounded in an opinion that the company’s computer capacity needs to be upgraded if it would be possible to use BIM. But, high investments in hard- and software are perceived as the greatest obstacle among the users. This indicates that users perceive that investments in hard- and software are needed for a more encompassing use of BIM.
The major driving force for adopting BIM is that companies perceive that they can follow the technical development. In one sense, this is an interesting result when taking into consideration that advocates for BIM see it as a process that will have a significant impact on the industry (e.g. Eastman et al, 2011. This view on BIM, as a technical tool, can also be traced when the major application of BIM is taken into consideration; a tool for visualization. However, the perception that BIM can pr*ovide the company with a competitive advantage contributes to a more multi-faceted view on BIM. Moreover, does the low score regarding competitive advantage for non-users raise the question how these companies perceive public clients discussions that BIM would be a compulsory part of the project delivery?
6. CONCLUSIONS
It is concluded that more than half of medium sized contractors in the sample are using BIM in some projects. The use is foremost limited to utilizing BIM’s visualizing capabilities. Looking at table 5, a couple of observations stand out. Statements that are measuring subjective norms, i.e., external pressure, are given the lowest scores and statements that are measuring attitudes, i.e. what they think about BIM, are awarded the highest scores. This indicates that the main driver behind BIM-implementation is primarily driven by individual’s subjective positive or negative evaluation of BIM, rather than by external pressure from clients and partners, or by internal capacity and knowledge to use BIM.
ACKNOWLEDGMENTS
The authors of the paper would like to thank Jönköpings läns byggmästareförening, Center for Management of the Built Environment, and The development fund of the Swedish Construction Industry (SBUF) for their financial support of the study.
REFERENCES
Ajzen, I. (1991). The theory of planned behavior, Organizational Behavior and Human Decision Processes, 50 (2), 179–211.
Ajzen, I. and Fishbein, M. (1980). Understanding Attitudes and Predicting Social Behavior, Prentice Hall, Englewood Cliffs, NJ.
Ang, S. and Soh, C. (1997). User information satisfaction, job satisfaction, and computer background: an exploratory study, Information & Management, 32 (5), 255–266.
Becerik-Gerber, B. and Rice, S. (2010). The perceived value of building information modelling in the US building industry, ITcon, 15, 185-201.
Carlo, J.L., Lyytinen, K. and Boland Jr., R.J. (2012). Dialectics of collective minding: Contradictory appropriations of information technology in a high risk project, MIS Quarterly, 36 (4), 1081-1108. Davis, F.D., (1989). Perceived usefulness, PEOU and user acceptance of information technology, MIS
Davies, R. and Harty, C. (2013). Measurement and exploration of individual beliefs about the
consequences of building information modelling use, Construction Management and Economics, 31, 1110-1127.
Demian, P. and Walters, D. (2014). The advantages of information management through building information modelling, Construction Management and Economics, 32, 1153-1165.
Eastman, C. M., Teicholz, P., Sacks, R. and Liston, K. (2011). BIM handbook: A guide to building information modelling for owners, managers, designers, engineers and contractors. John Wiley & Sons, Hoboken New Jersey.
Fishbein, M. and Ajzen, I. (1975) Belief, Attitude, Intention and Behavior: An introduction to Theory and Research, Addison-Wesley, Reading, MA.
Fox, S (2014). Geeting real about BIM International Journal of Managing Projects in Business, 7, 405-422. Hartmann, T., Van Meerveld, H., Vossebeld, N. and Adriaanse, A. (2012). Aligning building information
model tools and construction management methods, Automation in Construction, 22, 605-613. Gal, U, Lyytinen, K, and Yoo, Y (2008) The dynamics of IT boundary objects, information infrastructures,
and organisational identities: the introduction of 3D modelling technologies into the architecture, engineering, and construction industry, European Journal of Information Systems, 17(3), 290-304. Grover V. (1993). An empirically derived model for the adoption of customer-based interorganizational
systems, Decision Science, 24 (3): 603–40.
Henderson, D., Sheetz, S.D., and Trinkle, B.S. (2012). The determinants of inter-organizational and internal in-house adoption of XBRL: A structural equation model, International Journal of Accounting Information Systems 13, 109–140.
Iacovou, C.L., Benbasat I., and Dexter, A.S. (1995). Electronic data interchange and small organizations: adoption and impact of technology, MIS Quarterly, 19 (4):465–85.
Iivari, J. (2005). An empirical test of DeLone-McLean model of information systems success, The DATA BASE for Advances in Information Systems, 36 (2), 8–27.
Kang, Y., O'Brien, W.J. and O'Connor, J.T. (2012). Analysis of information integration benefit drivers and implementation hindrances, Automation in Construction, 22, 277-289.
Kurnia, S., & Johnston, R. B. (2000). The need for a processual view of inter-organizational system adoption. Journal of Strategic Information Systems, 9, 295–319.
Linderoth, HCJ. (2010). Understanding adoption and use of BIM as the creation of actor networks, Automation in Construction, 19 (1), 66-72.
Merschbrock, C. and Munkvold, B. E. (2012). A Research Review on Building Information Modeling in Construction―An Area Ripe for IS Research, Communications of the Association for Information Systems, 31, 207-228.
Mishra, A., Konana, P., and Barua, A. (2007) Antecedents and consequences of internet use in procurement: an empirical investigation of U.S. manufacturing firms, Information Systems Research, 18 (1), 103– 20.
Morris, S.A., Marshall, T.E. and Rainer Jr, R.K. (2002). Impact of user satisfaction and trust on virtual team members, Information Resources Management Journal, 15 (2), 22–30.
Orlikowski, W.J. (1992). The duality of technology: rethinking the concept of technology in organizations,
Organization Science, 3 (3), 398–427.
Petter, S., Delone, W., McLean, E. (2008). Measuring information systems success: models, dimensions, measures, and interrelationships, European Journal of Information Systems, Jun2008, 17 (3), 236-263.
Rai, A., Lang, S.S. and Welker, R.B. (2002). Assessing the validity of IS success models: an empirical test and theoretical analysis, Information Systems Research, 13 (1), 5–69.
Vlahos, G.E. and Ferratt, T.W. (1995). Information technology use by managers in Greece to support decision making: amount, perceived value, and satisfaction, Information & Management, 29(6), 305–15.
Vlahos, G.E., Ferratt, T.W. and Knoepfle, G. (2004). The use of computer-based information systems by German managers to support decision making, Information & Management, 41(6), 763–79. Wixom, B.H. and Todd, P.A. (2005). A Theoretical Integration of User Satisfaction and Technology
Acceptance, Information Systems Research, 16(1), 85-102.
Wong, J. K-W. and Kuan, K-L. (2014). Implementing ‘BEAM Plus’ for BIM-based sustainability analysis, Automation in Construction, 44, 163-75.
Zhu, K., Kraemer, K.L., and Xu, S. (2003). E-business adoption by European firms: a cross-country assessment of the facilitators and inhibitors, European Journal of Information Systems, 12 (4),