School of Innovation, Design and Engineering
Demand Driven Material
Requirements Planning
Master thesis work
30 credits, Advanced level
Product and process development Production and Logistics
ABSTRACT
Manufacturing industries used to develop their operation strategies focusing on cost of manufacturing, high volume production and stabilizing the customer demand. But due to advancements in technology and evolving customer needs, the market demand became highly volatile, dynamic and customers expected customization, low volume products and faster deliveries. This evolution in customer needs has pushed the companies to improve their operating systems to be more flexible, agile and adaptable to market’s dynamic character. In order to effectively evolves themselves and achieve more flexibility, manufacturing companies had to implement effective manufacturing, planning and control systems.
The first break through in planning systems came in the year 1975 where a systemic approach called material requirements planning was introduced by Orlicky. MRP has become the global for production planning and inventory management in manufacturing industries. Later, over the years, research on the planning systems has brough modifications in MRP and it was evolved into closed loop MRP. Further into late 1980’s availability of technology led to an introduction of new evolved system called the Manufacturing resource planning which resulted in a holistic approach in material planning involving, financial and accounting functions which improved the planning efficiency. Further advancement in technology resulted in advanced planning systems like Enterprise resource planning and Advanced planning and scheduling.
On the contrary, though there has been a lot of advancement in technology and effective production planning methods, there are still discrepancies in obtained results when compared to theory. This is because, the existing systems were based on either solely on push production or pull production strategy. There is a lack of hybrid system which includes the positives of both production strategies and negate the MRP conflict.
However, in the year 2011, a new concept called demand driven material requirements planning was introduced by Ptak & Smith, which was a fusion of the core MRP, theory of constraints and Lean principles. Since the introduction DDMRP has seen a increase in implementation across industries which claimed a significant improvement in performance, on-time delivery, reduction in inventory and reduced stock outs. DDMRP has received very less attention in academia due to lack of awareness among researchers and industries. A literature review approach was used to collect and analyze the data on DDMRP and its advantages. The objective of this thesis was to shed light on the process of DDMRP, its pros and cons in implementing the new material planning system.
Keywords: Material planning, MRP, Manufacturing resource planning, ERP, Lean, DDMRP
ACKNOWLEDGEMENTS
I want to express my appreciation and thanks Mr. Yuji Yamamoto, my supervisor at MDH for his help and advice during the thesis.
Contents
1. INTRODUCTION ... 6
1.1. BACKGROUND ... 6
1.2. PROBLEM FORMULATION ... 8
1.3. AIM AND RESEARCH QUESTIONS ... 9
1.4. PROJECT LIMITATIONS ... 9
2. RESEARCH METHOD ... 10
2.1. RESEARCH METHOD ... 10
2.2. LITERATURE REVIEW ... 11
2.3. DATA ANALYSIS ... 11
2.4. VALIDITY AND RELIABILITY ... 12
3. THEORETIC FRAMEWORK ... 13
3.1. MANUFACTURING PLANNING AND CONTROL (MPC) ... 13
3.2. PLANNING,EXECUTION AND CONTROL ... 14
3.3. MRP NERVOUSNESS AND SUPPLY CHAIN BULLWHIP EFFECT ... 15
3.4. DECOUPLING AND DECOUPLING POINTS ... 15
3.5. MASTER PRODUCTION SCHEDULE (MPS) ... 16
3.6. MATERIAL REQUIREMENT PLANNING SYSTEM ... 16
3.6.1. MRP Inputs and Outputs ... 17
3.6.2. Cons of MRP ... 17
3.7. MANUFACTURING RESOURCE PLANNING (MRPII) ... 19
3.7.1. Pros of MRP II ... 21
3.8. JUST-IN-TIME (JIT) ... 21
3.9. THEORY OF CONSTRAINTS (TOC)... 22
3.10. ENTERPRISE RESOURCE PLANNING (ERP) ... 23
3.11. DEMAND DRIVEN MANUFACTURING RESOURCE PLANNING (DDMRP) ... 25
3.11.1. Components and steps for implementation of DDMRP ... 27
3.11.2. Shortcomings of DDMRP and its effects ... 32
4. ANALYSIS ... 34
5. CONCLUSIONS AND RECOMMENDATIONS ... 42
6. DISCUSSION ... 44
ABBREVIATIONS
ADU Average daily usage
APS Advanced planning and scheduling
ASRLT Actively synchronized replenishment lead time
BOM Bill of material
CLT Cumulative lead time
CSF Critical success factors
DLT Delivery lead time
DDMRP Demand driven material requirement planning
ERP Enterprise resource planning
IO Map Intermediate objective map
JIT Just in time
MAX Maximum
MIN Minimum
MLT Manufacturing lead time
MOQ Minimum order quantity
MPC Manufacturing planning and Control
MRP Materials requirement planning
MRPII Manufacturing resource planning
NFP Net flow position
OMAX Over maximum
OTOG Over top of green
OUT Stocked out
ROI Return of investment
TOC Theory of constraints
TOCSCRS Theory of constraints supply chain replenishment systems
TOR Top of red
TOY Top of yellow
1. INTRODUCTION
This section of thesis presents the background of the problem, the aim of the study, formulated research questions, scope and limitations of the research.
1.1. Background
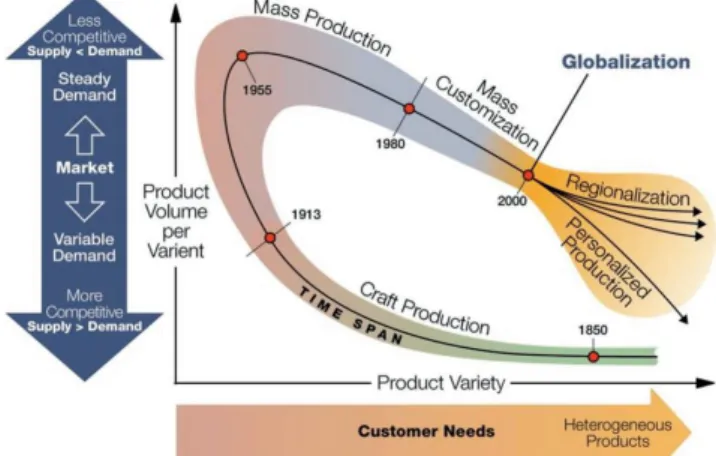
Before four decades from now, the driving force for companies was cost of manufacturing and all their strategies were based on high-volume production, cost minimization and achieving stable demand conditions. However, from the 1980’s, quality and satisfying customer needs has given a competitive edge in manufacturing industry (Kortabarria, et al., 2018). To achieve this advantage, companies had to work on operations of their supply chain network to obtain an optimization among various objectives which include on time delivery, reducing lead times, optimized work in progress(WIP) resulting in reducing costs of final product (Miclo, et al., 2016). In order to adapt to these changes, companies had to bring a paradigm shift in their ways of working to create a dynamic production environment where frequent changes in products, processes and production schedule can take place (Kortabarria, et al., 2018). Process of adapting to the change has created an immense pressure on companies to lower total conversions costs of entire supply chain, reducing throughput times, close to zero inventories, multiple products and customizable choices, more reliable delivery systems to ensure right and on time delivery, maximizing customer satisfaction through better service and improving quality (Cox & Schleier, 2010).
Figure 1.1 Evolution of production systems (Koren, 2010)
Throughout manufacturing related literature many researchers have coined various ways of attaining the competitive edge. Barney & Clark (2007) viewed competitive advantage as economic net value gained which is calculated based on the comparison between profits obtained against the cost. Companies were measured among one another based on the greater profits obtained on same cost or same profits obtained by those companies at a lower cost. Christopher (2012) and Amirjabbari & Bhuiyan (2014) suggested that reduction order cycle time had a direct effect on increased customer satisfaction levels. According to Lutz, Löedding, & Wiendahl (2003) improving logistic key performance factors such as Lead times, service levels and on-time delivery reliability has tremendously increased customer’s faith and satisfaction on the company. Researchers have also advocated the concept of Visibility in obtaining the competitive edge. Mora-Monge, et al. (2010) claimed that visibility is a key factor in supply chain management as it improved the operational efficiency by increasing the productivity, preventing over stock or stock out situation, effectiveness of production planning, reducing inventory levels
and increasing delivery performance. Accuracy and speed of information flow were used as measuring units of visibility.
For the manufacturing companies to efficiently tackle and adapt to the increasing dynamic character of customer needs and demands is possible by implementing an effective and flexible Manufacturing Planning and Control (MPC) system (Abuhilal, et al., 2015). For past more than thirty years, researchers have studied ways to improve production planning efficiency focusing on demand uncertainty management and formulated different MPCs. An efficient breakthrough method was formulated by Orlicky in the year 1975 which profoundly changed the MPC into a systemic approach called Material Requirement Planning (MRP). This approach enabled firms to improve efficiency and effectiveness of their planning by creating more credible schedules and delivery dates by creating a link between receiving dates of components to delivery due dates of parent items (Miclo, et al., 2019). MRP has become the way of life in production planning and inventory management which was the standard across the globe for answering the important questions ‘what to buy and make?’, ‘When to buy and make?’ and ‘How much to buy and make?’ (Ptak & Smith, 2011). In late 1970s, though MRP as Production control system was widespread across manufacturing industries, the same results were not achieved as the early adopters as it was intended to only plan material in a deterministic environment (Shofa, et al., 2017).
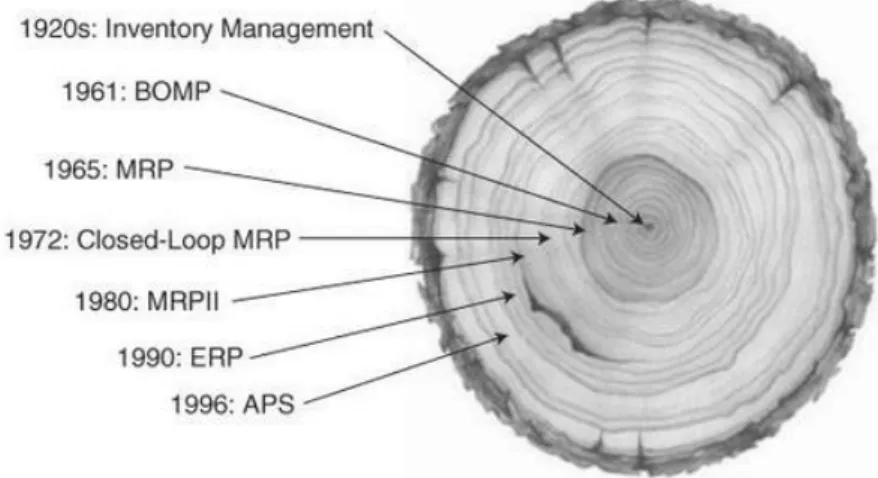
Further research has been done in the topic and modifications were proposed in MRP system which gave rise to Closed loop MRP. In this system while planning material requirement, additionally production scheduling and capacity requirements are taken into consideration. But the new system was also not able to achieve desired results due to lack of computing power to accommodate various factors effecting the MRP. In 1980s with increase in technology further modified the existing planning into a sophisticated system called Manufacturing Resource Planning (MRP II). This system provided the integration of MRP with financial analysis and accounting functions resulting in an effective planning of all resources of a manufacturing company. In the 1990s, further development of technology introduced Internet which resulted in Enterprise Resource Planning (ERP). APICS (2008), defined ERP as ‘Framework for organizing, defining, standardizing the business processes necessary to effectively plan and control an organization’. As companies started investing more into technology and integrated planning which led to the next evolution Advanced Planning and Scheduling (APS) systems which involve techniques that deal with analysis and planning of logistics and manufacturing during short, intermediate and long term periods (Ptak & Smith, 2011). Fig.2 shows the evolution of various Manufacturing planning and control systems over the past decades.
Figure 1.2: Planning tool evolution (Ptak & Smith, 2011)
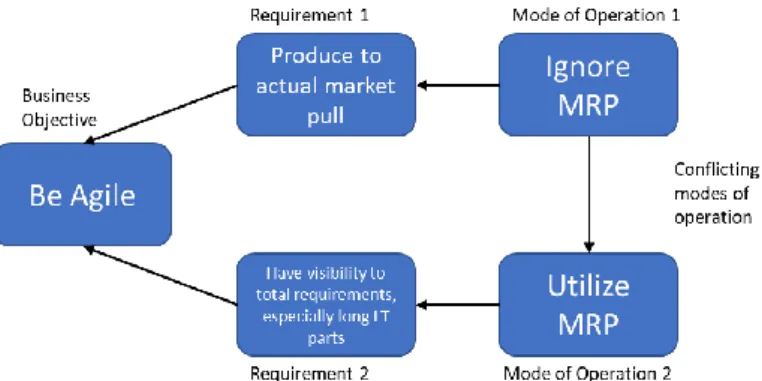
handicapping the present planning systems are: weak or missing capacity planning, over sophistication, invalid data and lack of integration hindering the flow of data. Also, the traditional MRP was based on push strategy and proven to be grossly inadequate in a highly volatile and flexible manufacturing setup. On the contrary, the current market demands require the companies to be more and immediately adapt to the dynamic changes. In short, companies had to function more on pull based strategy rather than push. The pull planning strategy systems adopted by the companies were, Just-in-Time (JIT) and Theory of constraints (TOC). This contradiction has caused a dilemma around implementing MRP leading to the MRP conflict. See figure 1.3.
Figure 1.3: The MRP conflict (Ptak & Smith, 2011)
1.2. Problem formulation
To tackle the above-mentioned conflict and for the companies to be more agile, an improvised planning system had to be developed. The new system had to combine the positive features of both push and pull planning strategies. According to Shofa, et al., (2017), four distinctive competencies: cost, quality, dependability and flexibility are required for the company to be agile.
Demand Driven Material Requirements Planning (DDMRP) was introduced by Ptak & Smith (2011), in Orlicky’s Material Requirements Planning 3rd edition book. DDMRP works as a fusion of core MRP, Distribution requirements planning (DRP), TOC and Lean Principles. DDMRP approach is formulated in a way to link material availability and supply directly to actual consumption throughout bill of material (BOM) with innovative approaches in inventory and product structure analysis, new demand driven planning rules an execution tactics. Shofa, et al., (2017), stated that, this approach deals with the challenges faced by companies such as producing their products at low cost, high quality products and services, short lead time and varied volume, finally improving the value chain towards customer through customization.
Since the inception of DDMRP in 2011, the approach has experienced increased implementation especially in France, Colombia and the United States. According to the studies presented by Demand Driven Institute (2017), evidence were emerging from the practitioner world supporting the superior performance of DDMRP. Companies such as Alegran, British Telecom, Figeac Aero and Michelin has effectively implemented the approach and claimed significant improvements in on-time delivery, reducing stock outs and reducing levels of inventory.
Though DDMRP has many advantages to offer and implementation results in significant improvement in performance, there is still a large gap from theory to practical application due to lack of awareness and knowledge about the new approach. Thus, the concept has received minimum attention in academia and almost no attention in actual practice compared to its vast potential benefits of implementation.
1.3. Aim and Research questions
In academia as well as reality, DDMRP has received very less attention as it is fairly recent concept and did not spread much into industry as there is minute percentage of practical application. This thesis aims towards bringing awareness about DDMRP in academia by researching the current literature on DDMRP through understanding the approach, analyzing the practical results of implementations across companies and comparing it with the already existing approaches such as MRP II, JIT and TOC. Also, the thesis aims towards shedding light on the ways and means of practical implementation of DDMRP and its way forward in manufacturing industries to fulfil this objective the following research questions (RQ) will be answered:
RQ 1: What are the advantages and disadvantages of DDMRP over other material planning systems?
RQ2: How should manufacturing industries transform to adapt DDMRP? RQ3: What are the challenges and way forward for DDMRP in manufacturing industries?
1.4. Project limitations
The research area of this thesis is focused on investigating the DDMRP approach through literature in academia. The research is purely qualitative, and information collected for performing this research is taken from web sources like Scopus and Demand driven. Also, research does not involve any quantitative experiments and number present in are taken from literature of other research. The study involves all the actors of a supply chain from customer demand to raw material purchase transforming from the current approach to new planning strategy limiting the scope of research to manufacturing industry. The research does not involve practical application of the approach but analyses the already implemented practical scenarios of DDMRP in various companies and draws results from it to support the research topic. A comparative study is performed between DDMRP and other planning systems to provide the readers with supportive claim that DDMRP could provide a significant improvement in planning and scheduling logic. However, before the research results can be used, it is important to understand the core logic and features of the DDMRP system, relative to existing systems. In context of using the research for practical application, reader should compare the existing procedure with the presented features of DDMRP to look for discrepancies and try to adapt the current system by making necessary changes in order to obtained the claimed results. The way forward for DDMRP presented in this thesis is based on the possible development and implementation of various technologies to tackle the sophisticated analysis of various decision factors involved in planning and scheduling using the approach.
2. RESEARCH METHOD
This section describes the research methodology which includes the method of data collection, research process used for analyzing and evaluating the collected data to answer the formulated research questions.
2.1. Research Method
Generally, research is described as a search of knowledge in a scientific and systematic approach for gathering information on a specific topic. A scientific research has two kinds of approaches: qualitative and quantitative. The choice of research approach depends on objective of the research and use of findings (Bryman, 2002). This thesis used the qualitative approach to analyse the concept of DDMRP in manufacturing industries as well as identify the pros and cons of implementing the new system of material planning. The claim is supported by presenting few companies success stories which implemented the DDMRP. The research is built upon the foundation laid by combining perspectives, making use of evidence from other research work done in the whole material planning area from its introduction to recent advancements.
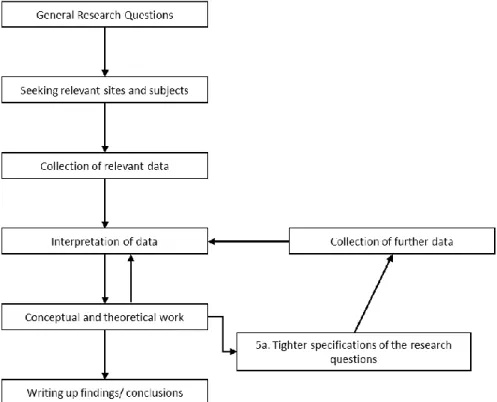
The motivation behind choosing a qualitative approach is inspired from the argument presented by xxx that, on the contrary to the existing notion, qualitative research is neither subjectivist nor biased and the approach is credible and trustworthy as it acknowledges that research is act of gathering knowledge to meet the objective (Marshall, et al., 2006). According to Bryman & Bell, (2003) a general procedure for performing the qualitative research is shown in Figure 2.1.
Figure 2.1. Procedure for performing qualitative research (Bryman & Bell, 2003)
The thesis was started by explaining the concept of material planning in manufacturing industry and its development through several years of research. The advancements in material planning have been explained briefly by gathering information from various available research literature.
The underlying technical terms which are required to understand the material planning systems are also presented.
The analysis is done by understanding corelating the data gathered from various researchers who worked on the material planning system in manufacturing industry. The collected data is organized in order to answer the formulated research questions. Finally, the thesis was concluded, and recommendations were provided to take forward the research to make the DDMRP more effective and efficient.
2.2. Literature Review
The choice of research method for this thesis is literature review. Williamson, (2002) states that literature review method deals with identifying, gathering and analysing the research literature to understand what has been done in the focus area and illuminating the gap. The idea behind choosing literature review method is to understand the topic in a hollistic perspective and prove that the collected information will provide the necessary support to the research topic. The thesis was started by defining the area of focus which is done by a priliminary research in material planning systems. Second step was to define the problem formulation and aim of the study which created a path for gathering information and analyzing. Next, the limitations for the focus area are identified to make sure the research fits into the given time period and find relavent literature to fulfil the study objective. Though, the material planing system were present in manufacturing industry for a very long time, the study was restricted to publications between the year 1994 and 2020. The restriction was drawn from the year when Plossl, (1994) introduced the MRP in his book.
According to Hart, (1998) and Williamson, (2002) a literature revie consits of information, data, ideas and evidence collected from a definite perspective on a specific topic. The perspective should have a determined aim and provide a brief idea on how the objective should be achieved. The collection of information is done from a range of literature which includes journal articles, conference papers, industry reports, published books and few websites. The main dta base opted for collecting data was Scopus as it can sort articales based on the highest citation and can limit the span of search. ScienceDirect and Malardalens University Bibiliotek were used as a secondary database. The databases provided valuable source of information relating to area of interest. To stay within the scope of research, the search was done by combining various word with a common word ‘DDMRP’. The other keywords used were MRP, MRP II, ‘Material
planning systems’, Manufacturing Industry’, ‘Closed Loop MRP’, and ERP. Furthermore, the
search area was limited to engineering and only english publications. The selection process of scientific articles was inspired form Eriksson-Batajas, et al., (2013), where the first step is to define the area of interest, keywords and their combinations which would be used to search for articles. Next, a limit has to be set for the search which is decided by the time span, language, subject area and access. Next, the articles are sorted through their citations. Later, the article title, abstracts, and keywords are extracted into an excel file. Selection of articles in the excel file is done by skimming through abstract and keywords to check for the relevance to the research topic. This approach has made it possible to identify specific topics and validate its quality and relevance of the information present in the articles.
2.3. Data Analysis
achieved without any prejudice and present evidence of alternative interpretation (Yin, 2014). Yin, (2003) in his research on research design and methods states that data analysis generally comprises of three categories which are relying on theoretical propositions, considering opposing explanations and developing a case description. These date from adapting these strategies is analysed by using five techniques: pattern matching, explanation building, time series analysis, logic models and cross case synthesis.
This thesis opts the theoretical propositions strategy as the research approach. The data is analysed by implementing the time series analysis and explanation building techniques. The research focuses on analysing the material planning systems in manufacturing industry. Information and data are illustrated in figures and tables to make it clear for the reader to understand.
2.4. Validity and Reliability
In order to obtain a high-quality research, the researcher should consider and evaluate the reliability and validity (Jacobsen, 2015). The essential tool in a positivistic approach of a research are reliability and validity (Winter, 2000). Reliability is to check whether the study would produce similar results if performed multiple time. It can also assess the conditions affecting the change in results if the outcome varies due to random events. The data and information obtained for this thesis is collected from credible sources and the articles selected are of high citation creating more reliability on the data used to analyse.
Validity is the process of checking whether the obtained results from the research are applicable to the real world and are practically possible. Validity is divided into internal and external validity Internal validity is to check if the researcher’s observations are inline with the theoretical findings which can also be described as the result of study is an accurate representation of reality. External validity is defined as generalisation of results obtained from the research. It is to check whether the results from research can be applicable to other situations and social environments (Bryman, 2008). The formulated research questions are not restricted to a specific company, the findings can be applicable to various manufacturing industries.
3. THEORETIC FRAMEWORK
In this chapter, the theoretical framework regarding Manufacturing planning and control (MPC), Planning, execution and control, MPS, Bullwhip effect, Manufacturing Nervousness, Decoupling and Decoupling points, MRP, MRP II, TOC, JIT, ERP, DDMRP and its features in detail are described.
3.1. Manufacturing planning and control (MPC)
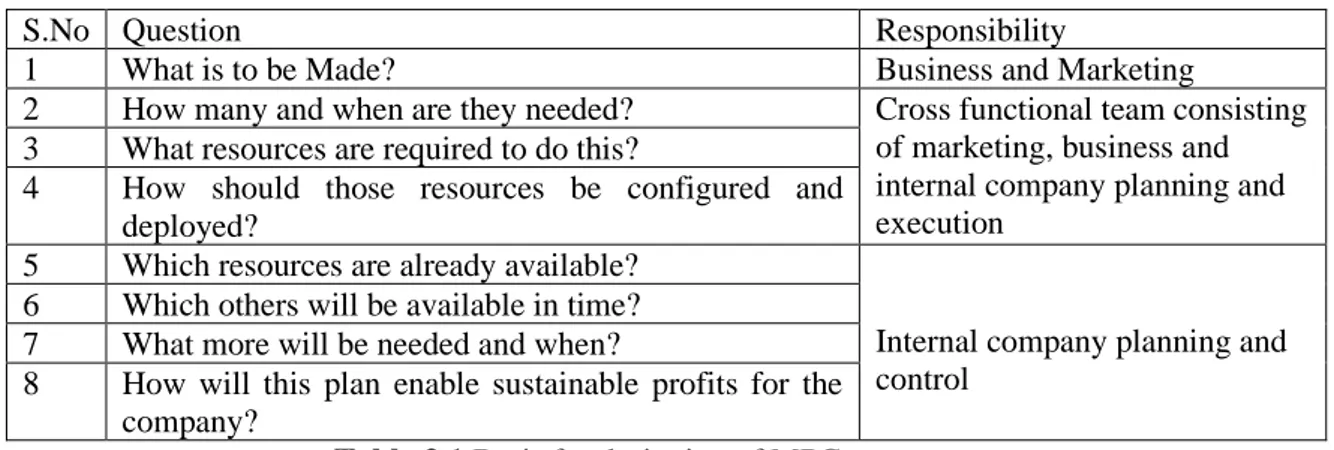
Manufacturing is the defined flow of raw materials from suppliers through plant to customers and flow of information to all participants about what was planned, what has happened and what should happen next. An effective planning of all the parties and operations with necessary information involved in manufacturing helps in reducing the difficulties in controlling the process and increase the flow speed (Ptak & Smith, 2011). Literature has provided different perspectives over MPC systems. A systemic approach to planning the activities in manufacturing is called Manufacturing planning and control which is an important element for manufacturing plant performance. It is designed to manage the flow of materials, coordinate the internal activities among the different departments inside the plant and coordinate the external activities with suppliers and customers (Shen & Wacker, 2001). MPC system is designed to plan and control materials, equipment, labor through feasible time phased plans and monitoring their progress (Vollman, et al., 2004). According to Ptak & Smith (2011), an MPC system should be designed to answer eight simple questions. See table 3.1.
S.No Question Responsibility
1 What is to be Made? Business and Marketing
2 How many and when are they needed? Cross functional team consisting of marketing, business and internal company planning and execution
3 What resources are required to do this?
4 How should those resources be configured and deployed?
5 Which resources are already available?
Internal company planning and control
6 Which others will be available in time? 7 What more will be needed and when?
8 How will this plan enable sustainable profits for the company?
Table 3.1 Basis for designing of MPC system
An effective MPC system significantly increases the manufacturing performance and reaps two types of benefits: Internal and external benefits. Internal benefits include vendor performance improved data accuracy, and shorter lead times. External benefits include increased market competitiveness, improved degree of performance in achieving planned manufacturing goals (Wacker & Sheu, 2006). MPC system has been evolving over the years due to constant work done by researchers and industries in effectively supporting shop floor activities and obtaining a competitive edge in the market. Over the past four decades, MPC system has been evolving and adapting to meet changing requirements in the market, introduction of new technology, products and manufacturing processes. Several new and modified approaches have come into practice such as MRP, MRP II, JIT, TOC, APS which were based on different strategies and expected outcomes to fulfill the manufacturing goals in order to gain the competitive advantage (Shen & Wacker, 2001). The manufacturing goals are measured in terms of Key performance indicators to assess the total manufacturing performance of the company. See table 3.2.
Manufacturing Goals Description Measure Delivery speed Time taken to convert customer
order into product and delivering to customer
• Manufacturing lead time On-time delivery Ability to deliver the product on
the decided date
• On-time delivery percent • Average days late Low cost Total cost required to convert raw
materials into final products should be as low as possible
• Cost percent of sales • Factory utilization
• Percent change in productivity Quality Ability to produce products as per
standards and maintain that quality
• Warranty returns
• Percentage rejection in final products
Volume flexibility Ability to increase or decrease volume at low cost
• Percentage change in volume Product flexibility Customizing current product as
per customer specific needs
• Number of product lines
• Number of items in finished goods
New product design Shortening time from idea generation to market release to achieve profit from the available market
• Design lead time for new product • Percentage change in design time
Table 3.2 Manufacturing goals, their description and measures
3.2. Planning, Execution and Control
These are most common terms used across all organizational levels in manufacturing industry. Planning means making decisions about future activities and events based on the available information which applicable for a fixed period (Ptak & Smith, 2011). In manufacturing environment, planning involves making decisions over material flows and production operations which may be applicable for the next few hours, days or months. The decision taking situations are largely varied due to differing time horizons, accuracy and precision level of input data. For making decisions over a short horizon, requires a high accuracy in the available information. Whereas for decisions over a distant future, input data can be approximated due to various involving factors in providing the information can vary in future. The planning structure is divided into four levels: Sales and operations planning, master production scheduling, order planning and Execution and control. The difference between the levels of planning is variation in the degree of information detail and planning horizon (Jonsson & Mattson, 2009).
Execution means converting plans into reality (Ptak & Smith, 2011). This includes checking material availability, sequencing of planned operations based on available resources. The current lean strategy of manufacturing firms with shorter lead times, smaller order quantities, material consumption through kanban cards based on pull strategies makes the execution an integral part of total manufacturing planning and control system (Jonsson & Mattson, 2009).
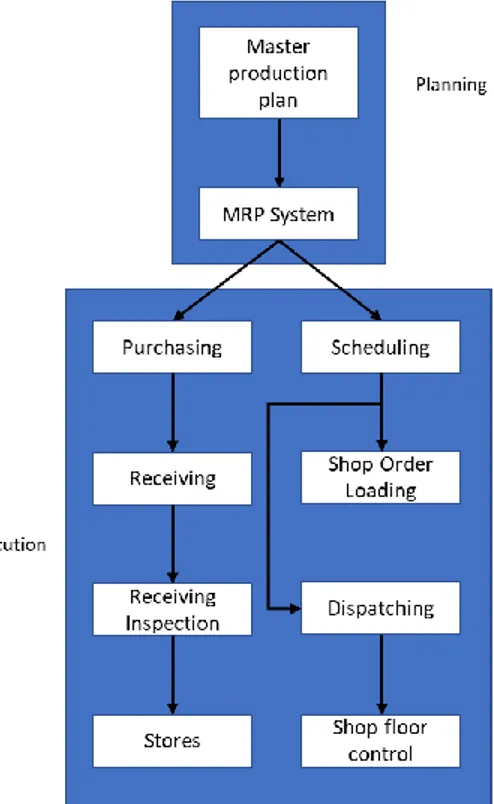
Finally, Control is defined as tracking the execution, comparing reality to plans, measuring deviations, differentiating various problems into significant or trivial and initiating actions in plans and executions (Ptak & Smith, 2011). According to Jonsson & Mattson (2009), control part of MPC system is distinguished into three levels: strategic, tactical and operative control. See figure 3.2. Firstly, strategic control aims to control over the issues and decisions involved in business strategy, goals, field of business activity and overall allocation of resources. Strategic issues generally include what products to be manufactured, which segment of customers and
products to be focused and what production resources would be used internally and what will be outsourced from suppliers and other subcontractors. Second is Tactical Control which deals with adapting and developing the current manufacturing environment of the company towards the new setup framework and goals as per the adopted strategy. The third and final level of control is Operative control which deals with the daily decision on the ongoing activities. It controls the decision taken over issues like planning manufacturing order, short term capacity and workload planning, delivery monitoring, stock accounting, assigning priorities to production in workshop.
Figure 3.2 Planning, execution and control systems
3.3. MRP nervousness and Supply chain Bullwhip effect
MRP nervousness is defined as ‘a characteristic in a MRP system where any minor changes in
higher level of organization or changes in master production schedule in the case of planning can cause significant timing and quantity changes in lower level scheduling’ (APICS, 2008).
Due to dependency on vertical integration for effective planning, small changes are amplified down the line (Ptak & Smith, 2011).
A typical supply chain can be represented as a linear linkage from customer to supplier through manufacturing company. But, in reality the connection is represented as a weblike network with complex interdependencies. When these interdependencies are subjected to slight variability, the effect are amplified and worsen the cumulative effect which is experienced by the organization which functions on this supply chain. This cumulative effect is called Bullwhip effect (Ptak & Smith, 2011). According to APICS (2008), Bullwhip effect is defined as ‘an extreme change at
any position in the supply chain generated by a small variability in demand downstream in supply chain’. Inventory can convert from being backordered to being excess which is caused by
miscommunication of orders up the supply chain coupled by inherent transportation delays of transferring products down the chain.
To negate the effect of MRP nervousness and Supply chain Bullwhip effect, the variation generated at a point should be localized and stopped from propagating and amplifying among the dependent systems in the supply network. This can be achieved by decoupling the dependencies and damping the cumulative variation in the network and the positions where the dependencies are decoupled are called decoupling points. The supply chain performance is most affected at these decoupling points. Understanding and strategizing these decoupling points are essential for efficient positioning of inventory and keep the company agile to demand variations at the same time effective utilization of working capital (Ptak & Smith, 2011).
According to APICS (2008) decoupling commonly denotes provision of inventory between interdependent operations in order to adapt to fluctuations in production rate of the supplying operation so that it does not constrain the production. Decoupling points are the location in the distribution network where inventory is decided to be placed to create decoupling between interdependent operations. Selection of these points is strategic decision which determines the customer lead time and inventory capital.
3.5. Master Production Schedule (MPS)
MPS is a conglomeration of requirements for end items planned by a date and quantity. The sum of committed production from a plant at any given point in time is equivalent to MPS. Format of MPS contains a matrix listing quantity by end item by time period and this time period for which MPS is applicable is termed as planning horizon (Jacobs & Chase, 2011). Typically, an MPS serves two important functions separated by planning horizon. Firstly, over a short horizon, it serves as a basis for generation MRP, the production of components, prioritizing orders, planning of short-term capacity requirements. Second, over a long horizon, serves as a basis for estimating long term demands based on available resources like capacity, available warehouse space, engineering staff and capital. MPs should be developed in a way to balance the scheduled input and available productive capacity over a short horizon and form a basis for establishment of planning capacity over the long horizon (Ptak & Smith, 2011).
According to Ptak & Smith (2011), an MPS is developed around the requirements placed over production of products as per the demand. These requirements are obtained from various sources such as:
▪ Customer orders ▪ Dealer orders
▪ Finished goods warehouse requirements ▪ Service part requirements
▪ Forecasts ▪ Safety stock ▪ Orders of stock ▪ Interplant orders
3.6. Material Requirement Planning system
MRP is defined as ‘a set of techniques that uses BOM data, Inventory data, and the Master Production Schedule (MPS) to calculate requirements for materials along with recommendations to release replenishment orders for materials’ (APICS, 2016). The MRP was popularized by Joe Orlicky’s first edition book in 1975. Aim of MRP is to determine the components as well as parts needed to satisfy the requirements of a product. Function of MRP is to convert the MPS into subsequent materials which are required to fulfill the production demand. Simultaneously it also defines the order’s priority depending the MPS (Acosta, et al., 2020). MRP functions on basis of
finding answers for following questions: ‘What is going to be produced? What do we need in order to produce? What do we have? And what is missing? (Ptak & Smith, 2011).
After development of MRP system companies started to rapidly adapt themselves to it as MRP system turned out to be a highly effective tool of manufacturing inventory management for multiple reasons. Its ability to generate orders for right items in the right quantities at the right time with the right date of need made it a more reliable system over others (Ptak & Smith, 2011; Kortabarria, et al., 2018)
• Reduced inventory holding up cost • Improved customer service
• MRP system is change sensitive and reactive • Better streamlined operations with fewer shipments • Order quantities are based only on requirement
• Timing of material requirement, coverage and order actions is emphasized • MRP system provided a basis for further improvement into the future
• MRP system served as a valid input for effective functioning of logistics areas such as purchasing, shop scheduling and capacity requirement planning
• An efficient MRP system served as solid basis to further computer applications in production and inventory control.
3.6.1. MRP Inputs and Outputs
According to Ptak & Smith, (2011), an effectively designed MRP system requires basic inputs in terms of data from different sources to produce primary and secondary outputs. Inputs for an MRP system are the data obtained from following sources:
• The Master Production Schedule • Demand forecasts
• Inventory record file • Bill of material file
• External order for components
With the above-mentioned inputs, the MRP system provides following primary outputs: • Order release notices
• Rescheduling notices • Order cancellation notices • Item status
• Planned orders of products scheduled for future release
Similarly, MRP system also produces a variety of secondary outputs generated at user’s options which can be used as feedback for further operations
• Reporting error notices and out of bound situations • Inventory forecasts
• Purchase commitment reports • Performance reports
3.6.2. Cons of MRP
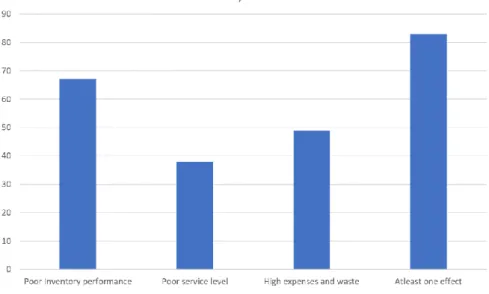
and volatile manufacturing environment (Kortabarria, et al., 2018). MRP is based on assumption of demand and lead times are deterministic making the system too restrictive. But most production systems and its demands are stochastic (Louly, Dolgui, & Al-Ahmari, 2008). An MRP system is capacity sensitive which means if the product demand exists in the MPS, system will generate the production plan for that particular item irrespective of capacity exists. An effective MRP system assumes that capacity considerations are made into MPS beforehand (Ptak & Smith, 2011). The output from MRP system is a calculation of BOM which may not be concur with time, capacity and availability of inventory. MRP system does not consider safety stock and uses it as available material which lead to stock out against uncertainty that may rise due to market change (Pekarcikova, et al., 2019). Companies which implemented MRP have experienced chronic problems such as risk of high variation, overstock or shortage in supply planning and customer demand. These chronic and frequent shortcomings result in three main effects on the firms: Unacceptable inventory performance, unacceptable service-level performance and increased expenses and wastes (Shofa, et al., 2017). According to survey conducted by Ptak & Smith, (2011) over 150 companies about material planning systems, a minor amount of companies reported all three previous mentioned effects to a severe degree, 83 percent reported at least one of the effects. Results of the survey are presented in figure 3.3.
Figure 3.3. Survey results (Ptak & Smith, 2011)
To adapt and remain competitive in today’s dynamic market, manufactures have to increase their efficiency in delivering products on schedule, reduce inventories and reduce lead time simultaneously. This dynamic character of market has developed two issues which caused variations on manufacturing operations and supply chains (Acosta, et al., 2020).The first is ‘Bullwhip effect’ which facilitates accumulation and amplification of uncertainty both upstream and downstream which increases with the complexity of supply chain. The second issue is Nervousness of the MRP system which results in a serious change in terms of time and quantity at low level, if any modification is made at top level orders (Cox & Blackstone, 2008).
3.6.3. MRP shortcomings and effects on organization
Ptak & Smith, (2011) have studied and analyzed the MRP shortcomings and its effect on organization. from their research, they have classified the shortcomings into two attributes: planning attribute and stock management attributes. See table 3.3.
Typical MRP attributes Effect on organization P lanning a tt ribute s Forecast or MPS as input to MRP
▪ Part planning is done based on the push created by forecasted demands
▪ Forecast become highly inaccurate at part level
▪ Forecasts are often misaligned with actual demand leading to increased inventory, premium freight, missed shipments, overtime
MRP depletes available stock of the parts entire BOM irrespective of safety stock
▪ Creates and overly complicated materials schedule which is change sensitive.
▪ When schedule planned for infinite stock, massive material diversions and priority conflicts occur
▪ When schedule is planned finitely across all resources, massive schedule instability occurs due to material shortage Order release to shop floor
irrespective material availability
▪ Leads to increased WIP due to shortage of parts
▪ Increased schedule delays, priority changes and overtime Limited early warnings to
of potential shortages or demand spikes
▪ Bringing in future demand inflates the existing inventories and wastes capacity
▪ Not adding future demand makes it extremely vulnerable to demand spikes
▪ Requires huge amount of forecast data to analyze and assess the possible demand spike
Manufacturing lead time of the parent part
▪ Orders are often released unrealistic dates which makes it impossible to achieve
▪ To compensate the above phenomenon, orders are released way earlier resulting in accumulation of WIP level
▪ Makes the manufacturing environment more susceptible to disruptions due to order changes
S tock Ma na ge ment att ribute s
Order points do not adjust to actual market demand
▪ Forecast inaccuracies leading to additional exposure to expedition
Orders to replenish safety stock are based on due date
▪ There is no differentiation in safety stock among parts leading to no real priority for replenishment.
▪ Determining actual priorities require massive attention to detail and depth analysis of priority changes
Due date is the propriety to manage orders
▪ Due dates do not reflect actual priorities
▪ Requires massive analysis to actually prioritize material orders Visibility of the released
orders is lost until due date
▪ No advance warning or visibility to potential problems with critical orders
▪ Critical parts are often late and disrupt production schedule causing WIP accumulation and missing delivery dates
Table 3.3. MRP shortcomings and its effects on organization (Ptak & Smith, 2011)
3.7. Manufacturing Resource Planning (MRP II)
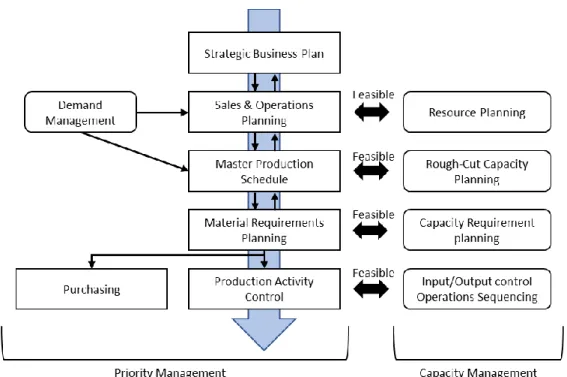
MRP II is defined as ‘a method for effective planning of all resources of manufacturing company’ (Miclo, et al., 2016). Manufacturing Resource Planning (MRP II) was the most widespread planning method in the world which requires demand forecast and plans all the manufacturing activities. These activities include variety of processes: business planning, production planning, sales and operations planning, master production scheduling, MRP, capacity requirements planning and the execution of support systems for capacity and material. See figure 3.4. All these activities are interlinked to each other. Output from these systems is also interlinked to financial reports, business plan, purchase commitment report, shipping budget and inventory projections (Ptak & Smith, 2011). MRP II has three main objectives: a) Minimizing inventory, b) Planning and scheduling production and purchasing activities and c) Ensuring resource availability for production and customer sales.
Figure 3.4. Manufacturing Resource Planning and Control System (APICS, Dictionary, 2008)
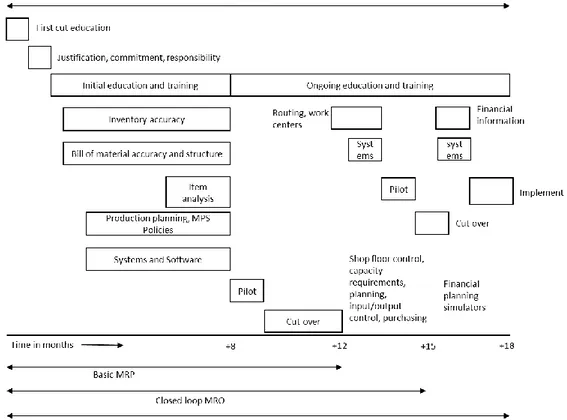
It can be seen as a ‘set of logic’ or a numerical system which aims to maintain a valid schedule considering the requirements for finished products and maps backs through to the raw materials, capacity, resources required for production and place purchase orders for missing resources. It is designed to control complex manufacturing and business environments (Wilson, et al., 1994). Oliver Wight, an industrialist and researcher was a leading authority on MRP II systems worldwide until 1983. Through his studies, he has developed a standard system for measuring the effectiveness of MRP II implementation called ‘Ollie Wight’s Proven Path’. This system constitutes a set of discrete activities which the system adopters should achieve over a period of 18 months, in sequence for the MRP II system to be successfully implemented.
Figure 3.4. Ollie Wight’s Proven Path (Wilson, Desond, & Roberts, 1994)
3.7.1. Pros of MRP II
MRP II has changed the view of production planning and integration of different departments of manufacturing industry. Effective integration has ensured high data integrity and accuracy in forecasting. According to Ganesh, et al., (2014), implementing MRP II has following benefits:
▪ Increased accuracy, consistency and efficiency in running the organization ▪ Improved control and monitoring over operations
▪ Ability to change the internal operations to adapt with changing market condition ▪ Ability to incorporate internal changes based on customer feedback
▪ Quicker and consistent availability of information to make faster decisions ▪ Improved accuracy in results through efficient operations
▪ Better utilization of inventory and other resources
▪ Improved productivity in terms of meeting customer demands, delivery schedules, quantity and quality
▪ Better relationship with suppliers ▪ Improved cash and capital management 3.8. Just-In-Time (JIT)
JIT is a ‘philosophy of manufacturing based on planned elimination of all waste and on continuous improvement of productivity’ (APICS, 2016). Kanban is one of the JIT execution tools which is used to bring materials to production facility at a very close to time of need (Ptak & Smith, 2011). Kanban is defined as ‘a method of JIT production that uses standard containers or lot sizes with a single card attached to it. It is pull system in which work centers signal with a card that they wish to withdraw parts from feeding operations or suppliers. It is also called as a
light, a card that indicates replenishment of an empty container with required material. This indication is generally from production personal to material handlers internally. A fax or an email to external supplier that authorizes movement of material is also Kanban (Ptak & Smith, 2011). JIT system eliminates the seven wastes as per lean, reduces batch size, shortens setup time, eliminates WIP inventory and standardizes work (Kortabarria, et al., 2018).
Kanban system’s primary factors are lead time, item cost, consumption rate and user defined factors include frequency of material reception, desired level of certainty in availability of material at a pre decided point of time. The approach of replenish material at a decided frequency works well when the demand for the parts is relatively stable. The time taken for part replenishment in kanban system is in minutes or hours. Whereas with other systems it could mount up to days and weeks. It also makes the task of part delivery scheduling easy for suppliers, provided there is no sudden spike in demand or variability in volume occurs (Ptak & Smith, 2011).
Though JIT appears to be efficient MPC system, researchers have pointed out few disadvantages. A JIT system is sensitive and susceptible to variation in demand as it has close to zero buffers in its system. This makes the production system vulnerable to supply and demand volatility leading to a brittle and rigid supply chain. To cope with variability and increase agility of supply chain, JIT system should work in synchronization with other MPC systems such as Production planning, MPS and MRP (Kortabarria, et al., 2018).
3.9. Theory of Constraints (TOC)
TOC is a holistic manufacturing and management philosophy developed by Dr. Eliyahu Goldratt and Jeff Cox which is based on the principle: every complex system exhibits inherent simplicity. In simpler terms, every system has at least on constraint limiting the ability to generate more of a predetermined goal of the system (APICS, 2016). TOC is systemic in nature and strives to identify the constraints that limit the organization’s success. TOC sees a company as a system or a set of independent links which are interlinked. The total performance of the system is dependent on the combined efforts of all the independent links. Moreover, any disruptions or fluctuations that interfere at any point of this connected system i.e., production and delivery of products will eventually increase down the line in the connected links and finally effecting the delivery to customer (Sproull, 2019). Many researches over the decades have analyzed and highlighted the effective performance of TOC focusing on the increased company revenue while decreasing inventory, lead time and cycle time providing a substantial competitive advantage (Mabin & Balderstone, 2003; Mohammadi & Eneyo, 2012).
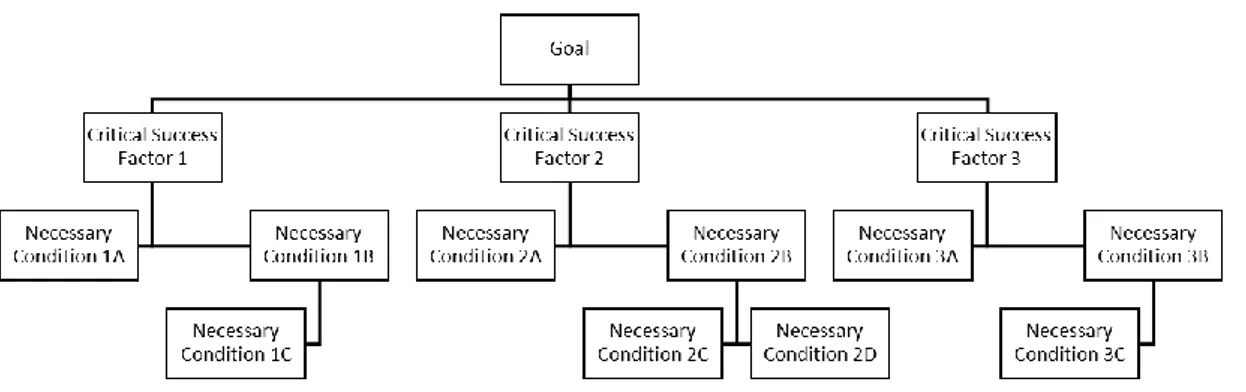
For solving distribution and supply chain problems, TOC proposes a six-step solution known as ‘Theory of Constraints Supply Chain Replenishment System (TOC_SCRS)’ (Cox & Schleier, 2010). Implementing the proposed solution has shown efficient results in reducing the inventory level, Lead time and transportation costs while increasing the forecast accuracy and customer service levels (Kortabarria, et al., 2018). The concept of TOC was further developed by Dettmer and presented in his book. Dettmer (2007), has developed an Intermediate Objective Map (IO Map) figure 3.5 which is a graphical representation of system goals, critical success factors (CSF) and necessary conditions for achieving them and each of the constituents in IO map exists in a necessity based relationship with entities below. Necessity based relationship can be explained as – in order to have a certain thing, one must have the other thing. The IO map is intended to be a firm foundation in terms of space and time, system goals, critical success facts and necessary conditions.
Figure 3.5. Intermediate Objective map (Sproull, 2019)
Due to TOC’s simple yet robust methodology, its application in various fields has been investigated in research literature especially in the areas of project management (Cohen, et al., 2004), supply chain management (Simatupang, et al., 2004), process improvement and other production environments (Watson, et al., 2007).
3.10. Enterprise Resource Planning (ERP)
ERP was created as a continuation of MRP and MRP II which considers all the resources including Human resources, sales and financial department necessary for the success of enterprise (Kurbel, 2013). ERP is a strategic tool which integrates, synchronizes and streamlines various operations of the organization along with its data into a single system for efficient functioning of the firm and achieve a competitive edge in uncertain business environment (Madanhire & Mbohwa, 2016). The organizations in early 1990s have recognized that in order to meet the organization vision and goals, all the independent operations of a manufacturing firm, not only production and supply chain department but also supporting departments also need to work in synchronization. For a sustainable growth and development of an organization, all the individual departments must coexist and operate a same level of efficiency and productivity along with seamless flow of information (Ganesh, et al., 2014). See figure 3.6.
Figure 3.6. Standard ERP flow chart (Madanhire & Mbohwa, 2016)
ERP is defined as an integration method for effective planning and control of all resources needed to buy, make, ship and account for customer orders in a manufacturing organization (Taiwan, 2003). The basic concept of ERP is to integrate all the business processes of various departments and functions of a manufacturing firm into one unified system, where different components of hardware and software take care of individual processes. ERP system is designed to take care of individual processes by different components of the software which are finally integrated under a unified organization (Ganesh, et al., 2014). Traditionally, manufacturing operations treat each process separately creating a strong boundary around specific operations. With ERP, all the processes are treated as an interconnected network that make up the business. ERP as a system is developed on the principal that whole is greater than sum of its parts (Madanhire & Mbohwa, 2016). Integration is a key issue in implementation of ERP system. Increasing complexity of manufacturing organizations has made the need for integration of information systems across its processes. Before, most of the systems were standalone and not connected to each other which created many issues as many business processes of the organization are interdependent (Kurbel, 2013). Integration not only means in data but also in other perspectives. Following integration perspectives can be considered in an organization:
▪ Data Integration ▪ Function integration ▪ Activity integration ▪ Process integration ▪ Method integration ▪ Program integration
ERP as a software consists of different modules which typically takes care of one function. This assigns each function of a manufacturing industry such as: finance, material management, production management, project management, quality management, maintenance management, sales and distribution, HR management etc. with an in individual module (Ganesh, et al., 2014). Advancement of technology has increased the ease of data transfer across these modules. Generally, technologies used for facilitating data transfer across the operations are Workshop,
Workflow, groupware, electronic data interchange, internet, intranet and data warehousing. The number of modules in an ERP can be customized as per the firm’s requirement. The basic modules incorporated are (Zhang, 2005):
▪ ERP production planning module ▪ ERP purchasing module
▪ ERP Inventory control module ▪ ERP sales module
▪ ERP marketing module ▪ ERP financial module
▪ ERP human resources module
After implementation of ERP, productivity is measured for entire organization as one whole unit due to integration of business processes. Productivity in an organization can be improved through various improvement initiatives and changing many factors which increase the productivity level. Automation of business processes through ERP improves productivity in two ways: 1) improving the efficiency of existing process through rigorous and thorough implementation of its modules 2) making sure of accuracy and frequency of the retrieved information for effective decision making (Ganesh, et al., 2014). ERP system can be easily implemented and utilized as it can be used as a single integrated system to manage all departments from production to distribution which results in reducing operating costs, facilitates easy data transfer and availability to help in strategic planning of operations. With adequate training to employees on the usage of ERP operations of business processes can be done with improved efficiency (Madanhire & Mbohwa, 2016).
3.11. Demand Driven Manufacturing Resource Planning (DDMRP)
Researchers have been studying and analyzing different MPC systems over the past decades and concluded in their literature that they did not perform sufficiently in a dynamic production and highly varying market demand environment. MRP and MRP II was based on the “push and promote” philosophy of manufacturing where the organizations faced chronic shortages and tremendously increased lead times (Ptak & Smith, 2011; Miclo, et al., 2015; Miclo, et al., 2016). JIT works towards eliminating inventory as it based on lean philosophy which treats inventory as a waste. Companies implementing JIT system have reduced their inventories considerably, making their supply chain rigid, brittle and vulnerable to demand and supply volatility (Ptak & Smith, 2011; Lage Junior & Godinho Filho, 2010; Miclo, et al., 2019). TOC faces difficulty in dealing with complex BOM structures greater than two levels as it does not consider BOM explosion (Ptak & Smith, 2011; Acosta, et al., 2020). Further to negate the problems from individual MPC systems, researchers have focused on developing integrated MPC systems approach instead of treating push and pull systems mutually exclusive. According to Powell, et al., (2013), MRP and lean techniques have a potential for managing material flows more efficiently when integrated, rather than working as standalone systems. But that is not an easy task, since the basic approach for both the systems will eventually contradict each other. For example, Scheduling with MRP system is basically done for an advanced consumption and in Lean, orders are scheduled as per consumption.
However, more research has been performed on the possibility of integration and one potential approach formulated by Gonzalez-R, et al., (2011), proposed a third category of material management called the hybrid system which contain positive parts of push and pull approaches. These hybrid systems are further divided into horizontal and vertical push-pull integration.
Cochran & Kalyani, (2008) in their research paper tried to define these hybrid integrated systems. The horizontal hybrid pull system contains a series of pull activities followed by push activities sequence in the whole process. Also, there were semi-finished items at these transition points which are called decoupling points. Whereas in vertical hybrid system, the planning and strategy phase is based on push system and the execution phase in based on pull strategy.
Considering the disadvantages of the above-mentioned individual systems, Ptak & Smith (2011) have developed a new MPC system called Demand Driven Material Requirement Planning (DDMRP). It is defined as ‘a multi-echelon materials and inventory planning and execution solution’. It is a dynamic and effective demand driven strategy for manufacturing companies to obtain a competitive edge facing the current challenges in manufacturing industry. The new system is formed by gathering features from MRP, JIT, TOC, Six Sigma, DRP along with incorporating new innovative features to manage the material flow. See figure 3.7. DDMRP is a key constituent of demand driven operating model or a manufacturing strategy which focuses on considerable reduction of lead time, adapting market requirements and agile response to demand variation. This is possible by careful integration and synchronization of planning, scheduling and execution with consumption (Ptak & Smith, 2016).
Figure 3.7. MPC systems used in DDMRP (Ptak & Smith, 2011)
Generally, most MPC systems are based on bimodal distribution model of inventory with either too high or too low inventory. DDMRP aims to solving this problem by remodeling the inventory and bringing in the inventory level to the center of distribution limiting it to sufficient level (Ptak & Smith, 2011; Nielsen & Michna, 2018; Mendes Jr., 2011). See figure 3.7. DDMRP system focuses towards eliminating the influence of bi-modal distribution effect and convert the supply chain from push strategy to pull strategy according the market demand (Pekarcikova, et al., 2019). DDMRP is built up by taking features from various MPC systems. From MRP, it takes the decided demand, product explosion and time phasing. Similarly, from lean, it takes the emphasis on waste identification, variance and pull flow strategy. From Six Sigma it takes adaptive adjustments to variance and from TOC it takes the focus on bottlenecks, acceptance of buffer inventory and strategic placement of inventory (Miclo, et al., 2019).
Figure 3.8. Bi-modal distribution with designated border points (Ptak & Smith, 2016) 3.11.1. Components and steps for implementation of DDMRP
DDMRP consists of five phases from initiation to implementation. The first three phases represent the initial and evolving configuration of DDMRP model and Last two phases deal with operational and implementation aspects of (Kortabarria, et al., 2018). See Figure 3.9. All the phases are necessary to negate the effect of the undesirable MRP conflict and improve company’s agility (Ptak & Smith, 2011).
Figure 3.9. Components and steps of Demand Driven MRP (Ptak & Smith, 2011)
a) Strategic Inventory Positioning
The first phase in DDMRP system analyses the possible locations for inventory placement (Ptak & Smith, 2011). This is done by evaluating the potential locations in a financial point of view, whether the selected location or position benefits the production flow for a particular article from the BOM (Miclo, et al., 2016). Excessive inventory in and around the company creates a significant risk for the firm during variability in demand, supply and operations (Kortabarria, et al., 2018). The aim of selecting the inventory positions, also known as decoupling points, is to provide maximum flexibility and reduction of lead time (Smith & Smith, 2013). The initial positioning strategy is determined by assessing the six key factors which are applied across the BOM, production layout, manufacturing facilities and supply chain. The analysis results in
determination of best positions for purchased, manufactured and finished items (Ptak & Smith, 2011).
Strategic Inventory Positioning Factors
Description
Customer Tolerance Time The total time period which the potential customers can wait for the
delivery of goods or services
Market Potential Lead Time The time period where there is a possibility of increase in process or
potential increase in market demand through current or new customers
Demand Variability Potential spike or fall of demand that could overburden or underutilize
resources
Supply Variability Potential disruptions of material or services from suppliers which is
also called as supply continuity variability
Inventory Leverage and flexibility Locations in the supply chain network that help the company with
most available options and high potential for reduction of lead time to meet the demand
Critical Operation Protection Minimization of disruptions at control points
Table 3.4. Critical factors for strategic positioning of inventory (Ptak & Smith, 2011)
Traditionally, selection of feasible inventory position is done based on manufacturing lead time (MLT) and cumulative lead time (CLT). But the results obtained by using MLT and CLT are too ideal as the lead times are realistic only under two extremes. MLT is considered realistic when all components at every level of supply chain are sufficiently stocked with highly reliable management to make the goods readily available. CLT is considered realistic when no components in the longest path of BOM explosion for a particular parent are not stocked. This means that the components of the longest path are not available within their respective lead times. Using MLT has resulted in material shortages and increased WIP. Using CLT resulted in stocking of inventory, wasted capital, space and attention. There is a critical point between the MLT and CLT that needs to be calculated for realistic analysis of inventory positioning. This critical point is called Actively synchronized replenishment lead time (ASRLT), defined as ‘longest unprotected or unbuffered sequence in the BOM for a particular parent’. ASLRT is a core concept of DDMRP which can be a critical factor in understanding the best leverage from inventory, setting proper inventory levels, reduction of lead times and realistic determination of due dates. With the help of ASRLT approach, planners can determine more realistic positioning of inventory, size of the inventory positions and critical date driven alerts and priorities (Ptak & Smith, 2011).
b) Buffer profiles and levels
The second phase in DDMRP after fixing inventory positions is to determine the profile and level of inventory feasible in that positions. Too much inventory results in restriction of cash flow, excess wasted capacity, materials, utilize extra space and increased risk of obsolescence. On the other hand, too less inventory can cause frequent shortages, missed sales opportunities and increased freight (Kortabarria, et al., 2018). Before determining the buffer levels, the manufacturing firm should understand whether the inventory is asset or liability. In terms of production planning, inventory is considered an asset when the quantity is sufficient to meet the available market demand and if the quantity is more (overage) or less (shortage) than required it is considered a liability. See figure 3.10. The shape of the curve is dependent on the demand or supply of a particular part. Manufacturing firms often bounce between the two extremes levels of liability (Ptak & Smith, 2011).
Figure 3.10. Inventory asset – liability Curve (Ptak & Smith, 2011)
According to Ptak & Smith, (2011), determining the buffer levels at the selected locations can be a tedious and overwhelming job when the supply chain deals with thousands of parts. To overcome this, buffer profiles are implemented which divides the parts into families or groups of parts which follow a set of rules, guidelines and procedures for setting the buffer level. These families are not based on traditional part classification methods such as ABC classification. Each buffer profile is further divided into zones which are color coded and sized. The summation of these zones will give the buffer level of that part family. The key factors for dividing the parts into families are: Item type, variability, lead time and minimum order quantity. Division based on Item type is done based on whether the part is manufactured (M), purchased (P) or distributed (D) which results in the difference in lead time for the part. Secondly, division on variability is done into three segments high, medium and low for demand and supply of parts. See table 3.5. Third factor for division is lead time and it segments the parts into short, medium and long lead times. The division of lead times into short, medium and long is completely dependent on comfort level of organization and its planning department. Finally, the minimum order quantity includes ordering policies deciding the minimums, maximums and multiples of different parts which often complicate the planning of supply scenarios. Based on these factors, one can obtain 54 basic buffer profiles which can be further increased by adding more customized classifications depending on the organization.
Variability in parts Demand Supply
High frequent spikes Frequent disruptions Medium Occasional spikes Occasional disruptions Low Little to no spike Reliable supply
Table 3.5. Classification based on variability
Buffer zones care generally color coded using green, yellow and red. See figure 3.11. Green represents that inventory position does not require attention, yellow represents refurbish or replenishment of position and red represents that inventory position requires special attention. Calculation of buffer level is done by the adding the three zones (Pekarcikova, et al., 2019). For detailed view of the buffer profile, red zone is further divided into red zone base and red zone safety. Figure 3.12. shows the inventory asset liability cover with colour coded zones (Ptak & Smith, 2011). Sizing of each zone is done based on factors like Delivery lead time (DLT), Average Daily Usage (ADU) and Minimum order quantity (MOQ) (Kortabarria, et al., 2018).