THESIS
ALPINE WIND SPEED AND BLOWING SNOW TREND IDENTIFICATION AND ANALYSIS
Submitted by Jamie D. Fuller
Department of Ecosystem Science and Sustainability
In partial fulfillment of the requirements For the Degree of Master of Science
Colorado State University Fort Collins, Colorado
Spring 2012
Master’s Committee:
Advisor: Melinda Laituri Daniel Cooley
Nolan Doesken Kevin Elder
Copyright by Jamie D. Fuller 2012 All Rights Reserved
ii
ABSTRACT
ALPINE WIND SPEED AND BLOWING SNOW TREND IDENTIFICATION AND ANALYSIS
The substantial quantity of climate change related analyses has resulted in increased research efforts concerning temporal wind speed trends. A change in wind speeds over time could have a widespread effect on snow transport and distribution in alpine regions. Since alpine meteorological stations are sparsely distributed, the intentions of this research were to explore North American Regional Reanalysis (NARR) to assess long-term trends of atmospheric conditions affecting snow transport with greater spatial coverage. NARR is a consistent,
continuous and long-term dataset spanning the extent of North America at a spatial resolution of 32 km2 grids. NARR data were compared to two alpine sites (Niwot Ridge, Colorado and
Glacier Lakes Ecological Experiments Station, Wyoming) from 1989 to 2009. Multiple analyses were conducted to evaluate dataset agreement and temporal trends of alpine climatic conditions at the annual, seasonal and daily scales. The correlation of temperature, precipitation and wind speed between NARR and alpine in situ datasets showed temperature data as correlated, but wind and precipitation lacked agreement. NARR wind speed data were systematically lower when compared to observational data for both locations, but the frequency of wind events was captured. Thus, to more accurately assess blowing snow dynamics using NARR additional methods would be needed to relate the lower wind speed values to the extent of blowing snow.
Trend analyses of wind speed datasets for each temporal scale (annual, seasonal and daily) showed slight trends, minimal significance and trends were not significantly different between NARR and in situ data. The statistical similarities were observed for trends with opposite signatures and slopes and a result of weak trends. Additional blowing snow analyses
iii
were conducted using temperature, wind speed and precipitation to estimate probable blowing snow events. The low agreement between NARR and observational data for wind speed and precipitation parameters prohibited the use of NARR to assess blowing snow processes and expand spatial and temporal coverage.
iv
ACKNOWLEDGEMENTS
This research was made possible by the Colorado Agricultural Experimental Station COL00 for Developing a Geospatial Data and Analysis Center for Conservation Planning in Colorado. The principal investigator and research adviser for the project was Dr. Melinda Laituri. I am very appreciative of the opportunities provided throughout the pursuit of my master’s degree. I am also proud of my academic growth and achievements that were made possible by multiple dedicated individuals.
I would specifically like to thank my knowledgeable committee members for their time and dedication. Melinda Laituri Daniel Cooley Nolan Doesken Kevin Elder
A special thanks to those involved with the Geospatial Centroid. Also, I would like to include others who were integral in my graduate experience and contributed to many aspects of my thesis. David Hoover Greg Newman Jim Graham Kristen Kaczynski Sophia Linn
Thanks to my parents for their encouragement. Rebecca Fuller
v PREFACE
This research was designed to gain a greater understanding of wind speed and blowing snow trends in the Front Range of the Rocky Mountains. Two meteorological stations (Niwot Ridge, Colorado and Glacier Lakes Ecosystem Experimental Station, Wyoming) were compared to the corresponding North American Regional Reanalysis (NARR) grid cells. The in situ and NARR datasets were compared to see if the NARR dataset could be used to expand spatial and temporal coverage and improve our understanding of alpine meteorological processes. To compare in situ and North American regional Reanalysis data and understand temporal blowing snow trends many hypotheses were tested. Hypotheses included 1) temperature, precipitation and wind speed data are highly correlated between these datasets; 2) mean wind speeds show a significant change (increase or decrease) in temporal trends for annual, seasonal and daily data; 3) daily mean wind speeds show a change (increase or decrease) in variance over time; 4) wind speed trends are statistically similar between both datasets at each temporal increment; 5) there has been a change in wind speeds exceeding set threshold categories for blowing snow; and 6) the number and intensity of blowing snow days have changed over time and trends are
statistically similar between datasets.
The thesis is organized into two chapters: a manuscript and a literature review. Chapter 1 is formatted as a manuscript for submission to a peer reviewed journal. The manuscript includes an introduction, research objectives, methods, results, discussion and a conclusion. Appendix A of this document is a literature review covering current wind trend research across the globe and pertinent snow transport research. Full details of the methodology and results can be found in the other appendices.
vi
TABLE OF CONTENTS
ABSTRACT……….. ii
ACKNOWLEDGEMENTS…...……… iv
PREFACE ……...……….… . v
LIST OF FIGURES………. viii
LIST OF TABLES……… iv
CHAPTER 1: ALPINE WIND SPEED AND BLOWING SNOW TREND IDENTIFICATION AND ANALYSIS………..……… 1
Introduction………..………. 1 Background………..………..…... 2 Data ………..……… 3 Study area………..………6 Methods………..……….. 9 Data preparation………….…..………. 9 Statistical procedures……..………..………..9 Results………..………... 11
NARR and in situ temperature, precipitation and wind speed correlation……… 11
Temporal trend analyses for wind speed………... 11
Sample variance temporal trends for daily mean wind speeds...……….. 14
Frequency of wind speeds exceeding thresholds.……….………... 16
Blowing snow day trend analysis……….……….……… 18
Discussion……….……….……….……….………... 20
Conclusion……….……….……….……….……….. 24
Literature cited……….……….……….……….……… 26
APPENDIX I: LITERATURE REVIEW………..30
The impacts of wind and snow on human activities………... 30
Wind research………... 32
Global circulation and climate models………. 39
Influence of cyclones – seasonality………... 39
Interannual variability………..……… 40
Hi elevation wind speed changes………..……… 41
Anemometer history……….……….. 42
Aspects of snow hydrology………..……….. 43
Metamorphism………..…………..……….. 43
Creep, saltation, suspension, and sublimation……….. 43
Transport threshold………..……… 45
North American Regional Reanalysis ……… 47
Conclusion………..…………..……….. 49
Literature cited………..…………..………….…….. 51
APPENDIX II: DATA ORGANIZATION………... 57
vii
Script to extract data from NARR grids………..57
NARR 3-hour to daily……… 59
Blowing snow days……… 60
APPENDIX III: GIS AND STATISTICAL INFORMATION………. 62
Description of contents……… 62
GIS information……….. 62
Linear regression model……….. 62
Correlation between in situ and NARR linear model………. 63
Autocorrelation regression model for daily mean data………... 63
Trend comparison equation………. 64
Extrapolating missing in situ data with slope……….. 64
Literature cited……….... 64
APPENDIX IV: ALL RESULTS ………. 65
Niwot results……… 65
viii
LIST OF FIGURES
Figure 1: Location of meteorological stations in Colorado and Wyoming………... 7 Figure 2: North American Regional Reanalysis grid identification.………. 7 Figure 3: Seasonal wind speed means for winter (December, January, and February)………... 12 Figure 4: In situ station and NARR daily mean wind speeds………... 13 Figure 5: Sample variances plotted for daily mean wind speed for winter and spring.………... 15 Figure 6: Wind speeds exceeding set thresholds during winter (December, January
and February) displayed as percentages.………..……… 17 Figure 7: Blowing Snow Days for Niwot and GLEES datasets displayed as daily mean
ix
LIST OF TABLES
Table 1: The details for in situ station information and meteorological variables for
in situ sites…..………... 8
Table 2: Details The details of grid locations and meteorological variables for NARR.………..………. 8
Table 3: All results from annual, seasonal and daily mean wind speeds.………...……… 14
Table 4: Sample variance results for daily mean wind speed for each Niwot and GLEES sites datasets….……… 16
Table 5: All results from wind speed values exceeding set thresholds at annual, seasonal and daily temporal scales.……… 18
Table 6: Blowing Snow Day trend values listed as percentage of change per year (% a-1)…… 20
Table 7: Summarization of each hypothesis test for all analysis conducted...……… 24
Table 8: Wind Research: Review of recent studies looking at wind speed trends………. 34
Table 9: Datasets incorporated into NCEP–DOE GR2 and NARR.……….. 48
Table 10: Additional or improved data used in NARR……… 48
Table 11: Niwot in situ station data statistical results 1989-2008……… 65
Table 12: Daily Niwot in situ station data accounting for dependence within the data 1989-2008–GLS Model.………...……. 66
Table 13: NARR at Niwot statistical results 1989-2008………. 66
Table 14: Daily Niwot NARR data accounting for dependence within the data 1989-2008 – GLS Model.………. 67
Table 15: NARR at Niwot Statistical Results 1979-2009.………... 68 Table 16: Daily Niwot NARR data accounting for dependence within the
x
data 1979-2009 – GLS Model.………... 69 Table 17: Niwot NARR and in situ daily mean wind speed results 1989-2008………... 69 Table 18: GLEES in situ station statistical results 1988-2009……….. 69 Table 19: Daily GLEES in situ station data accounting for dependence within the data
1979-2009 – GLS Model. ………..……….. 70 Table 20: NARR at GLEES data statistical Results 1989-2009……….. 70 Table 21: Daily GLEES NARR data accounting for dependence within the data
1989-2009 – GLS model………. 71 Table 22: NARR at GLEES data statistical results 1979-2009..……….. 72 Table 23: Daily GLEES NARR data accounting for dependence within the data
1979 2009 – GLS Model.………... 73 Table 24: GLEES NARR and in situ daily mean wind speed variance results
1
CHAPTER 1: ALPINE WIND SPEED AND BLOWING SNOW TREND IDENTIFICATION AND ANALYSIS
Introduction
The distribution of snow in alpine regions has received a great deal of attention in recent years due to the importance of snow as a water resource. While snow as a water resource is valuable, snow and blowing snow present considerable hazards for transportation and
backcountry safety. A better understanding of temporal wind speed trends affecting the spatial distribution of snow is important for accurate estimation of the amount of water equivalent stored within a snowpack. The amount of water derived from a melted snowpack is known as snow water equivalent (SWE). SWE is estimated using the depth and density per unit area of a
snowpack. The estimation of SWE is difficult in complex terrain because of interactions among snow, wind and topography (Elder et al. 1991; Greene et al. 1999). Increasing the knowledge base of alpine wind speed and snow distribution trends is crucial because water from alpine areas is a key component in the hydrologic cycle and supports the water needs for 1/6th of the global population (Barnett et al. 2004). This research compared long-term trends in wind speeds
affecting snow transport in the alpine between two different data types: 1) in situ meteorological stations, and 2) North American Regional Reanalysis (NARR), a gridded regional model output. NARR encompasses all of North America and is a consistent, long-term, high-resolution 3-dimentional atmospheric and land surface hydrologic dataset (Messinger et al. 2006). If in situ
2
and NARR data correlate well then perhaps NARR can be used to increase spatial and temporal coverage so a better understanding of alpine meteorological processes can be achieved.
To compare in situ and North American regional Reanalysis data and understand
temporal blowing snow trends six hypotheses were tested. Hypotheses included 1) temperature, precipitation and wind speed data are highly correlated between these datasets; 2) mean wind speeds show a significant change (increase or decrease) in temporal trends for annual, seasonal and daily data; 3) daily mean wind speeds show a change (increase or decrease) in variance over time; 4) wind speed trends are statistically similar between both datasets at each temporal increment; 5) there has been a change in wind speeds exceeding set threshold categories for blowing snow; and 6) the number and intensity of blowing snow days have changed over time and trends are statistically similar between datasets.
Background
While many studies have focused on how wind transports and distributes snow across a landscape, few studies have analyzed long-term wind speed trends and the potential effects on snow distribution. Snow depth can spatially vary from a few centimeters to many meters and be caused by land-surface characteristics (Elder et al. 1991; Winstral et al. 2002; Liston et al. 2007) and stronger winter wind speeds (St. George and Wolfe 2010; Klink 2002). Alpine regions are likely more sensitive to long-term change and variability (Beniston 2006; IPCC 2007). A change in wind speed behavior when snow cover is present could have a widespread effect on the extent and amount of blowing snow.
Wind speed research conducted in China (1960-2006) and Switzerland (1983-2006) used observational data to analyze wind speed trends in mountainous regions (McVicar et al. 2010). Their results showed alpine wind speeds decreased at a faster rate when compared to low
3
elevation sites. The decline in wind speeds was more prevalent during winter months for both China and Switzerland, but was not significant (McVicar et al. 2010). Their study showed the magnitude of decreasing wind speeds at alpine locations was -0.0138 and -0.0086 m s-1 a-1 (meters per second per year) for China and Switzerland, respectively. The mean wind speeds were not stated by McVicar et al. (2010) so the percentage or amount change relative to the mean could not be assessed. However, estimating from the figures provided, the overall mean for alpine wind speeds were approximately 2.5 m s-1 for China and 2.25 m s-1 for Switzerland, recorded at 10 m heights.
Low-elevation observational stations have shown significant evidence of declining wind speeds over the past 30-50 years in North America, Europe, Australia, Canada, Switzerland and China (McVicar et al. 2008, 2010; Pryor et al. 2009; Klink 1999; Tuller 2004; Roderick et al. 2007; Pirazzoli and Tomasin 2003; Jiang et al. 2010). The average magnitude of decline from these studies was -0.01 m s-1 a-1 and significancevaried among the different locations and datasets. This decline was further confirmed by McVicar et al. (2011) where the average trend was -0.017 m s-1 a-1 from 148 wind speed studies.
Data
While results from wind speed analyses are seemingly consistent and widespread, many issues plague in situ stations that may create false trends or mask real trends, and ultimately lead to inaccurate wind speed and snow transport assessments. In order to look at long-term wind speed trends it is critical to reduce errors and inconsistencies from observational data.
Unavoidably, all observational stations are subject to data continuity issues caused by variability among instrument type, height, location, collection methods and record length (Legates and Deliberty 1993). Alpine stations may more accurately represent wind speed trends because of
4
fewer anthropogenic changes (e.g. station relocation, urban development and land use-land cover change). In addition, the stations are closer to the free atmosphere where winds are less affected by surface friction (Garratt 1994). Despite these advantages, finding long-term, accurate and reliable datasets proves difficult, in part because there are far fewer alpine stations.
Two alpine stations were identified in the Front Range of the Rocky Mountains with approximately 20 years of continuous temperature, wind speed and precipitation data. To sufficiently assess climate trends the temporal extent of 20 years may be too short, but was the best data available. Increased spatial coverage is also needed to comprehensively analyze alpine wind speed and blowing snow trends. In complex terrain, a dataset with finer spatial resolution is more attractive because it may capture the localized, convective meteorology, which is common in mountainous terrain. NARR was viewed as a solution because it is a dataset that maintains fine spatial resolution, has many improvements compared to other similar datasets, and is consistent (Messinger et al. 2006). The NARR dataset has been used to help answer questions concerning precipitation variability, identify patterns in weather and climate, represent extreme events, make regional assessments and forecast future climate scenarios. However, before NARR can be used to expand spatial coverage, we first must understand how well it captured
atmospheric conditions influencing snow transport in alpine regions.
NARR data are derived from surface and upper air meteorological observations, which are organized into 32 km horizontal grids consisting of 45 vertical levels. Grid cell estimates of meteorological parameters are available every 3 hours from 1979 to present. Data output includes, but is not limited to, surface temperature, precipitation, humidity, radiation, wind, pressure, convective energy, snow depth, and albedo (NCEP2009). NARR also assimilates observational data, and as a result, draws a closer relationship between NARR and observational
5
variables (Messinger et al. 2006; Lin et al. 1999). Data consistency is improved because all datasets are assimilated into the same climate model for the entire extent of NARR data (NCEP 2009).
Temperature, humidity, pressure and wind speed are collected and assimilated into NARR from rawinsondes or weather balloons. Rawinsondes are launched twice daily from a network of sites and the data are evaluated to create a vertical profile of the atmosphere. These data are then organized and reanalyzed to provide a complete spatial replication of the
atmosphere (Oort 1977). The North American rawinsonde network is comprised of
approximately 120 launch sites, a majority of which have been consistently operated by the National Weather Service since the early 1950’s (National Weather Service Forecast Office 2010).
To more comprehensively assess ground-level precipitation data from the contiguous U.S. (CONUS) were assimilated into NARR from various sources: National Climatic Data Center (NCDC) cooperative stations, and Hourly Precipitation Data (HPD) (Shafran et al. 2004). Over 11,000 station observations create a 1/8˚ grid in the U.S. (Shafran et al. 2004). In Canada and Mexico, where gauge stations are limited, a 1˚ gridded precipitation dataset exists (Shafran et al. 2004). The assimilation of these data also affords more realistic precipitation events and totals.
While NARR functionally reduces data inconsistencies arising from instrument disparities at individual weather stations, it is still affected by limitations of sparse and temporally inconsistent meteorological observations. Regions with sparsely distributed gauges (deserts, mountains, rangelands, and remote, unpopulated areas) and a limited number of rawinsonde launch sites have resulted in the misrepresentation of large or diverse areas (Hiemstra et al. 2006; Businger et
6
al. 2001). Weaknesses were confirmed in Canada, where the number of precipitation gauges and rawinsonde launches were few (Messinger et al. 2006). Limitations were also observed in areas of complex terrain and caused by a larger frequency of cumulus convective events and localized meteorological dynamics (Kistler et al. 2001). Since NARR is largely based on rawinsonde data at, and above, mountain top level, NARR data may be well suited for expanding and improving information about alpine weather and climate. However, there appears to be few previous studies utilizing NARR data to investigate alpine wind patterns, blowing snow processes and changes over time.
Study Area
The comparisons between in situ meteorological station and NARR data were conducted to understand how comparable NARR data were to observed alpine conditions. This analysis allowed us to determine if NARR data could be used to reconstruct alpine atmospheric conditions and expand spatial coverage. Criteria for site selection included: a minimum of 20 years of consistent surface weather data, instrumentation situated above 3000 meters and a location where minimal land use-land cover change has occurred (Figure 1). The Long Term Ecological Research (LTER) station at Niwot Ridge, Colorado, referred to as Niwot, and Glacier Lakes Ecological Experiments Station (GLEES), Wyoming meteorological stations met these requirements. The NARR grid cells encompassing each meteorological station are identified (Figure 2).
7
Figure 1: Location of meteorological stations in Colorado and Wyoming.
8
The meteorological parameters analyzed were temperature, precipitation and wind speed. In situ wind and temperature data were acquired from research facilities at Niwot (LTER 2009) and GLEES (Korfmacher and Hultstrand 2009). Precipitation data were harvested from proximal Snowpack Telemetry (SNOTEL) stations for both locations so that instrumentation and quality control procedures were consistent. SNOTEL stations collect climate and snowpack related data to better forecast water resources within the western mountains of the U.S and Alaska (NRCS 2010). SNOTEL sites are typically located away from ridges or wind dominated areas to maximize collection accuracy. Tables 1 and 2 delineate the parameter details for both in situ stations (Table 1) and NARR (Table 2) datasets. For each location, NARR data were set to the same time frame as the in situ dataset.
Table 1: In situ station details for meteorological parameters, location and dataset extent.
Station Meteorological
parameter
Name Latitude Longitude Elevation Tower
height
Years
Niwot Wind speed
Temperature Niwot - D-1 station 40.05944 -105.6166 3743 m 9 m 1989 -2008 Precipitation Niwot SNOTEL 40.03583 -105.4291 3018 m 2.5 m
GLEES Wind speed
Temperature GLEES 41.38400 -106.2280 3300 m 15 m 1989-2009 Precipitation Brooklyn Lakes SNOTEL 41.36670 -106.2330 3115 m 2.5 m
Table 2: NARR grid cell locations, meteorological parameter details and dataset extents. The latitude and longitude coordinates are the center points of the grid cells.
NARR Meteorological
parameters
Grid coordinates
Latitude Longitude Elevation Height Years
Niwot Wind speed
Temperature Precipitation 178, 109 40.087 -105.688 2976 10 m 10 m 10 m 1979-2009 GLEES Wind speed
Temperature Precipitation 176, 113 41.247 -106.429 2681 10 m 10 m 10 m 1979-2009
9 Methods Data preparation
To quantify trends at different temporal scales, annual, seasonal and daily means were analyzed. Data for the Niwot in situ site spanned from 1989 to 2008 and GLEES data spanned a similar extent from 1989 to 2009. The NARR data, although of longer extent, were reduced to match the respective in situ record. Daily means (0000 – 2400 MST) were organized into hydrologic years (October 1st to September 30th). Annual means were calculated from all daily means per year and seasonal means were derived from appropriate daily means for each year. Seasons were defined as September, October, and November (fall); December, January and February (winter); March, April, and May (spring) and June, July and August (summer). NARR daily precipitation totals can be estimated at miniscule amounts (e.g. 0.00034 mm), which is an artifact of the model. To remedy these arbitrary precipitation values when NARR daily means were below 0.2 mm the value was changed to zero. This value was chosen because it was the threshold that minimized data that were likely an artifact of the NARR model.
Statistical procedures
Multiple analyses were conducted to evaluate data correlation and temporal trends of alpine climatic conditions for NARR and in situ datasets. The degree of correlation between in situ and NARR data was assessed for each of the three response variables: temperature, precipitation and wind speed.
To further understand wind speed patterns and trends additional analyses were conducted. The first test consisted of fitting a linear regression model to annual, seasonal and daily mean time series data. We tested the significance of the estimated trends and compared the trends
10
between in situ and NARR data. In each of these models, we assumed the error to be normally distributed, however not necessarily independent. The analysis of daily time series data required a more complex analysis due to autocorrelation of the daily values. An exploratory analysis indicated that an autocorrelation regression model (AR (1)) would be adequate to model the residual dependence in the daily mean time series data for each of the three data types (Ott and Longnecker 2001).
Wind speeds were also analyzed at set thresholds to observe the frequency of winds
influencing snow transport. A threshold is the minimum wind speed required to initiate or sustain snow transport (Schmidt 1986; Pomeroy and Grey 1990). Wind speeds greater than 5 m s-1 are sufficient to transport unbonded snow. Wind speeds below this threshold likely cause minimal or no snow transport (Li and Pomeroy 1997). When winds reach speeds greater than 14 m s-1 and snow particles are not fully bonded, the amount of blowing snow increases (Li and Pomeroy 1997). Thus, thresholds were categorized as < 5, 5-14and >14 m s-1.
To assess the frequency and intensity of blowing snow, precipitation, wind speed and temperature were used to index a day where blowing snow was probable defined as blowing snow day (BSD). A BSD was established when temperatures were 0 degrees Celsius or below, wind speeds were in either 5-14 m s-1 or >14m s-1 category and when precipitation was present. Since blowing snow could occur on days when precipitation was not present, the subsequent four days were also included but only if temperature and wind speed specifications were met.
The same method was used to analyze wind speed threshold frequency distributions and BSDs by applying a binary response to each daily data point. A value of 1 was assigned when criteria were met for each category, otherwise a 0 was assigned and then each category was
11
summed. To compare the count data for the different categories, odds ratios were computed and inferences were performed using the Gaussian approximation to the log-odds ratio.
Results
NARR and in situ temperature, precipitation and wind speed correlation
Results from NARR and in situ temperature data proved to be highly correlated. The r2 values for temperature were 0.84 at Niwot (1989-2008) and 0.85 for GLEES 1989-2009). In situ stations recorded slightly colder temperatures compared to NARR, where the average degree difference was 1˚ C at Niwot and 4˚C at GLEES. Although temperatures were highly correlated, temporal trends differed between NARR and in situ data for the Niwot site. Temperatures have significantly increased at the Niwot in situ station of 1.5˚ C per decade (p=0.02). However, NARR data did not portray similar significance. The point estimate showed an increasing trend of 0.04˚ C per decade, but was not significant (p=0.87) indicating the NARR temperature trend was not significantly different than zero. No significant temperature trends were observed at GLEES.
Precipitation and wind speed data ranged in agreement. The correlation between in situ and NARR precipitation data proved highly uncorrelated with r2 value of 0.001 and 0.186 for Niwot and GLEES, respectively.
Wind speed correlation values for Niwot and GLEES were fairly similar but not significant with r2 value of 0.36 and 0.38 for Niwot and GLEES, respectively. Both in situ meteorological stations showed higher wind speeds compared to NARR.
Temporal trend analyses for wind speed
Long-term wind speed trend analyses were conducted for annual, seasonal and daily means. No significant annual trends were present for the meteorological stations or NARR sites.
12
Niwot seasonal trends for both in situ and NARR were not significant. The hypothesis β1 = 0 (i.e., no trend) was tested and if this trend was not zero, the alternative hypothesis was accepted if p-value ≤ 0.1 level. Although slight, GLEES NARR data had a positive significant trend during the winter season of 0.0402 m s-1 a-1 (p=0.06). However, no trend was observed for the
GLEES in situ station for the winter season (Figure 3b). The differences in means between NARR and in situ winter mean data are apparent for both sites in Figure 3, but more pronounced for Niwot. (a) Niwot Year 1989 1991 1993 1995 1997 1999 2001 2003 2005 2007 2009 Means m s -1 0 2 4 6 8 10 12 14 16 In situ NARR (b) GLEES Year 1989 1991 1993 1995 1997 1999 2001 2003 2005 2007 2009 Me ans m s -1 0 2 4 6 8 10 12 14 16
Figure 3: Seasonal wind speed means for December, January, and February (winter); (a) Niwot and (b) GLEES. The
GLEES NARR seasonal winter trend is significantly (p < 0.1) increasing at by 0.04 m s-1 per year.
Daily wind speed values were categorized into seasons to best assess trends. The daily trend analyses showed no changes over time for the Niwot in situ station. Winter daily means for both NARR datasets indicated a positive trend for Niwot at 0.0368 m s-1 a-1 (p=0.01) and GLEES at 0.0388 m s-1 a-1 (p=0.05). The GLEES meteorological station had a negative trend for summer daily means at -0.0349 m s-1 a-1 (p=0.01). Again, higher wind speeds for the in situ data were captured. For a visual representation all daily wind speed means for the extent of the data are shown in Figure 4.
13 (a) Niwot Year 1989 1991 1993 1995 1997 1999 2001 2003 2005 2007 2009 Dail y W in d Spee d (m s -1) 0 5 10 15 20 25 30 In situ NARR (b) GLEES Year 1989 1991 1993 1995 1997 1999 2001 2003 2005 2007 2009 Da ily W in d Sp e e d (m s -1) 0 5 10 15 20 25 30
Figure 4: In situ station and NARR daily mean wind speeds, (a) Niwot, and (b) GLEES. To display the seasonal variance all daily means are presented, with winter months as the peaks and summer months as the valleys.
Overall, both locations exhibited very few significant trends for annual, seasonal and daily means and trends were rarely consistent between in situ and NARR. Detailed results are listed in Table 3. The statistical comparison of trend variance and correlation between in situ and NARR showed all trends as statistically similar. Meaning similarities were consistent among all trends even when the trends had opposite signatures or differing degrees of significance.
14
Table 3:Results from annual, seasonal and daily mean wind speeds are presented. In addition, a mean was derived from
the entire wind speed dataset for each site so the amount of change could be conceptualized. Trend values are meters per
second per year m s-1 a-1. Significance codes: 0.01 ‘*’; 0.05 ‘+’; <0.1 ‘^ ’. Seasonal divisions are fall (September, October,
November); winter (December, January, February); spring (March, April, May); and summer (June, July, August).
Dataset Annual trend in m s-1 a-1 Season Overall mean Seasonal trends in m s-1 a-1 Daily trends in m s-1 a-1 Niwot in situ 1989-2008 mean in m s-1 0.0058 9.617 Fall winter spring summer 10.39 12.35 9.324 6.218 0.0032 0.0238 0.0274 -0.0132 -0.0010 0.0191 0.0085 -0.0167 Niwot NARR 1989-2008 mean in m s-1 0.0078 5.465 fall winter spring summer 5.515 6.836 5.559 3.977 -0.0071 0.0265 0.0123 -0.0035 -0.0153 0.0368^ 0.0153 -0.0136 GLEES in situ 1989-2009 mean in m s-1 -0.0203 7.838 fall winter spring summer 7.885 10.35 7.930 5.269 -0.0212 -0.0085 -0.0196 -0.0304^ -0.0421 -0.0041 -0.0268 -0.0349 * GLEES NARR 1989-2009 mean in m s-1 0.0148 5.958 fall winter spring summer 6.091 7.248 5.961 4.558 -0.0032 0.0402 ^ 0.0219 0.0005 -0.0029 0.0388 + 0.0189 -0.0085
Sample variance temporal trends for daily mean wind speeds
Daily mean wind speeds were also tested for temporal trends in the variance. A
preliminary analysis was conducted in which the sample variance of daily mean wind speeds was found for each season within each year and then a linear regression was fit. The sample variances were treated as data, not accounting for the uncertainty in the estimates. The hypothesis that β1= 0 (i.e., no trend) was tested, and all tests failed to reject this null hypothesis at the p-value ≤ 0.1 level. As these preliminary results provided evidence that significant trends are not present, no additional analyses were performed.
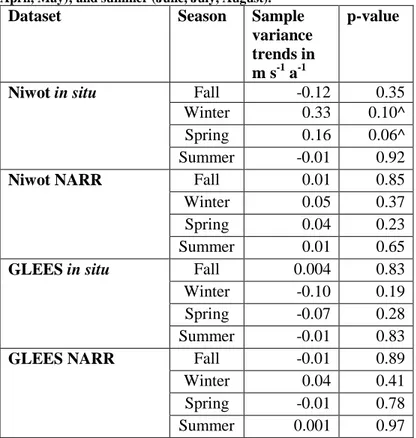
The sample variance plots for Niwot and GLEES for the winter and spring seasons are shown in Figure 5. These seasons were chosen because the trends show the lowest p-values, which were less than p-value = 0.1 level. Niwot in situ data shows a significant increasing trend in the sample variance for winter 0.33 m s-1 a-1 and spring 0.16 m s-1 a-1 with p-value = 0.1 and
15
0.06, respectively. No significant trends were present for Niwot NARR or either GLEES datasets. The full results can be reviewed in Table 4.
(a) Niwot winter
Year 1988 1990 1992 1994 1996 1998 2000 2002 2004 2006 2008 2010 Sample v ar ian c e 0 5 10 15 20 25 30 35 40 (b) GLEES winter Year 1988 1990 1992 1994 1996 1998 2000 2002 2004 2006 2008 2010 S ampl e vari ance 0 5 10 15 20 25 30 35 40 (c) Niwot spring Year 1988 1990 1992 1994 1996 1998 2000 2002 2004 2006 2008 2010 S ampl e vari ance 0 5 10 15 20 25 30 35 40
NARR sample variance
In situ sample variance Linear regression (d) GLEES spring Year 1988 1990 1992 1994 1996 1998 2000 2002 2004 2006 2008 2010 S ampl e vari ance 0 5 10 15 20 25 30 35 40
Figure 5: Sample variances plotted for daily mean wind speeds with linear regression trend line for (a) Niwot winter, (b) GLEES winter, (c) Niwot spring, and (d) GLEES spring.
16
Table 4: Sample variance results for daily mean wind speed for each Niwot and GLEES sites datasets. The slope of the
trend in the sample variances are displayed in meters per second per year (m s-1 a-1) Significance codes for p-values: <0.1
‘^ ’. Seasonal divisions are fall (September, October, November); winter (December, January, February); spring (March, April, May); and summer (June, July, August).
Dataset Season Sample
variance trends in m s-1 a-1
p-value
Niwot in situ Fall -0.12 0.35
Winter 0.33 0.10^
Spring 0.16 0.06^
Summer -0.01 0.92
Niwot NARR Fall 0.01 0.85
Winter 0.05 0.37
Spring 0.04 0.23
Summer 0.01 0.65
GLEES in situ Fall 0.004 0.83
Winter -0.10 0.19
Spring -0.07 0.28
Summer -0.01 0.83
GLEES NARR Fall -0.01 0.89
Winter 0.04 0.41
Spring -0.01 0.78
Summer 0.001 0.97
Frequency of wind speeds exceeding thresholds
The frequency of wind speeds exceeding set thresholds differed between in situ and NARR datasets. There were no significant annual trends observed at Niwot for either dataset or for GLEES NARR data. The GLEES meteorological station data demonstrated a negative annual trend for winds >14 m s-1 at -0.131% per year (p=0.05).
The percentage of wind speeds occurring in each threshold category are displayed in Figure 6 for the winter season. When NARR winds were divided seasonally there were too few positive responses for wind speeds >14 m s-1 to accurately be analyzed, which indicates that the high winds were not accurately captured by NARR. GLEES station data showed opposing significant trends for winter at different thresholds. Specifically, a decreasing trend was observed for winds > 14 m s-1 and an increasing trend for 5-14 m s-1,at a similar rate of -0.562% and
17
0.486% per year (p=0.05), respectively. The summer season for both in situ and NARR data rarely experience winds stronger than 14 m s-1, so summer data were excluded from analyses.
(a) Niwot NARR
Year 1989 1991 1993 1995 1997 1999 2001 2003 2005 2007 2009 Pr opor tion of annu al w ind s peed s 0.0 0.2 0.4 0.6 0.8 1.0
1.2 (b) Niwot in situ station
Year 1989 1991 1993 1995 1997 1999 2001 2003 2005 2007 2009 Propor tion of annu al w ind s peed s 0.0 0.2 0.4 0.6 0.8 1.0 1.2 (c) GLEES NARR Years 1989 1991 1993 1995 1997 1999 2001 2003 2005 2007 2009 Pr opor tion of annu al w ind s peed s 0.0 0.2 0.4 0.6 0.8 1.0 1.2
(d) GLEES in situ station
Years 1989 1991 1993 1995 1997 1999 2001 2003 2005 2007 2009 P ropo rti on o f ann ual w ind s pee ds 0.0 0.2 0.4 0.6 0.8 1.0 1.2
Figure 6: Wind speeds exceeding set thresholds during winter (December, January and February) displayed as a proportion of annual wind speeds per winter season; (a) Niwot NARR, (b) Niwot in situ station, (c) GLEES NARR, and (d) GLEES in situ station.
The variance was tested using three threshold categories, which influence snow transport. Overall, the binary responses of wind speeds in each category changed minimally over time. Table 4 shows the percentage of days per year that have changed for each threshold category. The in situ and NARR data showed trends as similar for all categories except for annual GLEES wind speeds >14 m s-1 and Niwot winter wind speeds 5-14 m s-1. The bold text in Table 5 shows represents significantly different trends between NARR and in situ datasets.
18
Table 5: All results from wind speed values exceeding set thresholds at annual, seasonal and daily temporal scales for Niwot data span 1989-2008 and GLEES data span 1989-2009. Trend values in each threshold category are percentage of days per year that have increased or decreased over time. Significance codes: 0.01 ‘*’; 0.05 ‘+’; <0.1 ‘^’. The seasonal divisions are fall (September, October, November), winter (December, January, February), spring (March, April, May),
and summer (June, July, August). Bold text represents statistically different trends between in situ and NARR in percent
change per year (% a-1).
Dataset Annual trends (percentage of
days per year changing)
Seasonal Trends (percentage change per year) <5 m s-1 5 - 14 m s-1 >14 m s-1 <5 m s-1 5 - 14 m s-1 >14 m s-1
Niwot Ground 0. 028 -0.118 0.090 fall
winter spring summer -0.265 0.242 -0.213 0.298 0.332 0.447 -0.111 -0.305 -0.068 0.205 0.323^ n/a
Niwot NARR -0.080 0.069 0.021^ fall
winter spring summer 0.194 -0.359 -0.193 0.213 -0.191 0.359 0.188 -0.034 N/A
GLEES Ground 0.144 0.043 -0.186* fall
winter spring summer 0.0599 -0.025 -0.100 0.685 0.020 0.486* 0.017 -0.692 -0.262* -0.562* -0.072 N/A
GLEES NARR -0.131 0.121 0.010 fall
winter spring summer 0.060 -0.384 -0.357 0.158 -0.069 0.355 0.557 -0.158 N/A
Blowing snow day trend analysis
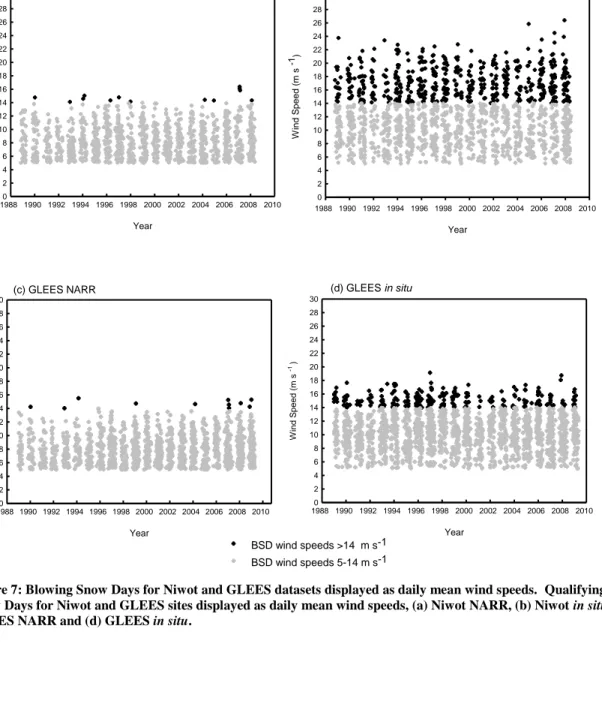
Niwot in situ and NARR data for BSDs were not significant for both annual and seasonal temporal scales. The absence of trends could be caused by mean temperature increases, which would influence the positive response of BSDs. Another aspect influencing BSD trend
differences between NARR and in situ data is the magnitude of recorded wind speeds (Figure 7). NARR rarely contains wind speed data above 14 m s-1 so identifying blowing snow days with faster wind speeds was limited. These higher wind speeds are critical when estimating the extent of blowing snow in the alpine.
GLEES had multiple significant results for BSDs. The lack of increasing temperature trends could be a contributing factor. Annually, GLEES in situ BSD data showed a negative trend of 0.182% per year when winds were >14 m s-1. Seasonal results showed GLEES in situ winter data with a positive trend for >5-14 m s-1 at 0.724% per year and significance of p=0.05.
19
GLEES NARR BSDs showed, with varying significance, increasing trends for all thresholds and temporal scales. These positive trends, along with the other BSD results are presented in Table 6.
(a) Niwot NARR
Year 1988 1990 1992 1994 1996 1998 2000 2002 2004 2006 2008 2010 W ind Spe ed ( m s -1) 0 2 4 6 8 10 12 14 16 18 20 22 24 26 28 30 (b) Niwot in situ Year 1988 1990 1992 1994 1996 1998 2000 2002 2004 2006 2008 2010 W ind Spe ed ( m s -1) 0 2 4 6 8 10 12 14 16 18 20 22 24 26 28 30 (d) GLEES in situ Year 1988 1990 1992 1994 1996 1998 2000 2002 2004 2006 2008 2010 W in d S p e e d ( m s -1 ) 0 2 4 6 8 10 12 14 16 18 20 22 24 26 28 30 BSD wind speeds >14 m s-1 BSD wind speeds 5-14 m s-1 (c) GLEES NARR Year 1988 1990 1992 1994 1996 1998 2000 2002 2004 2006 2008 2010 W ind Spe ed ( m s -1 ) 0 2 4 6 8 10 12 14 16 18 20 22 24 26 28 30
Figure 7: Blowing Snow Days for Niwot and GLEES datasets displayed as daily mean wind speeds. Qualifying Blowing Snow Days for Niwot and GLEES sites displayed as daily mean wind speeds, (a) Niwot NARR, (b) Niwot in situ, (c) GLEES NARR and (d) GLEES in situ.
20
Table 6: Blowing Snow Day trend values listed as percentage of change per year (% a-1). Wind speeds (m s-1) are also
categorized into 5-14 m s-1 and > 14m s-1. Summer is not included due to minimal number of days where BSD conditions
exist. Significance codes: 0.001 ‘**’; 0.01 ‘*’; 0.05 ‘+’; <0.1 ‘^’. fall – September, October, November; winter – December, January, February; spring – March, April, May; summer – June, July, August. Bold text represents statistically different trends between data types.
Dataset Annual trends (percent
change per year)
Seasonal Trends (percent change per year)
5 - 14 m s-1 >14 m s-1 Months 5 - 14 m s-1 >14 m s-1
Niwot ground 0.026 0.148 fall
winter spring 0.004 -0.075 0.227 0.188 0.197 0.227
Niwot NARR 0.281 0.020 fall
winter spring 0.176 0.754 0.188 N/A
GLEES ground 0.182 -0.130* fall
winter spring 0.154 0.724* -0.084 -0.119 -0.349^ -0.087
GLEES NARR 0.692*** 0.010 fall
winter spring 0.515^ 1.93*** 0.325 N/A Discussion
Meteorological parameters have different variability and temporal continuity
characteristics and, as a result, the observation accuracy of each parameter ranges. For example temperature data, even when accounting for diurnal effects, lack dramatic oscillations and are continuous (Hiemstra et al. 2006). As a result, temperature data tend to have higher correlation among datasets when compared to other meteorological parameters. This effect was present in this study and in a similar study by Hiemstra et al. (2006) who found temperature r2 values ranged from 0.64 to 0.99 between NOAA’s Local Analysis and Prediction System (LAPS) gridded data and 107 in situ station datasets. LAPS, similar to NARR, assimilates multiple observational meteorological datasets creating a three-dimensional model of atmospheric processes. The Hiemstra et al. (2006) study compared temperature, precipitation, relative humidity, and wind data for two years in the northern high plains region of the U.S. They found the average temperature differences between the datasets was <2˚C. Results from this study were comparable, with an average 2.5˚ C temperature difference between all NARR and in situ data.
21
Precipitation data collection methods have long been plagued with accuracy issues. All precipitation gauges are affected by wind, wetting, evaporation, and inaccurate trace
precipitation collection (Guirguis and Avissar 2008). For NARR, many issues inhibit accurate precipitation data. For starters, the spatial distribution of assimilated observational points is irregular and sparse. There is also a linear decrease in the number of observational datasets assimilated into NARR northward from 20˚N to 50˚N (Messinger et al. 2006). Dynamic
meteorological processes may be missed in complex terrain due to the fewer number of stations as well (Hiemstra et al. 2006). Another issue concerning NARR precipitation data is the
magnitude of daily precipitation totals. NARR records miniscule amounts of precipitation (e.g. 0.00004 mm) regularly, instead of less frequent and more realistic precipitation totals. Hiemstra et al. (2006) found r2 values ranged from 0.01 to 0.76 between in situ stations and LAPS
precipitation data. The smaller r2 coefficients were observed at higher elevations and in areas with more topographic relief.
Precipitation data have shown more inconsistencies when temperatures drop below 0˚ Celsius and precipitation is in the form of snow. Sugiura et al. (2006) found zero gauge catch became more frequent when snowfall was present and wind speeds were 6 m s -1 or greater. Groisman and Legates (1994) showed gauges during the winter recorded 20% less precipitation compared to actual precipitation totals and the under-catch for individual storm was up to 75% less.
The lower correlation values for wind speed between in situ stations and NARR may be explained by the differences in topographical characteristics between in situ station locations and NARR grid cells. The in situ stations record wind speeds at a specific point in a landscape. NARR smoothes terrain and applies an average elevation to each grid cell, in effect minimizing
22
the complexities of large-scale flows and localized weather events (Whiteman 2000). Besides topographical complexities, elevation differences further confound the wind speed differences. As elevation increases, wind speeds increase due to reduced surface friction and lower air density. Both in situ stations are at a higher elevation compared to the NARR grid cell, the difference is 767 m at Niwot and 619 m at GLEES. The difference in elevation likely contributes to higher wind speeds observed at the in situ sites. Hiemstra et al. (2006) found a similar and slight correlation between in situ stations and LAPS data for wind speed, the r2 values ranged from 0.01 to 0.85 and the agreement declined with elevation gain.
The investigation of 20 years of wind speed data at annual, seasonal and daily temporal scales and the daily mean sample variance showed a minimal number of significant trends. When variance and correlation were calculated to compare in situ and NARR temporal trends, most trends were not significantly different either. Meaning, the slope and the signature (positive or negative trend) of the trends were statistically similar between in situ and NARR data even when both signature and slope were opposite. This result was due to low slope angles of the trends that suggest only slight long-term trends exist. Another viable explanation pertains to the length of the dataset, different trends may present when different temporal extents are analyzed. Alpine wind speeds in Switzerland showed trends that were sensitive to the temporal extent with an increasing trend of 0.0067 m s-1 a-1 for 1960-2006 and a decreasing trend of -0.086 m s-1 a-1 for 1983 to 2006 (McVicar et al. 2010). It is possible that a few windy or still years or a different temporal scale could present different results in this research.
The division of wind speeds into threshold categories identifies how NARR and in situ datasets differ. For all categories the in situ stations record higher wind speeds. During the winter, when winds are the highest and blowing snow occurs, large discrepancies between
23
NARR and in situ data were observed for threshold frequency categories. Both the Niwot and GLEES in situ stations maintained wind speeds in the >14 m s-1 threshold category for 50% and 20% of the time, respectively. During the winter months NARR accounted for wind speeds in the >14 m s-1 category only 1% of the time and NARR over represented wind speeds in the <5 m s-1 and 5-14 m s-1. Moore et al. (2006), in a historically windy location off the coast of Greenland, found NARR underestimated high winds as well. The inability of NARR to accurately estimate wind speeds, especially high winds, limits the use of NARR to analyze wind speed climates and blowing snow trends in alpine locations.
The results from BSD analyses showed trends as similar between NARR and in situ data. However, these results are misleading because BSDs are dependent on precipitation, temperature and wind speed data being highly correlated between datasets and the lack of such largely affect trend comparisons for BSDs. For example, wind speeds captured by NARR were lacking the frequency (count) and intensity (wind speed) of wind speeds >14 m s-1, which would likely minimize the degree of blowing snow in an alpine environment.
The lack of correlation for precipitation and wind speed data causes the BSD trend results to be unreliable. As a result, winter alpine meteorological processes were different between NARR and in situ data and this limitation strained the use of NARR for a more broad scale analysis of temporal trends. Identifying the limitations of NARR for alpine sites establishes a baseline for understanding how NARR is restricted and what type of improvements could be made so that it can continue to provide a dynamically consistent dataset for broad scale analyses.
Due to the numerous analyses conducted a table clearly describing the result of each hypothesis test is presented (Table 7). The results are listed as either accept or reject per hypothesis. To accept a hypothesis, means we accept the alternative hypothesis or fail to reject
24
the null hypothesis because a significant trend or correlation of data was present. Reject indicates that the hypothesis was not supported with trends significantly different from zero.
Table 7: Summarization of each hypothesis test for all analysis conducted.
Hypotheses Analysis Niwot
in situ Niwot NARR GLEES in situ GLEES NARR Temperature, precipitation and wind speed data are highly correlated between NARR and in situ datasets
Temperature Precipitation Wind speed Accept Reject Reject Accept Reject Reject Mean wind speeds show a
significant change (increase or decrease) of temporal trends for annual, seasonal and daily data
Annual Seasonal Daily Reject Reject Reject Reject Reject Reject Reject Reject Reject Reject Reject Reject
The daily mean wind speeds show a significant change in sample variance (increase or decrease) per season, over time.
Fall Winter Spring Summer Reject Accept Accept Reject Reject Reject Reject Reject Reject Reject Reject Reject Reject Reject Reject Reject Wind speed trends are
statistically similar between both datasets at each temporal increment
Annual Seasonal Daily Accept Accept Accept Accept Accept Accept Accept Accept Accept Accept Accept Accept There has been a change in
the percentage of winds at the <5, 5-14 and >14 m s1 thresholds per year
<5 5-14 >14 m s Reject Reject Reject Reject Reject Accept Reject Reject Accept Reject Reject Reject The number and intensity
of blowing snow days show significant temporal trends annual seasonal Reject Reject Reject N/A Accept Accept Accept N/A Conclusion
The advantage of using NARR to assess alpine meteorological processes and blowing snow trends over time was to expand spatial and temporal coverage. The lack of correlation between in situ and NARR data for alpine meteorological processes led to limitations in assessing long-term wind speed and blowing snow trends across the Front Range of the Rocky Mountains. Results from comparing these data indicated that temperature data were the highest
25
correlated, on average, with an r2 of 0.845. Precipitation data agreement was lower with an average r2 value of 0.094. Precipitation correlation disparities were likely a combination of observational errors, NARR measurement limitations, and complications associated with
precipitation as snow. Wind speed data achieved an average r2 value of 0.37. NARR wind speed data were consistently lower than in situ data and likely contributed to the lower r2 values. Although the intensity of wind speeds was missed by NARR, the frequency of wind speeds was comparable to in situ data. The lack of agreement between meteorological parameters showed that blowing snow processes were better assessed by observational datasets. The slight and varied significance for temporal trends from all datasets calls for additional analyses of in situ alpine station meteorological data to understand if similar long-term trends are local or
widespread.
Long-term changes and the variability of wind speeds would have a widespread effect on snow transport and distribution. The distribution of snow has become increasingly important for water resource estimates, especially in the mountainous regions of the Western U.S. where climate change projections indicate decreases in annual snowpack (IPCC 2007).
26
Literature cited
Barnett, T. P., J. C. Adam, and D. P. Lettenmaier, 2004: Potential impacts of a warming climate on water availability in snow-dominated regions. Nature, 438, 303-309.
Beniston, M., 2006: Mountain weather and climate: A general overview and a focus on climatic change in the Alps. Hydrobiologia, 562, 3-16.
Businger, S., M. E. Adams, S. E. Koch, and M. L. Kaplan, 2001: Extraction of geopotential height and temperature structure from profiler and rawinsonde winds. Mon. Wea. Rev., 129, 1729-1739.
Elder, K., J. Dozier, and J. Michaelsen, 1991: Snow accumulation and distribution in an alpine watershed. Water Resour. Res., 27, 1541-1552.
Garratt, J. R., 1994: Review: the atmospheric boundary layer. Earth-Sci Rev., 37, 89-134.
Greene, E. M., G. E. Liston, and R. A. Pielke, 1999: Simulation of above treeline snowdrift formation using a numerical snow-transport model. Cold Reg. Sci. Technol., 30, 135-144. Guirguis, K. J., and R. Avissar, 2008: A precipitation climatology and dataset intercomparison for the Western United States. J. Hydrometeor., 9, 825-841.
Groisman, P. Y., and D. R. Legates, 1994: The accuracy of United States Precipitation. Bull. Amer. Meteor. Soc., 75, 215-227.
Hiemstra, C. A., G. E. Liston, R. A. Pielke, D. L. Birkenheuer, and S. C. Albers, 2006: Comparing Local Analysis and Prediction System (LAPS) assimilations with independent observations. Wea. Forecasting, 21, 1024-1040.
Jiang, Y., Y. Luo, Z. C. Zhao, and S. W. Tao, 2010: Changes in wind speed over China during 1956-2004. Theor. Appl. Climatology, 99, 421-430.
Kistler, R., and Coauthors, 2001: The NCEP-NCAR 50-year reanalysis: Monthly means CD-ROM and documentation. Bull. Amer. Meteor. Soc., 82, 247-267.
Klink, K. , 1999: Climatological mean and interannual variance of United States surface wind speed, direction and velocity. Int. J. Climate., 19, 471-488.
Klink, K., 2002 Trends and interannual variability of wind speed distributions in Minnesota. J. Climate., 15, 3311-3317.
27
Korfmacher, J. L., and D. M. Hultstrand, cited 2009: Rocky Mountain Research Station, Glacier Lakes Ecosystem Experiments Site hourly meteorological tower data: 1989-2005. [Available online at http://www.fs.fed.us/rm/data_archive/dataaccess/GLEES_meteorology.shtml.]. Legates, D. R., and T. L. DeLiberty, 1993: Precipitation measurement biases in the United States. J. Amer. Water Resour. Assoc., 29, 855–861.
Li, L., and J. W. Pomeroy, 1997: Estimates of threshold wind speeds for snow transport using meteorological data. J. Appl. Meteor., 36, 205-213.
Lin, Y., K. E. Mitchell, E. Rogers, M. E. Baldwin, and G. J. DiMego, 1999: Test assimilations of the real-time, multi-sensor hourly precipiation analysis into the NCEP Eta model. Preprints, 8th Conference on Mesoscale meteorology, Boulder, CO, Bull. Amer. Meteor. Soc., 341-344. Liston, G. E., R. B. Haehnel, M. Sturm, C. A. Hiemstra, S. Berezovskaya, and R. D. Tabler, 2007: Instruments and methods simulating complex snow distributions in windy environments using SnowTran-3D. J. Glaciol., 53, 241-256.
Long Term Ecological Research, cited 2009: Niwot Ridge Data, [Available online at
http://culter.colorado.edu/NWT/data/datmansearch.html.]
McVicar, T. R., T. G. Van Niel, L. T. Li, M. L. Roderick, D. P. Rayner, L. Ricciardull, and R. J. Donohue, 2008: Wind speed climatology and trends for Australia, 1975-2006: Capturing the stilling phenomenon and comparison with near-surface reanalysis output. Geophys. Res. Lett.,
35, doi:10.1029/2008GL035627.
McVicar, T. R., T. G. Van Niel, M. L. Roderick, L. T. Li, X. G. Mo, N. E. Zimmermann, and D. R. Schmatz, 2010: Observational evidence from two mountainous regions that near-surface wind speeds are declining more rapidly at higher elevations than lower elevations: 1960-2006.
Geophys. Res. Lett., 37, doi:10.1029/2009GL042255.
McVicar, T. R., and Coauthors, 2011: Global review and synthesis of trends in observed terrestrial near-surface wind speeds: Implications for evaporation, J. Hydro, doi:
10.1016/j.jhydrol.2011.10.024.
Mesinger, F., and Coauthors, 2006: North American Regional Reanalysis. Bull. Amer. Meteor. Soc., 87, 343-360.
Moore G. W. K., R. S. Pickart, and I. A. Renfrew, 2008: Bouy observations from the winiest location in the world ocean Cape Farewell, Greenland. Geophys. Res. Lett., 35,
doi:10.1029/2008GL034845.
National Weather Service Forecast Office, cited 2010: Collecting meteorological data by radiosonde of weather balloon. [Available online at
28
NCEP: North American Regional Reanalysis (NARR), cited 2009: Information. [Available online at http://www.esrl.noaa.gov/psd/data/gridded/data.narr.html.]
Oort, A.H., 1977: Adequacy of the rawinsonde network for global circulation studies tesed through numerical model output. Mon. Weather Rev., 106, 174-195.
Ott, R. L., and M. Longnecker, 2001: An Introduction to Statistical Methods and Data Analysis 5th edition, Duxbury Thomson Learning, 1152 pp.
Pachauri, R. K., and A. Reisinger, (eds.), 2007: Global climate projections. Climate Change 2007: Synthesis Report. Contribution of Working Groups I, II and III to the Fourth Assessment Report of the Intergovernmental Panel on Climate Change. IPCC, Geneva, Switzerland, 104 pp. Pirazzoli, P. A., and A. Tomasin, 2003: Recent near-surface wind changes in the central
Mediterranean and Adriatic areas. Int. J. Climate., 23, 963-973.
Pomeroy, J. W., and D. M. Gray, 1990: Saltation of Snow. Water Resour. Res., 26, 1583-1594. Pryor, S. C., and Coauthors, 2009: Wind speed trends over the contiguous United States. J. Geophys. Res.,[Atmos.], 114, doi:10.1029/2008JD011416.
Roderick, M. L., L. D. Rotstayn, G. D. Farquhar, and M. T. Hobbins, 2007: On the attribution of changing pan evaporation. Geophys. Res. Lett., 34, doi:10.1029/2007GL031166.
Schmidt, R. A., 1986: Transport rate of drifting snow and the mean wind spead profile. Boundary-Layer Meteorology, 34, 213-241.
Shafran, P., J. Woollen, W. Ebisuzaki, W. Shi, Y. Fan, R. Grumbine, and M. Fennessy, 2004: Observational data used for assimilation in the NCEP North American Regional Reanlaysis. Preprints, 14th Conference on Applied Climatology, Seattle, WA, Bull. Amer. Meteor. Soc., 1.4, 5 pp.
Natural Resources Conservation Service (NRCS): SnoTEL Brochure. cited: 2010: [available online at http://www.wcc.nrcs.usda.gov/snotel/SNOTEL-brochure.pdf].
St. George, S., and S. A. Wolfe, 2010: El Nino stills winter winds across the southern Canadian Prairies. Geophys. Res. Lett., 37, doi: 10.1029/2009GL041282.
Sugiura, K., T. Ohata, and D. Q. Yang, 2006: Catch characteristics of precipitation gauges in high-latitude regions with high winds. J. Hydrometeor., 7, 984-994.
Tuller, S., 2004: Measured wind speed trends on the west coast of Canada. Int. J. Climate., 24, 1359-1374.
Whiteman, C. D., 2000: Mountain Meteorology: Fundamentals and Applications. Oxford University Press, Inc., New York, 355 pp.
29
Winstral, A., K. Elder, and R. E. Davis, 2002: Spatial snow modeling of wind-redistributed snow using terrain-based parameters. J. Hydrometeor., 3, 524-538.
30
APPENDIX I: LITERATURE REVIEW
The literature review supplies an overview of research pertaining to wind and snow interactions. First, the broader impacts of wind and snow influencing human activities are covered to highlight the importance of blowing snow. An overview of recent wind research follows and includes an overview of inter-annual variability, seasonality, elevation effects and instrumentation issues pertaining to wind speed. Next, the basics of snow hydrology and snow transport information are covered. This section discusses physical snow processes such as metamorphism, blowing snow, types of snow transport and sublimation. Lastly, there is a description of the North American Regional Reanalysis dataset.
The impacts of wind and snow on human activities
The ability to identify or predict wind trends and snow distribution patterns could significantly improve prediction and planning for winter road hazards, water resources, evapotranspiration rates, avalanche safety, alpine ecology, fire season conditions, agricultural practices, and livestock safety.
Drifting and blowing snow on roadways can cause obstacles and decreased visibility, and increase risks and life-threatening situationsfor motorists, snow removal vehicle drivers and outdoor recreationalists (Audrey et al. 2003; Thompson and Nakhla2002). Nonetheless, people still travel during hazardous winter conditions. Due to the increasing population regular travel and travel to recreation destinations has also increased (Rice et al. 2002). The rise in recreational travel was accounted for by Colorado skier visits, which has grown from 800,000 to over 11 million in the past three decades (http://www.coloradoski.com/page/cscusa-history-contact
31
2010). The 2010-11 winter season hosted 6.9 million winter vacationers in Colorado, an increase of 2.6% from the previous season (http://www.coloradoski.com/page/cscusa-history-contact 2011). This was also observed throughout the Rocky Mountain Region (CO, NM, ID, UT, MT, and WY), where winter vacationers increased by approximately a half of a million people from 2009/10 to 2010/11 (http://www.nsaa.org/nsaa/press/historical-visits.pdf 2011).
Snow avalanches are a winter safety concern, for both recreational and motorists activities. In Colorado approximately 278 avalanche paths affect roadways and are actively monitored and controlled (CDOT 2009). Out of all the western states, including Alaska,
Colorado ranks highest in avalanche mortality between 1950 and 2009 (CAIC 2010). Avalanche safety is a growing concern because the number of deaths caused by avalanches has steadily increased across the country and predominantly affected backcountry recreational activities (i.e., snowshoeing, skiing and snowboarding, snowmobiling, and hiking/climbing). Snowmobile triggered avalanche fatalities and accidents are the highest ranking and fastest increasing of all activities due to the requirement of open, undeveloped backcountry terrain (CAIC 2010; Scott 2003). Fewer avalanche risks and fatalities have been observed at resorts and on roadways because professional patrols mitigate known avalanche slide zones (Page et al. 1999).
Avalanches can develop under a variety of conditions; the prime conditions include new snow, increased wind speed and changes in wind direction (McCollister 2004). An increase in wind speeds can cause the magnitude of an avalanche to grow and become unstable (McCollister et al. 2003; Rice et al. 2002; Bader and Salm 1990). However, in some cases, the probability of a slide occurring is lower when wind redistributes snow from more frequent slide paths to less common slide paths (McCollister et al. 2003). This causes avalanche activity to be more difficult to identify and mitigate.
32
The cattle industry has been impacted by snow and blowing snow. During 2006 the High Plains received over 76 cm of snow. The snow was paired with extreme winds causing blizzard condition winds and resulted in large snow drifts. Harsh weather cause cattle to turn away from oncoming winds and group together to create a natural wind break. Snow drifts accumulate on top of the cattle and can cause freezing, suffocation and sometimes death (Paul et al. 2007). The cattle, in this instance, were unable to reach food or water sources for many days and the deep snow drifts prohibited road access to the cattle as well. Cattle mortality in Colorado was
estimated at 15,000 head, which cost ranchers millions (Paul et al. 2007). Due to the severity of the blizzard disaster-level attention was focused on safety and survival of stranded livestock (Paul et al. 2007). President Bush allocated federal support for 114 counties across the high plains (13 counties in Colorado), and state National Guards dropped emergency supplies to stranded cattle and human populations. The 2006 blizzard highlights a recent event; however, historically blizzards on the Eastern Plains have occurred at a similar intensity (CAIC 2010).
Wind research
There are a variety of methods for collecting wind speed data leading to summarization and comparison challenges when assessing global wind climates trends. One issue with global wind data is the lack of both continuity and consistency temporal and spatial (Groisman et al. 2004; McVicar et al. 2008). Table 8 provides a list of wind-related research worldwide, and datasets include in situ stations, reanalysis, Global Climate Models (GCM). The table includes information covering location, author of the research, data collection type, time frame and observed trends. This body of research revealed similarities among mid-latitude in situ stations for mean wind speed trends. Mean wind speeds, in general, have decreasing over the past 30-50 years in Australia (McVicar et al. 2008), China (Jiang et al. 2009; McVicar et al. 2010),
33
Switzerland (McVicar et al. 2010), Europe (Pirazzoli and Tomasin 2003) and the contiguous U.S. (Pryor et al. 2009; Klink 1999). However, pockets of increasing mean wind speed trends were also evident in these regions. While in situ station datasets in high-latitudes (>65º) showed general increasing wind speed trends (Seidel et al. 2008). Reanalysis datasets showed similar mean wind speed declines as the in situ station data (McVicar et al. 2008). North American Regional Reanalysis (NARR) data showed declining trends over much of the western U.S. (Pryor et al. 2009). However, NARR annual mean wind speeds are negatively biased compared to in situ stations (Pryor et al. 2009). Another reanalysis dataset, the European Center for
Medium-Range Weather Forecasts’ Reanalysis (ERA-40), showed decreasing wind speed trends in the southwestern U.S. and increasing wind speed trends along the Rocky Mountain spine. Pryor et al. (2009) asserted that observational and reanalysis datasets showed considerable inconsistencies for temporal characteristics of wind trends, while RCMs seemed to align more closely with in situ observations.
Sizeable differences between annual mean wind speed trends and interannual variability were observed among Regional Climate Models (RCM), reanalysis products, and direct
observations (Pryor et al. 2009). Additionally, conflicting trends were seen between reanalysis and Regional Climate Model datasets. Overall, no simple summarizations could be made concerning wind speed trends over time, St. George and Wolfe (2009) attribute the
inconsistencies as an artifact of the differing temporal extents among all datasets. If wind speeds have an increasing or decreasing trend, then these trends may be better observed by synoptic and large scale flows (Pryor et al. 2009). Pielke et al. (2001) has assessed large scale flows at the 200 mbar level and found wind speeds to have increased from 1958 to 1997.