Final report of the project SleepEYE II, part 1
ViP publication 2013-1
Authors
Carina Fors, VTI Christer Ahlström, VTI
Anna Anund, VTI
Simulator validation with
respect to driver sleepiness and
subjective experiences
Preface
SleepEYE was a collaborative project between Smart Eye, Volvo Cars and VTI (the Swedish National Road and Transport Research Institute) within the competence centre Virtual Prototyping and Assessment by Simulation (ViP).
The SleepEYE project was carried out during the years 2009–2011, and included the development of a camera based system for driver impairment detection and,
furthermore, the development of a driver sleepiness classifier adapted for driving simulators (Fors, Ahlström et al. 2011).
In 2011, a continuation project called SleepEYE II was initiated. This project included three work packages: 1) simulator validation, 2) assessment of driver sleepiness in the euroFOT database using the camera system that was developed in the SleepEYE project, and 3) further development and refinement of the camera system. All three work packages used the data gathered in the SleepEYE project.
The present report documents the simulator validation that was done in work package 1 of the SleepEYE II project. Carina Fors, Anna Anund and Christer Ahlström have performed the analyses and written the report. Katja Kircher has developed the
validation questionnaire. Anne Bolling has provided valuable input when planning the study. In addition, several researchers within the field of human factors at VTI
participated in the planning seminar that was held in the beginning of the project. In addition to the authors of the present report the following people have been involved in SleepEYE II: John-Fredrik Grönvall (project manager) and Jordanka Kovaceva from Volvo Cars, Martin Krantz, Per Sörner and Emanuel Hasselberg from Smart Eye, and David Hallvig from VTI.
Anne Bolling, VTI and Torbjörn Åkerstedt, Stockholm University have reviewed the report and provided valuable feedback.
The SleepEYE II project was financed by the competence centres ViP and SAFER (the Vehicle and Traffic Safety Centre at Chalmers).
Thanks to all of you who have contributed to the project.
Linköping, January 2013
Quality review
Peer review was performed on 19 October 2012 by Anne Bolling, VTI and on 19 December 2012 by Torbjörn Åkerstedt, Stockholm University. The first author Carina Fors has made alterations to the final manuscript of the report. The ViP Director Lena Nilsson examined and approved the report for publication on 18 April 2013.
Table of contents
Summary ... 5
1 Introduction ... 7
1.1 Driving simulator validity ... 7
1.2 Simulator validation using the SleepEYE I database ... 10
1.3 Aim... 10
1.4 Related publications ... 11
2 Method ... 12
2.1 The SleepEYE experiments ... 12
2.2 Database ... 14
2.3 Validation methodology... 16
2.4 Statistical analysis ... 22
3 Results ... 23
3.1 General driving and driver behaviour ... 23
3.2 Speed profile at change in posted speed limit ... 31
3.3 Subjective experience ... 34
4 Discussion ... 41
4.1 Recommendations for future studies ... 44
References ... 45
Appendix A
Questionnaire 1 – driving related questions and eye symptoms Questionnaire 2 – simulator validation
Appendix B
Simulator validation with respect to driver sleepiness and subjective experiences
by Carina Fors, Christer Ahlström and Anna Anund
VTI (Swedish National Road and Transport Research Institute)
Executive summary
In the previous project SleepEYE, which aimed at developing tools for driver sleepiness detection, two experiments were carried out. In the first experiment, 18 drivers
conducted two driving sessions on a motorway: one during daytime (alert) and one at night (sleep deprived). Sixteen of the drivers participated in the second experiment, which was similar to the first one, except that the driving sessions were conducted in an advanced moving base driving simulator. In the present study, the validity of the
simulator was assessed using data that was collected in the two experiments. The validation analysis had three focuses: 1) general driver and driving behaviour related to driver sleepiness, 2) speed profile at change in posted speed limit, and 3) drivers’ subjective experience of the vehicle, the driving environment and the own driving performance.
The results showed that there were significant differences in mean speed, blink duration, percentage road centre (gaze), radius of 95 per cent cone (gaze) and KSS between the simulator and the real road. No such differences were found for left and right line crossings. For all indicators except blink duration, there was no interaction effect between platform (simulator vs. real road) and time on task, which indicates that the signs of sleepiness vary in a similar way regardless of platform.
At the change in posted speed limit, speed was in general higher and it decreased more in the simulator than on the real road.
When the drivers were asked to judge the validity in terms of realism, staying alert, handling of boredom, etcetera, they found it more difficult in the simulator than on the real road, which indicates a relatively low absolute validity. The drivers also
experienced a higher degree of lack of control in the simulator compared to the real road. Eye sensitive measures like eye strain and difficulties focusing were seen as more prevalent in the simulator. The latter may be an effect of the situation rather than of sleepiness. The experience of heavy eye lids was not different between platforms. Not surprisingly, the drivers experienced their own cars as more alike the experimental car than the simulator.
In conclusion, differences between the simulator and the real road with respect to driving and driver behaviour as well as subjective experiences were found, mainly in terms of speed, level of sleepiness and subjective experience of the vehicle. However, the signs of sleepiness and the development of sleepiness over time are similar in the simulator and on the real road, although the level is higher in the simulator. Thus, there is a relative but not absolute validity with respect to driver sleepiness. Similarly, there seems to be a relative validity for speed and changes in speed.
1
Introduction
Driving simulators provide a well-controlled setting for studies on driver and driving behaviour. In a simulator, the same scenario can be presented to a great number of drivers and potentially dangerous situations can be studied in a safe way. Investigation and evaluation of road design, safety systems, vehicle dynamics and impaired driver behaviour can be done relatively fast and often to a lower cost than in real world. When using a driving simulator the validity, i.e. the transferability and generalizability of the results to real road driving, is a key issue. The functional and technical differences between a simulator and a real car are obvious, but to what extent, if any, will they influence the results about the driver behaviour given this context?
Simulator validity concerns vehicle behaviour as well as driver behaviour. The
simulator’s ability to imitate forces, graphics, vibrations, etc. is important but in order for the simulator to work as a research tool for investigation of driver behaviour, it is the simulator’s ability to create a scenario in which the driver acts in the same way he or she would do in the real world that is of interest. Thus, when speaking of simulator validity, it is usually behavioural validity that is referred to. Depending on the scenario and the aim of the study, validity can in some cases be achieved using a simple desktop simulator, while in other cases validity cannot be achieved even in advanced motion-based high-end simulators. In other words, a driving simulator can be valid for a certain kind of experiment, for certain scenarios and/or for certain driving variables, but have a poor validity in other situations.
Often two types of validity are discussed: absolute and relative validity. A simulator which exactly replicates a certain behaviour is said to have absolute validity. This is rarely achieved, but on the other hand, absolute validity is not necessary for many types of studies. Relative validity refers to the case where the behaviour is similar but not identical. For example, if drivers reduce their speed both in a simulator and on a real road – although not to the same extent – when they encounter a certain speed reducing measure, the simulator has a relative validity. Relative validity is usually needed in order to obtain meaningful results.
In the previous project SleepEYE, a database feasible for simulator validation was created. The primary aims of that project were to develop and evaluate a low-cost eye tracking unit for driver state monitoring, and to identify driver sleepiness indicators that could be used for implementation of a simple sleepiness classifier for simulator
applications (Fors, Ahlström et al. 2011). The project included two experiments: one field test on a motorway and one simulator test in the Driving Simulator III at VTI. The previous project will from now on be referred to as SleepEYE I, while the present project is denoted SleepEYE II.
The aim of the present study was to explore the SleepEYE I database in order to identify scenarios that are appropriate and relevant for simulator validation (i.e. for comparing driving behaviour and driving experience in the simulator with the real road counterpart), and to accomplish validation analyses.
1.1
Driving simulator validity
As mentioned above, simulator validity is a broad and nonspecific term. In a literature review it is concluded that it is extremely difficult to apply existing psychological definitions of validity to driving simulators and that new standards and procedures must
be developed for this specific application (Blana 1996). Today, 15 years later, there is still no standard methodology available, which in some sense is expected since
simulator validity can refer to so many different aspects of driving and driving behaviour, and it might therefore not be reasonable to define a standard. On the other hand, the lack of standardized and/or established methods and definitions leads to a situation where researches can claim their driving simulator to be valid based on arbitrary and/or unknown criteria (Blana 1996).
In literature, a distinction is often made between absolute and relative validity and between internal and external validity, see for example (Kaptein, Theeuwes et al. 1996). Absolute validity is established when the absolute size of a particular effect is equal in the simulator and in reality. When the direction or relative size of an effect is the same in the simulator and in reality, the simulator has a relative validity. Internal and external validity are not specifically related to simulator studies, but are relevant in most kind of research. A research method has internal validity if there are no alternative explanations for an obtained effect (Kaptein, Theeuwes et al. 1996). In simulator studies, internal validity may be poor if driver behaviour is affected by simulator limitations. From another point of view, internal validity is often better in simulators than in reality with regard to control of external factors (surrounding traffic, weather, etc.). External validity refers to the extent that the results obtained in a specific study can be generalized
(Kaptein, Theeuwes et al. 1996). In simulator studies, external validity refers to whether the results from the simulator can be generalized to real driving. Thus, absolute and relative validity as well as internal and external validity are of great importance when discussing simulator validity. In the present study, the analyses of absolute and relative validity will be in focus; however, these terms are strongly interconnected with internal and external validity which means that the latter will be indirectly assessed to some extent.
A central issue when planning a validation study is what to compare the simulator with. A frequently used method is to implement a real road in the simulator and to conduct a controlled within group experiment where the same drivers drive in the simulator and in an instrumented car on the real road (Törnros 1998; Klee, Bauer et al. 1999; Hakamies-Blomqvist, Oestlund et al. 2000; Senserrick, Brown et al. 2007; Shinar & Ronen 2007; Shechtman, Classen et al. 2009; Mayhew, Simpson et al. 2011). An alternative – which might be justified by practical reasons – is to use different drivers in the simulator experiment and in the real road experiment (Godley, Triggs et al. 2002; Östlund, Nilsson et al. 2006). These methods provide a good experimental setting with a
relatively high level of control. A disadvantage of using instrumented vehicles, real cars as well as simulator cars, is that they are part of an artificial environment, where drivers do not drive their own car and are aware that they are being monitored (Blana 1996). For the simulator part of the experiment this cannot be avoided, but instead of running a controlled real road experiment, real road data can be obtained from measurements of e.g. speed in real traffic situations (McAvoy, Schattler et al. 2007; Bella 2008; Yan, Abdel-Aty et al. 2008). Yet another alternative is to let drivers drive in the simulator only and do the validation evaluation from questionnaires (Cossalter, Lot et al. 2010). Simulator validation may include a wide range of driving parameters, situations and behaviours. A single experiment is often dedicated to investigate one or a few aspects of validity. Speed is probably the most investigated parameter and it has been used in basic experiments on the general sensation of speed (Klee, Bauer et al. 1999; Senserrick, Brown et al. 2007; Shinar & Ronen 2007; Bella 2008) as well as in more specific situations such as at road work sites (Bella 2005; McAvoy, Schattler et al. 2007), in
intersections (Yan, Abdel-Aty et al. 2008), in tunnels (Törnros 1998), at speed signs (Ahlström, Andersson et al. 2012) or in relation to speeding countermeasures (Godley, Triggs et al. 2002). Similarly, lateral position is a frequently investigated parameter (Alm 1996; Harms 1996; Törnros 1998; Hakamies-Blomqvist, Oestlund et al. 2000). Other parameters that have been used for simulator validation are e.g. braking behaviour, steering wheel movements (Hakamies-Blomqvist, Oestlund et al. 2000), driving errors (Shechtman, Classen et al. 2009; Mayhew, Simpson et al. 2011) and the subjective experience of noise and vibrations (Ahlström, Andersson et al. 2012). Simulators are frequently used for investigation of driving and/or driver behaviour in certain situations, and thus validation of the simulator with regard to these specific applications are needed. Such studies have been done for e.g. a telephone dialling task (Reed & Green 1996) and for secondary tasks on visual detection and auditory memory (Östlund, Nilsson et al. 2006).
Driver sleepiness is often studied in simulators because of the risks associated with having sleepy drivers driving on real roads. In simulator studies, it has for example been found that subjective sleepiness is higher after sleep loss and during night-time driving (Gillberg, Kecklund et al. 1996; Åkerstedt, Peters et al. 2005) and that driver sleepiness is associated with increased lateral variability (Anund, Kecklund et al. 2008; Lowden, Anund et al. 2009) and an increased number of line crossings (Reyner & Horne 1998; Ingre, Åkerstedt et al. 2006b). There are however only a few studies on simulator validation with regard to driver sleepiness. Philip and colleagues have compared alert as well as sleepy driving on a real motorway and in a rather simple table-top driving simulator (Philip, Sagaspe et al. 2005b). It was found that subjective sleepiness, reaction time and the number of line crossings were higher in the sleep deprived conditions than in the alert conditions, and that the effects were larger in the simulator.
In a similar study by the same research group, the effects of sleepiness, caused by extended wakefulness, and fatigue, caused by prolonged driving, were compared in simulated and real-life driving conditions (Davenne, Lericollais et al. 2012). Also in this study it was found that subjective sleepiness and the number of line crossings were higher in the sleep deprived condition than in the daytime reference session. However, at night, driving duration affected the number of line crossings in the simulator more severely than that of real driving. Furthermore, there were no differences in subjective sleepiness between the real road sessions and the simulator sessions.
Hallvig and colleagues have performed an absolute comparison of sleepy driving on a real road and in the advanced motion-based Driving Simulator III at VTI (Hallvig, Anund et al. 2013), i.e. the same simulator used in the present project. Ten participants conducted several driving sessions on a real rural road and in the simulator. One morning drive and one night drive were selected for analysis. The results showed that subjective as well as physiological sleepiness were higher in the simulator than on the real road, and that the variability in lateral position was higher in the simulator during night-time driving, while real driving involved a movement to the left in the lane and a reduction of speed, which were absent in the simulator. It was concluded that the relative validity of the simulator was acceptable for many variables but that the simulator caused higher absolute levels of sleepiness. However, the results cannot be generalized to other road types such as motorway. Furthermore, the study had rather few participants and the driving sessions were only 45 min. Therefore, the results need to be confirmed by other studies.
1.2
Simulator validation using the SleepEYE I database
The SleepEYE I database contains data from 18 participants in the field test. Sixteen of them also participated in the simulator test. Each experiment included two driving sessions: one during daytime (alert condition) and one at night (sleepy condition). The test route consisted of an approximately 160 km long motorway. Driving data such as speed and lateral position were continuously logged during the experiments. Also eye tracking data and physiological measures were registered, and the participants were asked to fill in some questionnaires about their driving performance. So far, the two experiments are similar. There are however differences that limit the relevance of certain analyses. The most important differences are:
Traffic density was higher on the real road than in the simulator, particularly during the daytime session.
In the real road experiment, it was daylight during the daytime session and dark during the night-time session, while it was daylight in both simulator sessions.
A test leader was sitting in the front passenger seat in the real road experiment. In the simulator experiment, the driver was alone in the car and the test leader was monitoring the experiment from the operator's desk.
In the real road experiment, the driving session was disrupted if the driver became too sleepy, while in the simulator, the session continued even if the driver fell asleep for a short while.
The real road car was a Volvo XC70, while the simulator car was a Saab 9-3. Another limitation that should be mentioned is that the order of the driving sessions was not counterbalanced between the participants. All participants conducted the sessions in the following order: 1) real road day, 2) real road night, 3) simulator day, 4) simulator night.
Since the SleepEYE I experiments were not primarily designed for simulator validation, the first task within the present project was to select relevant parameters, situations and/or behaviours feasible for validation. The selection was done in two steps. First, a planning seminar was held, which resulted in a list of items that could be of interest for validation. The seminar was followed by a meeting where the items were discussed and, based on their relevance and possibilities to give meaningful results, given a priority. Sleepiness and its consequences for driving behaviour were considered to be of main interest for validation. This includes driving parameters such as speed, lateral position and line crossings, but also gaze and blink behaviour, and subjective ratings. A few items not immediately related to sleepiness (i.e. items that are not known from the literature or prior experience to be related to sleepiness) were identified: speed pattern when the posted speed limit is changed and subjective impressions gathered by questionnaires.
1.3
Aim
The aim of the study was to validate the driving simulator, i.e. to compare driving behaviour and driving experience in the simulator with the real road counterpart, in order to evaluate whether the simulator gives similar results as real road driving. Based on the results from the planning seminar and the prioritization of driving aspects to validate three aims, describing performance indicators to compare, were formulated:
General driver and driving behaviour related to driver sleepiness.
Speed profile at change in posted speed limit.
Subjective experience of the vehicle, the driving environment and the own driving performance.
1.4
Related publications
SleepEYE I resulted in three publications:
Fors C, Ahlström C, Sörner P, Kovaceva J, Hasselberg E, Krantz M, Grönvall J-F, Kircher K, Anund A (2011). Camera based sleepiness detection – Final
report of the project Sleep EYE. ViP report 2011-6, The Swedish National Road
and Transport Research Institute, Linköping, Sweden.
Ahlstrom C, Kircher K (2010). Review of real-time visual driver distraction
detection algorithms. 7th International Conference on Measuring Behaviour,
Eindhoven, Netherlands, 2010.
Ahlstrom C, Kircher K, Sörner P (2011). A field test of eye tracking systems with
one and three cameras. 2nd International Conference on Driver Distraction and Inattention, Gothenburg, Sweden, 2011.
The first publication is the project report describing the experiments, the results of the camera evaluation with regard to blink parameters and the sleepiness detector for driving simulators. The two following publications were done outside the project, but are based on data from the project. In the first of these three publications, the 1-camera system is compared with the 3-camera system with respect to gaze parameters. The second publication is based on the literature review on distraction indicators that was done within the project.
In SleepEYE II, the work that has been done in work packages 2 and 3 is published in a separate report:
Fors C, Hallvig D, Hasselberg E, Kovaceva J, Sörner P, Krantz M, Grönvall J-F, Anund A (2012). Investigation of driver sleepiness in FOT data – Final report
of the project SleepEYE II, part 2. ViP report in manuscript, The Swedish
2
Method
2.1
The SleepEYE experiments
Below is a brief description of the two experiments that were conducted in the SleepEYE I project. A comprehensive description can be found in the report Camera
based sleepiness detection – Final report of the project SleepEYE (Fors, Ahlström et al.
2011).
2.1.1 Participants
Twenty participants were recruited to the study. Half of them were women. The participants were recruited from the Swedish register of vehicle owners. The main inclusion criteria were: between 30 and 60 years old, no glasses (in order to obtain eye tracking data of good quality), good self-reported health, normal weight, no shift workers or professional drivers.
Unfortunately, some subjects cancelled their participation at short notice and it was not possible to replace all of them by new participants. In total, sixteen subjects participated in both experiments (simulator and real road). Eight of the participants were women. One participant was younger than 30 years and one had glasses. The participants were paid 3000 SEK for their participation.
The study was ethically approved by the regional ethical committee in Linköping, registration number 2010/153-31. Permission to conduct driving sessions with sleep deprived drivers on public roads between midnight and 5:00 a.m. was given by the government, registration number N2007/5326/TR.
2.1.2 Design
The experimental design is shown in Table 1. The participants conducted four driving sessions: real road alert, real road sleep deprived, simulator alert and simulator sleep deprived. The order of the driving sessions was the same for all participants, for practical reasons. The alert conditions were carried out in the late afternoon, while the sleep deprived conditions took place after midnight on the same (or actually the next) day. Two participants took part in the experiment on each occasion, why there are two different starting times for the driving sessions, Table 1. The starting times of the driving sessions were kept the same in the two experiments, i.e. participants who started their first driving session at 3:30 p.m. in the field test also started at 3:30 p.m. in the simulator test.
In the real road experiment, it was always daylight during the alert session and always dark during the sleep deprived session. In the simulator it was daylight in both sessions since there was no darkness scenario implemented at the time of the experiment.
Table 1: Experimental design Driving
session Condition Participant A Participant B Light condition 1 Real road, alert 3:30-5:15 p.m. 5:45-7:30 p.m. Daylight 2 Real road, sleep deprived 0:15-2:00 a.m. 2:45-4:30 a.m. Dark 3 Simulator, alert 3:30-5:15 p.m. 5:45-7:30 p.m. Daylight 4 Simulator, sleep deprived 0:15-2:00 a.m. 2:45-4:30 a.m. Daylight
2.1.3 Procedure
The participants prepared for the experiment by sleeping at least seven hours the three nights prior to the test. On the experimental day they were instructed to get up no later than 7:00 a.m.
The participants arrived at VTI about 1.5 h before the alert session began. They were given written and oral information about the test and were asked to fill in an informed consent form and a responsibility form. The test leader then applied electrodes for the physiological measurements.
Each driving session lasted for about 90 min. The participants were instructed to drive as they would do in “real life”. While driving they were not allowed to speak, listen to the radio or do anything else that would counteract their sleepiness. The time between the sessions was spent at VTI, where the participants could e.g. read or watch TV. The participants were not allowed to drink any caffeine containing beverages from 1 p.m. on the experimental day.
2.1.4 Data acquisition
Vehicle data, such as speed and lateral position, was logged with 10 Hz from the car as well as from the simulator. In the field experiment, video films of the vehicle frontal and rear views, the driver's face and feet were recorded.
Physiological data – EEG, EOG and ECG – was recorded by a Vitaport 3 (TEMEC Instrument B.V., The Netherlands) with 256 Hz (EEG and ECG) or 512 Hz (EOG). Eye tracking data was obtained from two eye tracking systems: one 1-camera embedded system and one 3-camera Smart Eye Pro 5.7 (Smart Eye AB, Sweden). In addition, subjective sleepiness ratings were collected during the driving sessions by letting the participants rate their sleepiness level on the 9-grade Karolinska Sleepiness Scale (KSS) every five minutes (Åkerstedt & Gillberg 1990).
2.1.5 Field experiment
The test route in the field test was the E4 motorway from Linköping (exit 111) to Gammelsta (exit 128) and back. The length of test route was approximately 2 x 79 km and it took about 90 min to drive. The posted speed limit was 110 km/h during the whole route, except for a road section of 750 m in Norrköping, where the posted speed limit was 90 km/h.
The car used in the experiment was a Volvo XC70 with an automatic gearbox. A test leader was sitting in the front passenger seat. The car had dual command and there was
a small screen in front of the test leader showing the driver’s face, so that the test leader could see if the participant closed his/her eyes. The test leader was responsible for the safety and was prepared to take control of the vehicle if the driver became too sleepy. However, the intention was not to let the driver fall asleep, but to stop the driving session before the driver fell asleep. The test leader was also supposed to stop the driving session if the driver drove in an unsafe way, either because of sleepiness or of other reasons (e.g. exceeded the posted speed limit). The participants were explicitly told to not exceed speed limits for safety reasons. They were also told that they were allowed to stop for a break if they felt it was necessary for their safety. If the driver chose to take a break, it was prescribed that the test leader would stop the driver from continuing to drive.
2.1.6 Simulator experiment
The simulator used in this study was Driving Simulator III at VTI. The simulator is a moving base simulator with a 120 degrees forward field of view (VTI 2011). The cabin is a Saab 9-3. In this experiment, the simulator had an automatic gearbox.
In the simulator, the test route used was a motorway similar to that between Linköping and Norrköping. Each driving session consisted of four laps on the same motorway section. The total length of the simulator test route was about 150 km and it took about 75-80 min to drive.
In the simulator scenario there were a few events in the beginning and in the end of the session. In the beginning there were three overtaking events where the test driver was supposed to overtake slow vehicles. There were two similar events in the end of the driving session. The main part of the driving session was intended to be used for analysis of sleepiness indicators and thus, interaction with other traffic was kept to a minimum. On average, every 7 minutes during the whole driving session a car overtook the test driver. Half-way of the test route the posted speed limit was changed to 90 km/h for 1 km since there was a similar change of speed in the field test (there were actually two such changes in the field test but only one in the simulator scenario in order to minimize influence from alertness-enhancing factors).
A test leader sat outside the simulator and monitored the driver via video and
loudspeakers/microphone. The test leader did not stop the driving session even if the driver fell asleep. The participants were informed that they could stop driving at any time if they, for example, felt sick.
2.2
Database
A database was created in the SleepEYE I project in order to provide an easily
accessible dataset for analysis. Driving data and physiological data were synchronized and merged into Matlab struct files. Some additional parameters were inserted in the dataset: KSS, flags indicating start, stop, lowering of speed limit and turning (field test), and blink duration calculated from the EOG by the LAAS algorithm (Jammes,
Sharabaty et al. 2008).
Smart Eye data were extracted using post processing of recorded video, and gaze directions, nose directions and confidence signals were computed. Smart Eye data from all simulator sessions and from the night sessions in the field were processed in bright pupil mode, while the field data from the daylight sessions were processed in dark pupil mode. Smart Eye data was stored in separate Matlab files, because of their large size. A
common time stamp signal allowed for synchronization with the struct files containing driving and physiological data.
In total, the database contains approximately 30 parameters from the experimental vehicle, 20 parameters from the simulator, 50 parameters from the two camera systems and 10 physiological parameters. The parameters relevant for the present project are listed in Table 2.
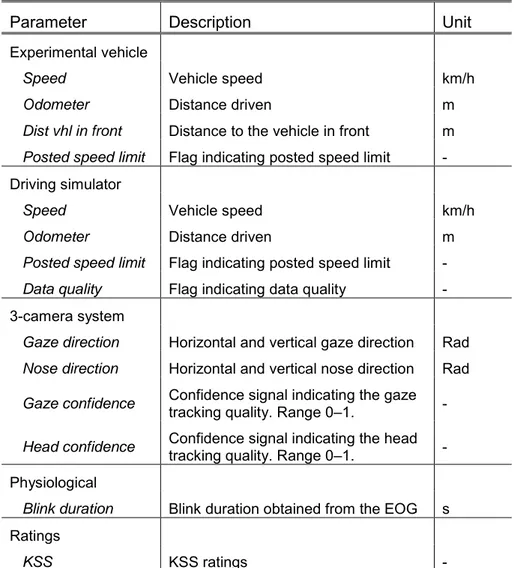
Table 2: The database parameters relevant for the present project
Parameter Description Unit
Experimental vehicle
Speed Vehicle speed km/h Odometer Distance driven m Dist vhl in front Distance to the vehicle in front m Posted speed limit Flag indicating posted speed limit -
Driving simulator
Speed Vehicle speed km/h Odometer Distance driven m Posted speed limit Flag indicating posted speed limit - Data quality Flag indicating data quality -
3-camera system
Gaze direction Horizontal and vertical gaze direction Rad Nose direction Horizontal and vertical nose direction Rad Gaze confidence Confidence signal indicating the gaze tracking quality. Range 0–1. - Head confidence Confidence signal indicating the head
tracking quality. Range 0–1. - Physiological
Blink duration Blink duration obtained from the EOG s Ratings
KSS KSS ratings -
In the experimental vehicle, the parameter Speed corresponds to speed calculated from sensors on the wheels, i.e. the standard speed available on the CAN bus which is also the speed shown by the speedometer. Speed sensors on the wheels usually do not give the exact actual speed since the wheel dimensions, which may vary, influence the calculated speed. The speed shown by the speedometer is usually somewhat higher than the actual speed in order to account for different wheel dimensions and to provide some safety margin. The exact relationship between actual speed, logged speed and shown speed for the experimental vehicle is not known. In another validation study, where a Volvo V70 (model year 2009) was used, the relationship between actual speed and shown speed was: speedspeedometer = 2.42 + 1.02*speedactual (Ahlström, Andersson et al.
in the present study, i.e. that the speed shown by the speedometer is a few km/h higher than the actual speed. In the simulator, the parameter Speed corresponds to the actual speed of the vehicle. The speed shown on the speedometer is 1.3 km/h higher
(Ahlström, Andersson et al. 2012).
2.3
Validation methodology
The validation included three separate analyses, where performance indicators from the driving simulator were compared to the real road counterparts:
General driving and driver behaviour in relation to sleepiness
Speed profile at change in posted speed limit
Subjective experience from questionnaires 2.3.1 General driving and driver behaviour
General driving and driver behaviour includes the following performance indicators:
Mean speed: Mean speed without taking influence from surrounding traffic into account. [km/h]
Line crossings: Number of line crossings per kilometre. A line crossing is defined to occur when the distance between the front wheel and the lane marking becomes <0. If two or more line crossings occur within 7 s, they are merged into one. Left and right line crossings are treated separately. [km-1]
Blink duration: Mean half amplitude blink duration obtained from the LAAS algorithm. [s]
Self-reported sleepiness: Self-reported ratings on the Karolinska Sleepiness Scale (KSS). [-]
Percentage road centre, gaze: The percentage of gaze data that lies within a circle with 8° radius (Victor et al. (2005). The data are centred around the median value in the horizontal and vertical gaze direction (separately). In the sketch below percentage road centre is the number of gaze data points (dots) inside the circle divided by the total number of dots. [%]
Radius of 95% cone, gaze: The radius of an ellipse covering 95 % of the gaze data. The radius r defines the horizontal radius of the ellipse whereas the vertical radius is defined as r/2. In the sketch below, the energy radius equals the r-value that defines an ellipse that covers 95 % of the dots. [°]
The gaze tracking data were filtered with a 350 millisecond wide interpolating median filter. Interpolation was achieved by simply ignoring data with confidence below 0.2 in the median calculation in each translation of the sliding window. The output of the filter was stored at the location of the centre of the sliding window to avoid unnecessary time lags. Figure 1 illustrates the 2D distribution of smoothed gaze direction data including highlighted gaze targets.
Figure 1: Example of 2D histogram of gaze direction data including the most common gaze targets.
The performance indicators were calculated for six road segments, each four kilometres long and separated by fourteen kilometres, Table 3. The segments were selected so that they would not include the turnaround, the last 10 min of the route1, the overtaking events (simulator experiment) or the stretch of road with a posted speed limit of 90 km/h. Furthermore, the selection was done so that there would be a minimum of exits and entrances. Figure 2 shows the approximate locations of the six road segments on the field test route.
The road segments from the field experiment are not identical to those from the simulator experiment, i.e. the shape (curvature, inclination, etc.) of the roads differ. Only the first 40 km of the field test route are implemented in the simulator and since
1 In the last 10 min of the route, the drivers were asked to do one distraction task and two driving tasks.
the start positions differ between the field and the simulator with a few km, it was not possible to select identical road segments even for these 40 km.
Table 3: Start and end of the six road segments selected for analysis, in kilometres from the start of the test route
Segment Start (km) End (km)
1 14 18 2 32 36 3 50 54 4 68 72 5 86 90 6 104 108
The performance indicators of general driving and driver behaviour were calculated for all four conditions, i.e. field-alert, field-sleepy, simulator-alert and simulator-sleepy. In the simulator experiment, there was no surrounding traffic except for a few
overtaking vehicles and occasional vehicles in the oncoming lane. This means that the driver’s choice of speed and lateral position was not influenced by other vehicles. In
Figure 2: The field test route with the approximate locations of the six road segments selected for analysis.
Linköping Norrköping 1 2 3 4 5 6 Turnaround Start and end Distraction task 90 km/h
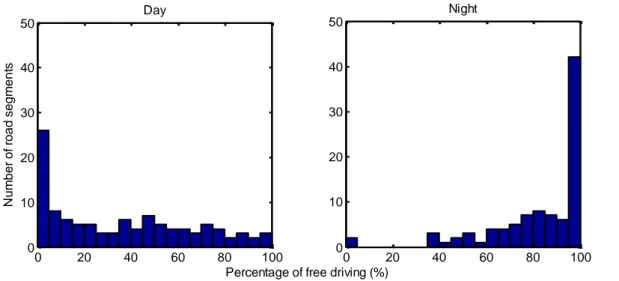
other words, the six road segments in the simulator experiment reflect free driving, while the corresponding road segments in the real road experiment contain free driving as well as driving influenced by other vehicles. In order for the two experiments to be comparable, the selection of field data should preferably be restricted to include only free driving segments. Figure 3 shows the distribution of percentage of free driving in the six road segments in the field experiment. Free driving is defined as driving in the right lane with at least 150 m (approximately 5 s) to the vehicle in front. From the figure it is obvious that the amount of free driving data is very small in the daytime sessions, and that an analysis of this subset of data would be meaningless.
Figure 3: Distribution of percentage of free driving per road segment in the field experiment. Left: daytime sessions, n=96. Right: night-time sessions, n=83.
In a new attempt to get – in some sense – comparable data sets, only driving in the right lane was included without taking into account whether there were any vehicles ahead. Figure 4 shows the distribution of percentage of right lane driving. With this approach, more data can be included in the analysis, but there is still a great amount of data that needs to be excluded. 0 20 40 60 80 100 0 10 20 30 40 50
Percentage of free driving (%)
N u m b e r o f ro a d se g m e n ts Day 0 20 40 60 80 100 0 10 20 30 40 50 Night
Figure 4: Distribution of percentage of free driving per road segment in the field experiment. Left: daytime sessions, n=96. Right: night-time sessions, n=83.
It was concluded that it was not possible to obtain comparable data sets, neither with respect to lane nor surrounding traffic. Therefore, lateral measures (lateral position and lateral variability) were completely excluded from the analysis. Speed was included, but it should be noted that this measure is the mean speed over the entire segment, without taking lane changes and other vehicles into account. Line crossings were included, since this measure is assumed to reflect poor control of the vehicle regardless of the presence of other vehicles and regardless of what lane the vehicle is in (although it cannot be assumed that the line crossing behaviour is equal in the two lanes). Blink duration, eye tracking data and subjective sleepiness were also included, without taking any
surrounding factors into account. It is however not unlikely that these measures are influenced by e.g. light conditions or visual complexity but since it is not known exactly how these factors influence the driver they will rather be a part of the two settings – the simulator and the real road – that are compared.
2.3.2 Speed profile at change in posted speed limit
The posted speed limit was 110 km/h along the test route, except for a few short stretches of the road where the posted speed limit was lowered to 90 km/h. In the field experiment, there were two such road stretches: one after 47 km and one after 112 km. Both were about 700 m long. In the simulator experiment, there was one such road stretch, 1 km long, after about 74 km.
Speed profiles were calculated for the first of the two road stretches in the field
experiment as well as for the single road stretch in the simulator experiment. The speed profiles started 600 m before the 90 sign and ended 600 m after the 110 sign.
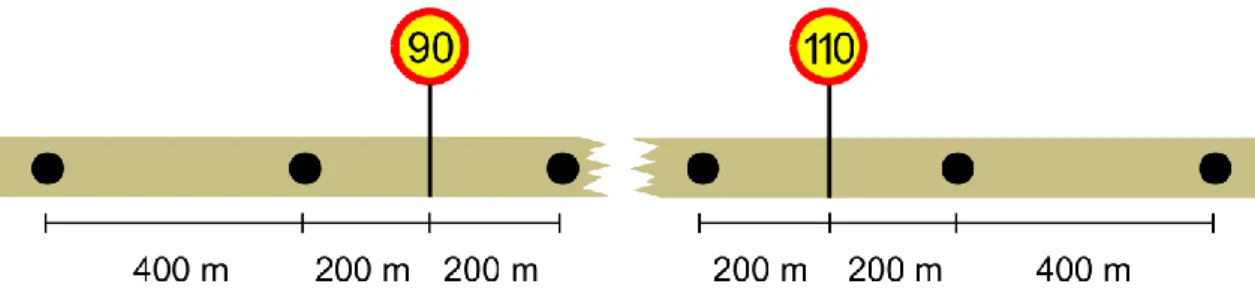
The speed at six points along the speed profile road stretch, according to Figure 5, was statistically analysed. 0 20 40 60 80 100 0 10 20 30 40 50
Percentage of right lane driving (%)
N u m b e r o f ro a d se g m e n ts Day 0 20 40 60 80 100 0 10 20 30 40 50 Night
Figure 5: Speed was analysed at six points (black circles) along the road stretch where the posted speed limit changed.
2.3.3 Subjective experience
Two questionnaires were used in order to investigate the participants’ subjective experience of the driving sessions. The first questionnaire included nine questions related to the driving and ten questions about eye symptoms, Table 4.
Table 4: Summary of the first questionnaire, which included general questions about the driving and questions about eye symptoms
Question Scale
Driving related
Steering performance? 1 – 7, 1 = very poor, 7 = very good Adaptation to the traffic situation? 1 – 7, 1 = very poor, 7 = very good
How much effort to stay awake? 1 – 7, 1 = no effort at all, 7 = very much effort How realistic compared to real driving? 1 – 7, 1 = not realistic at all, 7 = very realistic Did you feel bored? 1 – 7, 1 = not bored at all, 7 = very bored Did you feel anxious? 1 – 7, 1 = not anxious at all, 7 = very anxious
Did you lose control? Yes/no/don’t know
Did you fall asleep? Yes/no/don’t know
Did you do anything to stay awake? If yes,
what? Yes/no/don’t know + free text
Eye symptoms
Sore eyes 1 – 5, 1 = not at all, 5 = extremely much
Eye itching 1 – 5, 1 = not at all, 5 = extremely much
Gravel eyes 1 – 5, 1 = not at all, 5 = extremely much
Eye pain 1 – 5, 1 = not at all, 5 = extremely much
Eye strain 1 – 5, 1 = not at all, 5 = extremely much
Difficult to focus 1 – 5, 1 = not at all, 5 = extremely much
Tearful 1 – 5, 1 = not at all, 5 = extremely much
Heavy eyelids 1 – 5, 1 = not at all, 5 = extremely much
Difficult to keep the eyes open 1 – 5, 1 = not at all, 5 = extremely much
The second questionnaire was developed with simulator validation in mind. It consisted of a few background questions about driving experience, followed by six questions where the participant was asked to compare the experimental car (the real car or the simulator) with his/her own car, and three questions about task performance and traffic environment. The ratings were done on a visual analogue scale (VAS) with fixed endpoints. The nine questions are summarized in Table 5.
The entire questionnaires can be found in Appendix A (in Swedish).
Table 5: Summary of the simulator validation questionnaire Questions
If you compare your own car with the experimental car, were they in general similar or different to drive?
If you compare your own car with the experimental car, were they similar or different to steer?
If you compare your own car with the experimental car, were they similar or different to brake?
Was it easy or difficult to keep your desired position on the road, compared with your own car?
Was it easy or difficult to keep your desired speed, compared with your own car?
How good or poor was your performance on the “drive close to the lane marking” task?*
How good or poor was your performance on the “drive at a constant speed” task?*
Do you think that the driving environment was complex or not complex? Was your level of attention higher or lower than in your own car in similar situations?
*) Not included in the analysis
2.4
Statistical analysis
Driving and driver behaviour was statistically analysed using an ANOVA mixed model with participant as a random effect and study (field/simulator), session (day/night) and time on task (road segment 1–6) as fixed effects. All two and three way interactions were included in the analysis. A significance level of α < 0.05 was used.
A similar approach was used for the analysis of the questionnaires. An ANOVA mixed model was used to test differences in experience when driving the simulator car and the experimental car. The model included factors for session (day/night) and study
(field/simulator). In addition a factor for gender (male/female) was included and participant was used as a random.
3
Results
All analyses of driving and driver behaviour (Sections 3.1 and 3.2) are based on data from the sixteen drivers that participated in both the real road test and the simulator test. The age of these participants was 41±9 years (range 20–55 years) and their average mileage was 17 000 km (range 2 000–37 500 km). Eight participants were males and eight were females. Two participants usually drove a car with an automatic gearbox, while all the other participants usually drove a car with a manual gearbox.
The analyses on subjective experience include all drivers that participated in the experiment, i.e. in addition to the sixteen drivers that participated in both tests the two drivers that only participated in the real road test are also included.
3.1
General driving and driver behaviour
In the field test, six drivers stopped driving at the turning point in the night session because of severe sleepiness. Another two stopped after the turning point, but before the end of the route. In the simulator test no one stopped because of sleepiness (the
participants were allowed to continue even if they were close to falling asleep), but six data points are missing because of simulator failure. Table 6 summarizes the number of data points per segment.
In eleven of the simulator sessions (four during daytime, seven at night), there are annotations that the driver has fallen asleep, has had episodes of micro-sleep, has been nodding off or has been hitting the rumble strips. The test leaders were not explicitly told to make annotations about occurrences of sleep, so these figures are a bit uncertain, but they indicate that several drivers got very sleepy in the simulator.
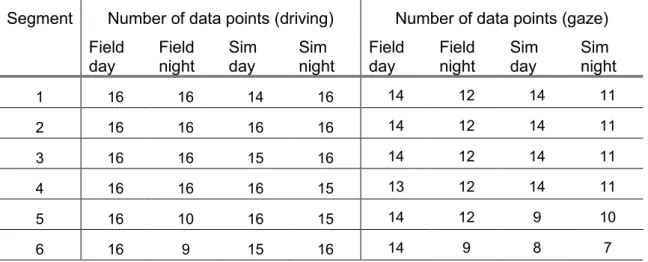
Table 6: Number of data points per segment
Segment Number of data points (driving) Number of data points (gaze) Field
day Field night Sim day Sim night Field day Field night Sim day Sim night
1 16 16 14 16 14 12 14 11 2 16 16 16 16 14 12 14 11 3 16 16 15 16 14 12 14 11 4 16 16 16 15 13 12 14 11 5 16 10 16 15 14 12 9 10 6 16 9 15 16 14 9 8 7
The results of the statistical analysis are summarized in Table 7. The individual variables are presented in graphs in separate paragraphs below and the complete statistical analysis can be found in Appendix B.
Table 7: Results of the ANOVA mixed model analysis of the effects of study (real road vs. simulator), session (day vs. night), segment (road section 1–6) and all interactions, on the driving behaviour variables. Bold p-values are significant at the 0.05 level.
p-values Dependent variables Stud y Sessi on Seg m en t Stud y* Sessi on Study* Seg m en t Sessi on * Seg m en t Stud y* Sessi on * Seg m en t Mean speed 0.000 0.016 0.085 0.000 0.144 0.116 0.452 Line crossings, left 0.090 0.000 0.046 0.396 0.110 0.447 0.440 Line crossings, right 0.633 0.153 0.036 0.340 0.872 0.740 0.099 Blink duration 0.000 0.043 0.251 0.001 0.000 0.060 0.011 KSS 0.000 0.000 0.000 0.001 0.617 0.992 0.950 Percentage road centre (gaze) 0.000 0.000 0.737 0.000 0.295 0.562 0.917 Radius of 95% cone (gaze) 0.000 0.000 0.542 0.000 0.655 0.084 0.271
In addition to the results presented in Table 7, there were significant differences
between drivers (i.e. the random effect variable "participants", see Section 2.4) for mean speed, blink duration, KSS, PRC (gaze) and radius of 95% (gaze).
3.1.1 Mean speed
Figure 6 shows mean speed per segment and condition. Mean speed was significantly lower in the field test than in the simulator test (main effect of study) and the difference was more pronounced at night (interaction effect of study and session). There was also a significant effect of session (day/night). There was no significant effect of time on task (segment).
It should be noted that the simulator speed corresponds to the actual speed and that the speed from the field test corresponds to the standard CAN speed (see also Section 2.2). Thus, the difference in speed between the simulator and the experimental vehicle, both with respect to the speed shown by the speedometer and with respect to actual speed, is probably somewhat higher than that shown in Figure 6.
Figure 6: Mean speed (mean ± SE) in the six segments for the field test (grey) and the simulator test (black). Left: day, right: night.
3.1.2 Line crossings
There was a significant effect of session (day/night) and time on task (segment) on line crossings to the left, Figure 7. There was no significant effect of study (field/simulator) and no significant interactions. The results indicate that there are an increased number of line crossings to the left during night-time and an increased number of line crossings in relation to time driven.
Figure 7: Left line crossings per km (mean ± SE) in the six segments for the field test (grey) and the simulator test (black). Left: day, right: night.
There was a significant effect of time on task (segment) on lane crossings to the right, Figure 8, although there is no clear tendency that the right line crossings increase with
time, as with left line crossings. There was no significant effect of study (field/simulator) or session (day/night), and there were no interactions.
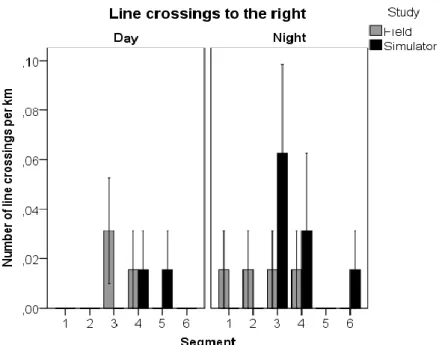
Figure 8: Right line crossings (mean ± SE) in the six segments for the field test (grey) and the simulator test (black). Left: day, right: night.
There were a higher number of line crossings to the left than to the right (not analysed statistically). On average, there were 0.05 line crossings per km to the left and 0.01 line crossings per km to the right.
3.1.3 Blink duration
Mean blink duration is shown in Figure 9. Blink duration was significantly shorter in the field test than in the simulator test (main effect of study). Blink duration was also significantly shorter in the daytime session than in the night-time session (main effect of session). There were also interactions between study and segment, and between study and session. There was also a three-way interaction between study, segment and
session. The result indicates that the difference in blink duration between simulator and field is different during daytime and during night-time, but also that the differences were especially increased at the end of the drive during night, when drivers in the simulator had longer blink duration compared to in the field test. It should be noted that in the field test, six drivers terminated the driving before segment 5.
Figure 9: Blink duration (mean ± SE) in the six segments for the field test (grey) and the simulator test (black). Left: day, right: night.
3.1.4 Self-reported sleepiness
There were significant effects of study (field/simulator), session (day/night) and time on task (segment) on KSS, Figure 10. There was also an interaction between study and session. The result indicates that the difference in KSS between simulator and field is greater during daytime than during night time.
Figure 10: Self-reported sleepiness on the KSS scale (mean ± SE) in the six segments for the field test (grey) and the simulator test (black). Left: day, right: night.
3.1.5 Eye movement behaviour
2D histograms of gaze directions are shown in Figure 11. There is no apparent
difference between data from the field test and from the simulator test. However, since the drivers are looking at the forward roadway most of the time, the main mode
obscures details from other regions in the histograms. Figure 12 is identical to Figure 11 except that the main mode has been removed from the plots. There is a tendency that the drivers are looking more in the rear view mirrors in the field trial during daytime
compared to the other conditions, which is probably a direct consequence of the higher traffic density.
Figure 11: Logarithmic 2D histograms of gaze direction data averaged across all participants and across the six segments.
Figure 12: Logarithmic 2D histograms according to Figure 11, but where data representing looking straight ahead are ignored.
There was a significant effect of study (field/simulator) and session (day/night) on percentage road centre (gaze), Figure 13, as well as on the radius of 95% cone, Figure 14. There was also an interaction between study and session for both these performance indicators. The interaction indicates that the difference in gaze concentration between simulator and field is greater during night-time than during daytime – especially, it is the night-time measurements in the field that shows higher values for percentage road centre and smaller radii of the 95% cone.
Figure 13: Percentage road centre based on gaze behaviour (mean ± SE) in the six segments for the field test (grey) and the simulator test (black). Left: day, right: night.
Figure 14: Radius of an ellipse covering 95 % of the gaze and head direction data (mean ± SE) in the six segments for the field test (grey) and the simulator test (black). Left: day, right: night.
3.2
Speed profile at change in posted speed limit
Figure 15 and Figure 16 show the speed profiles for the field test and the simulator test, respectively. Unfortunately, the profiles are not fully comparable, since the road stretch with lowered speed limit was about 700 m in the field test and 1000 m in the simulator test. The speed profile is completely missing for one night-time field session.
Figure 15: Speed profile at the road section where the posted speed limit was lowered in the field test. At the distance 600 m the speed limit was lowered from 110 km/h to 90 km/h, and at the distance 1300 m the speed limit was increased to 110 km/h. Mean (thick lines) ± standard deviation (shaded areas). Red = day, blue = night.
Figure 16: Speed profile at the road section where the posted speed limit was lowered in the simulator test. At the distance 600 m the speed limit was lowered from 110 km/h
to 90 km/h, and at the distance 1600 m the speed limit was increased to 110 km/h. Mean (thick lines) ± standard deviation (shaded areas). Red = day, blue = night.
The statistical analysis of the speed profiles included six points along the road stretch. Two separate analyses were conducted: speed at the 90 sign (first three points) and speed at the 110 sign (last three points). The results are summarized in Table 8.
Table 8: Results of the ANOVA mixed model analysis of the effects of study (real road vs. simulator), session (day vs. night), segment (road section 1–6) and all interactions, on speed at the road section where the posted speed limit was changed. Bold p-values are significant at the 0.05 level.
p-values Dependent variables Stud y Sessi on Seg m en t Stud y* Sessi on Study* Seg m en t Sessi on * Seg m en t Stud y* Sessi on * Seg m en t Speed, 90 sign 0.000 0.001 0.000 0.071 0.000 0.648 0.718 Speed, 110 sign 0.000 0.081 0.000 0.001 0.232 0.886 0.983
For the 90 sign, there were significant effects of study (field/simulator), session
(day/night) and segment (600 m before / 200 m before / 200 m after). There was also an interaction between study and segment. No other interactions were significant.
Figure 17: Speed (mean ± SE) at two points before and one point after the 90 sign, for the field test (grey) and the simulator test (black). Left: day, right: night.
For the 110 sign, there were significant effects of study (field/simulator) and segment (200 m before / 200 m after / 600 m after). There was also an interaction between study and session. No other interactions were significant.
Figure 18: Speed (mean ± SE) at one point before and two points after the 110 sign, for the field test (grey) and the simulator test (black). Left: day, right: night.
3.3
Subjective experience
The two questionnaires were filled in after each driving session. Results are therefore presented for both studies (real road and simulator), and for both sessions (day and night). Furthermore, in some analyses males and females are separated.
3.3.1 Questionnaire 1 – driving related questions and eye symptoms
The analysis of questionnaire 1 is based on answers from 67 driving sessions: 17 from field day (one questionnaire is missing), 18 from field night, 16 from simulator day and 16 from simulator night.
Figure 19 shows self-rated driving performance. The drivers rated their steering performance as poor during night-time both in simulator and on real road, but worst in simulator (F=20.8; p<0.01). There were also a significant effect of session (day/night) (F=90.6; p<0.01) and an interaction between study (field/simulator) and session (day/night) (F=4.9; p<0.05).
Similar results were found for “adjust to the traffic situation”, with significant effects of study (field/simulator) (F=25.4; p<0.01) and session (day/night) (F=84.0; p<0.01), and an interaction between study and session (F=29.7; p<0.01), i.e. the adjusting
performance was worse at night than during daytime, with most pronounced effects in the simulator.
Figure 19: Self-rated driving performance (mean ± SE) in the four conditions. Black: steering performance, grey: ability to adjust to the traffic situation. Left: day, right: night.
Subjective experiences with respect to effort to stay alert, realism compared to a real situation, boredom and anxiety are shown in Figure 20. The drivers found it
significantly more effortful to keep alert during night-time driving compare to daytime driving (F=38.1; p<0.01). They also found it significantly more effortful to stay alert in the simulator compare to driving on real road (F=18.7; p<0.01). The females
experienced even higher effort than men (F=8.8; p<0.01).
The drivers found it more realistic to drive on real road compare to simulator (F=19.6; p<0.01). There was no difference between day and night-time driving, or between males and females. The drivers experienced more boredom in the simulator compared to during real driving (F=18.5; p<0.01). There was no difference between day and night-time driving, or between males and females. The level of anxiety was low on the real road as well as in the simulator, and there was no difference between the platforms. There was no difference between day and night-time driving, or between males and females.
Figure 20: Subjective experiences (mean ± SE) of the four conditions. Black: effort to stay alert, dark grey: realism, bright grey: boredom, beige: anxiety. Left: day, right: night.
In total the drivers reported losing control in 14 out of the 67 driving sessions (not shown in any figure). Three of the 14 reports referred to driving on the real road during night while the remaining eleven reports referred to simulator sessions (four during daytime and seven at night). In 18 cases no answer on losing control was given. In 16 out of the 67 drives the drivers reported that they had fallen asleep. One report revealed that it had happened during daytime on the real road, and four that it had happened during night-time on the real road. In the simulator there were three reports of falling asleep during daytime and eight during night-time. In two drives the drivers did not know if they had fallen asleep.
Finally the drivers were asked if they did anything to keep awake during the driving. In 32 cases, in total, the drivers reported that they did.
Questionnaire 1 also included some questions about eye symptoms, Figure 21. The most sensitive eye related experiences during the driving sessions seem to be eye strain, difficulties to focus, heavy eyelids and difficulties to keep the eyes open. Eye strain was experienced more frequently during night-time (F=32.9; p<0.01) and more in the
simulator than during driving on real road (F=4.3; p<0.05). Difficulties to focus were also more common during night-time (F=14.8; p<0.01) and more in the simulator (F=7.8; p<0.01). Heavy eyelids were more often reported during night-time (F=14.1; p<0.01), but there was no difference between the simulator and the real road (F=1.6; p=0.21). Finally, difficulties to keep the eyes open were more often reported during the night drive (F=10.8; p<0.01) and when driving in the simulator (F=7.1; p<0.01). There were no significant interactions.
Figure 21: Eye symptoms (mean ± SE) in the four conditions. Left: day, right: night. For explanations of bar colours, see the legend in the figure.
3.3.2 Questionnaire 2 – simulator validation
The drivers were asked to compare their experience of the simulator car as well of the experimental car with their own car, Figure 22. Judgements were done from a general point of view, and in relation to steering and braking. In general there was a significant difference between how similar/different the drivers experienced the simulator/experi-mental car compared to the own car (F=6.00; p<0.05), with the largest difference between the own car and the simulator. The experience of steering differed between the simulator/experimental car and the own car (F=31.7; p<0.01), again the difference was most pronounced for simulator. Braking in the simulator was the task that was seen as most different compared to driving the own car (F=57.9; p<0.01). There was no significant effect of time of the day (session) or gender, and there were no significant interactions.
Figure 22: Feeling of similarity or difference (mean ± SE) compared to driving the own car. Left: day, right: night. For explanations of bar colours, see the legend in the figure.
The drivers experienced it more difficult to keep to the desired position in the simulator than in the experimental car (F=12.6; p<0.01), Figure 23. There was no difference between day and night-time driving. However, there was an interaction between study (field/simulator) and gender, Figure 24.
The drivers experienced it more difficult to keep to the desired speed in the simulator than in the experimental car (F=48.8; p<0.01), Figure 23. In addition, it was seen as more difficult during daytime than during night-time (F=4.7; p<0.05), with the largest difficulties in the simulator during daytime driving.
Figure 23: Experienced ease/difficulty to keep to desired position and speed (mean ± SE) compared to when driving the own car. Left: day, right: night. For explanations of bar colours, see the legend in the figure.
Figure 24: Experienced ease/difficulty to keep to desired position and speed (mean ± SE) compared to when driving the own car, divided between male and females. Left: day, right: night. For explanations of bar colours, see the legend in the figure. The y-axis ranges from much easier (1) to much more difficult (5).
There were no significant effects on the experience of complexity during driving in the simulator and on the real road, Figure 25. Overall the driving was seen as neither
extremely complex nor not complex at all, regardless of time of the day (session) and study (field/simulator).
The experienced level of attention was rated as higher when driving the experimental car on the real road compared to the own car (F=25.9; p<0.01). There was a significant effect on attention of time of day (F=7.4; p<0.01). The lowest level of attention
compared to the own car was rated for night-time driving in the simulator. In addition there was an interaction between study (field/simulator) and gender (F=7.6; p<0.01).
Figure 25: Experienced complexity and attention (mean ± SE) compared to driving the own car. For explanations of bar colours, see the legend in the figure.
4
Discussion
In this project, driving in Simulator III at VTI has been compared to driving on a real motorway. The comparison included registered driving and driver parameters as well as self-reported parameters from questionnaires and rating scales.
The analysis of general driver and driving behaviour with regard to driver sleepiness showed significant effects of study (simulator vs. real road) on KSS, blink duration and mean speed, which implies that the simulator does not have absolute validity for these parameters. The two sleepiness indicators – KSS and blink duration – were higher in the simulator than on the real road, i.e. the drivers got sleepier in the simulator. This is in agreement with the previous study by Hallvig et al., where both self-reported sleepiness and physiological measures showed a higher level of sleepiness in a simulator than on a real (rural) road (Hallvig, Anund et al. 2013). In the present study, there was also an interaction effect between study and session for KSS and blink duration, which means that the differences between the simulator and the real road are not the same during the day as compared to during the night. This effect is not in agreement with the previous study by Hallvig et al. (2013). A possible explanation is that in the present study the sleepiest drivers in the real road experiment stopped driving prematurely.
Mean speed was higher in the simulator than on the real road, and the effect was more pronounced at night (interaction between study and session). Also this result is in agreement with the previous study by Hallvig et al. (2013), but it is not quite consistent with the results from another validation study of Driving Simulator III at VTI, where no difference in actual speed between the simulator and the real road was found (Ahlström, Andersson et al. 2012). However, in the latter study there was a significant difference in speed shown by the speedometer. In the Hallvig et al. study, it is not known which speed the result refers to. Thus, it is possible that the different results are related to different ways of measuring speed. Another difference between the studies is that in Ahlström et al's study the noise and vibrations in the simulator had been improved, which might have improved the perception of speed.
There are several possible explanations to the differences in speed in the present study. First, in the field test the drivers were told not to exceed the posted speed limit for safety reasons and, clearly, this request was paid attention to. Second, traffic density was higher on the real road which usually results in lower speed (Wang, Li et al. 2011). Third, at night, when the difference in speed between the simulator and the real road was the largest, it was dark on the real road and daylight in the simulator. The
relationship between speed and light condition is not completely clear, although there is some evidence that speed decreases in darkness (Sagberg 1999; Olson & Farber 2003; Owens, Wood et al. 2007). So, in some way the differences in speed between the
simulator and the real road are reasonable. However, there might also be an effect of the simulator itself, but in this study, it is unfortunately impossible to identify the causes of the differences.
Interestingly, the number of line crossings was not significantly different between the simulator and the real road. The number of line crossings has previously been assessed in the simulator validation studies by Philip et al and by Davenne et al. In both these studies, the number of line crossings was higher in the simulator than on the real road (Philip, Sagaspe et al. 2005b; Davenne, Lericollais et al. 2012). A possible explanation to this discrepancy is the different types of simulators: Philip and Davenne used simple table-top simulators, while an advanced moving base simulator was used in the present study.