Creating a sense of normality
A quantitative study examining how a digital collaborative tool impacts students’ experiences in online synchronous group discussionsMain Subject area:Informatics
Author:Aleksandra Voronenko & Agnes Johansson Supervisor:Ida Serneberg
This final thesis has been carried out at the School of Engineering at Jönköping University within the field of Informatics. The authors are responsible for the presented opinions, conclusions and results.
Examiner: Bruce Ferwerda Supervisor: Ida Serneberg
Scope: 15 hp (first-cycle education)
Abstract
Purpose – The unexpected yet drastic influence of the COVID-19 pandemic resulted in a rapid transition of education to be conducted in digital environments. Replacing face-to-face classrooms with synchronous online learning requires a number of appropriate adjustments which were heavily restricted by the urgency of this global change taking place. With the observed issues of student participation and involvement in online learning, the purpose of this research was to investigate the potential that digital collaborative tools have and if they can improve the quality of online group discussions among students aged 12 to 16 years old. Method – This study employs a quantitative data collection approach and makes use of the Community of Inquiry framework. A close-ended questionnaire based on the Community of Inquiry survey tool was used to collect students’ impressions and attitudes after they had participated in the experimental study. The experiment consisted of control and experimental groups that partook in online group discussions as part of a regularly scheduled lesson. Findings – Digital collaborative tools were found to change the way in which students experience online group discussions. The attained rates of the Community of Inquiry were overall higher among students in the experimental group. Our findings tested to be
statistically significant together with the effect size falling between medium to large extent. This further supports the notion that digital collaborative tools bring in a positive difference into online group discussions and have a potential to increase the quality of online learning when implemented carefully and thoughtfully.
Implications – This study emphasizes the importance of developing a clear strategy of how to implement suitable digital collaborative tools into online learning in the most optimal manner that would increase the quality of online learning. This paper can be considered as a starting point for future research that could construct further knowledge within the field and extend our findings by investigating other aspects that have an influence on and can have beneficial effects for younger students in online education.
Keywords – digital collaborative tools, online learning, group discussions, synchronous e-learning, Community of Inquiry, CoI survey, COVID-19 pandemic, quantitative research, experimental study
Table of contents
Abstract
2Table of contents
31 Introduction
5 1.1 Background 5 1.2 Definitions 6 1.3 Problem statement 61.4 Purpose and research questions 8
1.5 Scope and limitations 8
1.6 Disposition 9
2 Method and implementation
102.1 Approach 10
2.2 Research design and implementation 11
2.2.1 Survey adjustments 11
2.2.2 Relevance of the teaching presence 12
2.2.3 Readability tools 12
2.2.4 Feasibility of the experiment 13
2.3 Work process 14
2.4 Data collection 15
2.5 Data analysis 17
2.6 Validity and reliability 19
2.6.1 Reliability 20
2.6.2 Internal validity 21
2.6.3 External validity 22
2.7 Considerations 23
2.7.1 Consent 23
2.7.2 Anonymity and confidentiality 24
2.7.3 Young survey respondents 24
2.7.4 Communication with the school 25
2.7.5 Personal connection 25
2.7.6 Recruitment process 26
2.7.7 Pandemic 26
3 Theoretical framework
283.2 Collaborative learning in a digital context 28 3.3 Community of Inquiry 29 3.3.1 Framework 29 3.3.2 Survey 30
4 Results
315 Discussion
39 5.1 Result discussion 395.1.1 Size of the impact 39
5.1.2 Nature of the impact 41
5.2 Method discussion 44
6 Conclusions and further research
476.1 Conclusions 47 6.1.1 Practical implications 47 6.1.2 Scientific implication 47 6.2 Further research 48
7 References
508 Appendixes
591 Introduction
1.1 Background
According to statistics presented by UNESCO (n.d.) collected during the year of 2020 when the COVID-19 pandemic began, the highest number of learners enrolled in and affected by the closure of schools was 1,484,712,787 learners, which corresponds to 84.4%. This extensive closure of schools has resulted in students learning from home, and teachers operating from home as well (UNESCO, 2020). It has led to educational organizations across the globe having to act very fast in order to switch from the traditional face-to-face teaching approaches to education that is conducted remotely. The approximation made by Hodges et al. (2020) states that it would require from 6 to 9 months to properly adjust a course that was developed for in-presence teaching to fit and work in an online environment. Therefore, it is not a surprise that such an emergency transition resulting from the COVID-19 pandemic has been abrupt and rather painful for most schools and institutions.
Group discussions play an important role in the educational process since they facilitate interpersonal communication between students and contribute significantly to the formation of knowledge and personal development (Jung & Brady, 2020) and interactions between students have been shown to lead to active learning (Hernández-Sellés et al., 2019; Ku et al., 2013). Over 168 studies conducted during the 1900’s demonstrate that a cooperative approach has greater effect on the individual achievements in learning, compared to the effects of competitive or individualistic learning (Johnson et al., 1998). The importance of incorporating group discussions in education is further proven by the content presented in the curriculum for the compulsory school, developed by the Swedish National Agency for Education
(Skolverket, 2018). Several of the general knowledge goals that are defined in the curriculum relate to both the student's ability to learn and work together with others as well as the use of digital tools when attaining knowledge (Skolverket, 2018).
Research has proven that different types of technology can offer positive support in collaborative learning. Usage of multimedia tools and online collaborative tools can
strengthen interdependence, promote teacher-student interaction and social presence as well as enable both resource sharing and activities that require higher-order thinking
(Hernández-Sellés et al., 2019; Kirschner et al., 2014; Ku et al., 2013). However, to ensure these beneficial outcomes, deliberate implementation of the correct tools that provide support, control and encouragement is required (Jaggars & Xu, 2016).
This study stems from these notions, both that group discussions are important and beneficial in educational situations as well as the potential that digital tools have of promoting and assisting in collaborative learning activities. With the COVID-19 pandemic being the main reason for urgently transitioning education into an online environment, these issues become even more important and relevant. Based on these concepts, the study therefore intends to explore what role digital tools can play specifically in this new context of remote, online learning for younger students.
1.2 Definitions
Since digital collaborative tools are one of the main aspects in our work and this term comes up repeatedly throughout the thesis, a clear definition of what is meant by digital collaborative tools specifically in the context of online education is necessary. The key reason behind using digital collaborative tools is to support cooperation between remotely located participants as well as to enable clear and productive communication (Xu & Zhang, 2008). Many variations of digital collaborative tools are currently available. These vary in design and functionality as they target diverse industries and aim to address some specific needs of users, for example, communication, coordination and cooperation. In the educational environment, digital collaborative tools primarily intend to facilitate sharing of opinions, group discussions and cooperative work. These tools can be used in both synchronous and asynchronous classes. According to Xu and Zhang (2008), synchronous collaboration tools are used by groups of people for simultaneous work and real-time communication, while asynchronous
collaboration tools assume that participants have flexibility when making their individual input to the common project at different times. Synchronous collaboration tools could include, but are not limited to, white boarding, collaborative brainstorming, file sharing as well as organization and categorization of information. Throughout this paper, when using the term digital collaborative tools, we will refer particularly to the concept of synchronous
collaboration tools that are used complementary to the video conference platforms.
Specifically in this study, we used Padlet which is a free collaborative resource that allows for visualization and documentation of group work by posting various content such as text, images and links. Padlet is a digital collaborative tool in question in our research and it is used within Google Meet, which is a regular video conference platform utilized throughout the school to host online lessons.
Group discussion is another prominent term in our work and it refers to the process of social
interaction between three or more people that results in information exchange or sharing of ideas and opinions. In this thesis, we use the term of group discussions to define single-time occasions in which students are placed in groups of five participants in order to work on a task or talk through certain issues posed by the teacher. Group discussions in this case do not imply repeated long-term collaboration, and are limited in time to around 10 up to 20 minutes.
Student’s experience is an important element in this research and it is treated as a basis for
comparison of the impact that digital collaborative tools have on group discussions. In the case of this study, students’ experiences primarily consisted of their opinions, attitudes and impressions formed as a result of participating in a group discussion. These concerned students’ general perception of group discussions, and specifically their perspective on the teacher's level of involvement, subject of the overall course and of this particular lesson together with the challenges it posed, the feeling of belonging to a group and communication through the video conference platform Google Meet.
1.3 Problem statement
When reviewing currently available literature around the topic of online education during the COVID-19 pandemic, we noticed that lessons that were initially designed to be conducted in face-to-face classrooms were oftentimes involuntarily transferred into an online environment.
This was made without many adaptations, thus compromising on the social interactions and group discussions (Chaturvedi et al, 2021; Jung & Brady, 2020; Santiago et al., 2021). Research has shown that the advantages of online classes are less likely to apply to younger, dependent learners, as they may not yet possess certain skills related to self-motivation, structure and time-management that would allow them to engage optimally in remote
education (Di Pietro et al., 2020). Furthermore, the majority of students of a younger age have before the pandemic not been in the position of participating in online classes, since the fundamental idea of Swedish elementary and upper secondary school is to be conducted in a face-to-face classroom (Sjögren et al., 2021).
A few studies regarding online discussions have shown that students often display low rates of participation, which can possibly result in a negative impact on the discussion in regards to coherence, depth and efficiency (Lee & Recker, 2021). This has also been proven true in face-to-face classroom discussions, where “64% of students never, rarely or only occasionally asked or responded to a question in the classroom” (Caspi et al., 2008, p. 718). There is also a tendency for participation rates being even lower in web-based instructional environments (Caspi et al., 2008). Participation levels among students in class have been identified by Fassinger (1996) as relating to factors such as student confidence, interaction norms in class and student-to-student interaction.
Previous studies have explored different aspects such as social identities, the design of the discussion, gender differences as well as group sizes and how these factors impact students’ experiences and participation in group discussions (Caspi et al., 2008; Eddy et al., 2017; Lee & Recker, 2021; Pollock et al., 2011). There are also a number of studies that present ideal circumstances for collaborative learning online in general. These include sufficient
instructions, involvement and guidance from teachers, meaningful tasks of appropriate size as well as the use of reliable and convenient technologies (Clark, 2014; Kirschner et al., 2014; Ku et al., 2013; Ng, 2012). Other research within the field has specifically focused on the use of different digital collaborative tools in learning, their influence on different aspects and the importance of incorporating them in a beneficial manner (Hernández-Sellés et al., 2019; Jaggars & Xu, 2016; Kirschner et al., 2014; Ornellas & Muños Carril, 2014). These studies are mainly limited to contexts of asynchronous education and/or formal cooperative learning (group work with longer duration) and some of the studies investigated digital tools from a more general perspective, as integrated in a course rather than implemented in a specific situation. Moreover, through the literature review we identified a trend of the focus for this research being on age groups of students within tertiary education. Presumably because that is where online education mainly and commonly has been implemented before the COVID-19 pandemic (Sjögren et al., 2021). Some more recent studies have also been presented regarding remote learning as a consequence of the COVID-19 pandemic. These discuss the impact it has had on students’ learning and how remote learning functions as a solution in this time
(Dhawan, 2020; Di Pietro et al., 2020; Sjögren et al., 2021).
As our literature review has identified, there are many different angles from which the issues of online learning, group discussions and digital collaborative tools have been explored. However, the novelty of the situation that is being investigated in this paper is caused by the
COVID-19 pandemic that ties all these aspects together under the same umbrella of a unique context that is yet to be explored. As a result, when synchronous online classes are
substituting education in face-to-face classrooms, there is a lack of research on younger age groups in online education and limited research covering the use of digital collaborative tools. This is where we see an opening in the research field. Taking this into account together with the previously introduced issues of low participation rates, we identify an opportunity for this study to hopefully lead to a research outcome that is valuable. The identified opening in the research field motivates the basis of this study, which is to investigate if digital collaborative tools could contribute to improved online, synchronous discussions.
1.4 Purpose and research questions
Drawing on the problem statement, it is evident that there is a need to identify how to maintain quality levels of education for younger learners when it is being transferred online. As online digital tools have previously been proven to support collaborative learning activities (Hernández-Sellés et al., 2019), there is an opportunity to explore the potential of using them in this major shift in how teaching and learning is conducted today. Furthermore, it is evident that improvements can be done in regards to participation rates both in group discussions and in lessons.
Therefore, the purpose of this study is to explore how, and to what extent, the use of a digital collaborative tool in online synchronous group discussions can influence the students’ experiences.
The first research question of this study aims to measure the level of impact: [1] To what extent can the use of a digital collaborative tool in online synchronous discussions influence the students’ experiences?
Through the second research question we focus on understanding what kind of influence digital tools have on collaborative activities of students: [2] How does a digital collaborative tool impact students’ experiences in group discussions that occur as part of synchronous online classes?
1.5 Scope and limitations
The study has a limited target group consisting of students aged 12-16, who participate in remote, synchronous classes.
We exclusively investigate how a digital collaborative tool is used in informal cooperative learning groups. This entails temporary discussions and group constructions that have a limited duration from a few minutes up to one lecture (Johnson et al., 1998).
The aim is not to measure the objective performance of the students but rather the personal experiences of them when learning within this context.
We intend to study digital collaborative tools that are external to the video conference
platform where the lesson is conducted. Specifically, this excludes video conference platforms and online environments used asynchronously such as messaging channels and discussion forums.
1.6 Disposition
In the second chapter of this thesis work we describe our approach to the study, explain what methods we used to collect data and how these methods were relevant. The third chapter introduces theories and previous research that are applicable to our defined area of study. This is followed by presentation and analysis of collected data in chapter 4. Then, chapter 5 discusses the outcomes of the study. Finally, in chapter 6 we draw conclusions, specify how the result connects and contributes to the research field as well as make suggestions for further research.
2 Method and implementation
2.1 Approach
A quantitative approach was chosen as this methodology allows for retrieving numerical data that can explain trends, determine relationships between variables and compare participant groups (Roni et al., 2020a). Since the aim was to investigate the impact of using digital collaborative tools, they constitute the independent variable of the study and the dependent variable is the students’ experiences, more specifically in the context of group discussions within synchronous online classes. The independent variable is the cause of an event, while the dependent variable is affected by the cause (Roni et al., 2020a). A quantitative approach was relevant to implement, since the aim was to be able to investigate the influence of the independent variable on the dependent variable in a comparative manner between the groups. More extensive data, obtained by using a quantitative approach, was assumed to allow for easier identification of patterns in the groups which further aligns with the aim of the study. In this thesis work we followed experimental research design. An experimental study explores and evaluates effects on dependent variables that occur as a result of manipulating
independent variables (Donnon, 2012). The main reason for implementing experimental research design in a study is “to demonstrate that any changes in a dependent variable are the direct result of implementing a specified intervention” (Gersten et al., 2005, p. 157). Since randomized assignment of participating students to control and experimental groups did not pose any empirical or ethical concerns, we decided to implement fully randomized design that would also decrease a potential of selection bias affecting the results. Our approach could be further categorized as a between-subjects design. In a between-subjects design each
participating group is exposed to one condition only, and the comparison is then made by looking at the distinctions between the groups that were placed under different conditions (Bhandari, 2021). In the case of our study, it means that each group was either participating in group discussions with the usage of a digital collaborative tool or without, but there are no groups that combined both consecutively.
It is important to note that we did not deliberately select some particular students or school years for the experiment, but rather we let it be guided by the natural flow of recruitment of the teachers who happen to teach some students but not others. In connection to that, there were 4 students who partook in the experimental study twice, in groups both with and without employment of the intervention. Such overlapping was due to the fact that those students were enrolled into both courses that the same teacher professed. This made those 4 students
perform as within-subjects in the experiment which means that “every individual receives each of the experimental treatments consecutively, and their responses to each treatment are measured” (Bevans, 2021, Between-subjects vs. within-subjects, para. 3). We believe that this minor overlapping does not pose any threats to the result nor to the validity of this study. Even though the majority of the participants were assigned to a single group only, those 4 students who took part in both group discussions, within control and experimental group, were still encouraged and able to share their perspectives by filling out a survey after each group discussion. Apart from that, there was no possibility to exclude those few overlapping
participants from one of the group discussions since they were incorporated into regularly scheduled lessons.
2.2 Research design and implementation
2.2.1 Survey adjustmentsIn order to collect information about how the digital collaborative tool impacted the students’ experiences, we asked the students to fill out a survey after the lesson. Surveys are suitable for collecting information easily from a large number of respondents and they can be used to measure factors such as behavior, attitudes and emotions (Salkind, 2010a). The survey that we used is based on the Community of Inquiry (CoI) theory that, according to previous research, proved to be a reliable measurement tool of participants’ involvement into cooperative learning processes (Stewart, 2019). The Community of Inquiry framework focuses on three main components: social presence, cognitive presence and teaching presence. This framework is further described in 3.3. In our study, we used the existing survey instrument, Community of Inquiry Survey developed by Arbaugh et al. (2008) that covers all of these main
components. With adjustments made to the survey we aimed to ensure clear and straightforward communication with our target group.
As compiled and expressed by Roni et al. (2020b), there are several factors to consider in designing surveys specifically for young participants. These are, amongst others, using simple and explicit language, not including too many questions as well as being concrete and clear (Roni et al., 2020b). The structure and presentation of a survey can affect the data quality, as they have an impact on the motivation and concentration of the respondents, especially if they are younger (Omrani et al., 2019). To avoid issues with ambiguity, response bias, satisficing techniques and burden being placed on the respondents, the survey design needs to be clear, concise, consistent and simple throughout (Omrani et al., 2019). In the adjustments of the CoI survey for this study, these factors were considered.
The 34 items that the CoI survey consist of, we found to be more suitable for students in higher education in how they are phrased. This, together with items being written in English, made them less suitable for implementation within our target group and motivated the relevance of them being somewhat adjusted for this study.
The CoI survey that we took as a base is structured in a way that aims to gather students’ impressions and attitudes with the intention to evaluate a course and offer quality
improvements according to the feedback received. Research conducted by Bangert (2009) puts forward the idea that the CoI survey offers good prospects to be employed as an instrument to measure success and efficiency of online courses. When the survey instrument was initially created it was tested on students taking courses on master and doctoral levels (Swan et al., 2008). This is also where the survey seems to have a tendency to be
implemented, with goals such as assessing bachelor and master courses (Watts, 2017). This is further exemplified in the systematic review by Stenbom (2018). Out of the 103 journal papers that were analyzed, a modest number of two studies were performed in elementary education and three within professional development, whilst the rest were in different levels of tertiary education (Stenbom, 2018). Above mentioned examples illustrate the most
suitability of using the survey in online education, our end goal however was not to evaluate long-term courses but rather collect students’ impressions. Therefore, some of the statements from the original CoI survey were not applicable to this study because the duration of a course is typically several months, while group discussions are single-time events that last for about 10 to 20 minutes. Adaptations to those statements were therefore made to concentrate on the experiences in group discussions instead.
Certain research has also concluded that it is of relevance to modify and refine the CoI survey items (Heilporn & Lakhal, 2020; Lowenthal & Dunlap, 2014), which further justifies us doing so in this study as well. These modifications are regarded as relevant due to the observation that certain items are overlapping and interpreted by respondents as asking about the same thing (Heilporn & Lakhal, 2020). The CoI survey instrument was also first developed in the start of the 21st century and since then there has been a major development in the digital world (Lowenthal & Dunlap, 2014). This also demonstrates the relevance for adjusting the items in order to ensure that they yield results that provide an accurate reflection and understanding of online teaching (Heilporn & Lakhal, 2020).
In addition to simplifying the existing CoI survey, it was further adapted to the young respondents by lowering the number of survey items (from an initial number of 34 to 20), displaying one question at a time and using word based response options. Furthermore, the instructions presented before the survey were accommodated to young respondents in both wording and length. The teacher was also asked to verbally guide the students through the instructions before they started the survey to ensure that every individual was fully informed. 2.2.2 Relevance of the teaching presence
Teaching presence is the section that is least relevant for our study because it primarily assesses the contribution of the teacher to the course. However, in our study we try to find out about students’ experiences in group discussions where the teacher does not have the same number of occasions to be present as during an entire course. Several group discussions that were part of this experiment took place simultaneously. This means that the teacher had less opportunities where they could impact the students and did not take the role of a moderator but rather occasionally guided the groups when needed. It was important to include the teaching presence to some extent, because all three elements in the Community of Inquiry framework are closely connected to and affect each other. As explained by Stewart (2019) teaching presence “puts students in situations where they are likely to develop sufficient social presence to support cognitive presence” (p. 39). Another important point is that over the past decade several researchers were continuously emphasizing the fact that teaching presence is a fundamental component of the CoI framework, and therefore no other presences can be cultivated without instructor’s reinforcement (Stewart, 2019). This is why we came to a decision to keep teaching presence in the survey, and made necessary changes to the original statements so that they focus directly on the group discussions instead of a full course.
2.2.3 Readability tools
Roni et al. (2020b) mention pilot testing as highly important in order to ensure a
well-designed and appropriate survey. By using an existing, previously implemented survey instrument in our study we consider extensive pilot testing of the survey itself to be
redundant. This decision is further supported by the fact that this study is conducted within a shorter time frame of approximately 2 months. However, with the adjustments made to the established CoI survey, we believe there is a need for some type of further assessment. The altered CoI survey items were therefore run through several readability tools, in order to ensure that the phrasings are understandable for the age group of the participants. The survey items were tested on a total of four online readability tools and the average SMOG index was 9.1 which corresponds to sixth grade (StoryToolz, 2016; TextCompare.org, 2021; WebFx, 2021; wordcalc, 2020). To contextualise, the original survey items were also tested in the same tools and the average index for them was ~10.8, which also corresponds to sixth grade but is noticeably higher. As the final version of the survey items were also translated to Swedish, they were tested in a tool measuring their LIX value. LIX calculates a readability score based on the mean of words per sentence together with the number of long words that consist of more than six letters (Ezat, 2019). The LIX readability score of the translated survey items in this study was 39 which is within the range of the second step of the scale. It is interpreted to be classified as easy to read text and equivalent to the readability level of fictional literature and popular magazines (LIX, n.d.).
2.2.4 Feasibility of the experiment
In order to gather information about the current status of the school and get an insight into teacher’s perspectives and experiences with online teaching, we decided to conduct a semi-structured interview before having the experiment. In addition to the readability tests, the teacher who was recruited reviewed our adapted survey statements, as they know the students’ average level of comprehension. This was done to further confirm the
appropriateness of the language used.
Through the semi-structured interview, the responding teacher confirmed that the survey was suitable for the intended target group. A note of the somewhat wordy instructions was made, in regards to the low probability that the students would read them entirely. As a result, we decided to adjust them by adding clear and concise headlines to each instruction. The teacher also assessed the digital collaborative tool in question, Padlet, and concluded that it would be possible to implement it in a functional manner during group discussions despite the
participants being first-time users. A need for continuous collaboration was also discovered, in order to solve certain digital aspects before the experiment was conducted.
It was also established, through the semi-structured interview, that the responding teacher had not regularly used digital collaborative tools during previous lessons or group discussions. However, the teacher had occasionally used different digital tools in full class to host quizzes, such as Kahoot. When asked about group discussions, the teacher described a definite
decrease in possibilities and additional difficulties to conduct them when having lessons online compared to the situation in a physical classroom. The teacher explained that it had been tried one time before, but with deficient results. The main issues that were expressed concerned the organization of online group rooms, supervision of the discussions and therein the subsequent difficulty of securing that the task was executed properly or at all by the students. The teacher also expressed an ambition and hope of being able to implement these types of group discussions online.
The school used Google Meet to host their online lessons, but altered that with having the students present in school some weeks. In further communication with the teacher after the interview, it was discovered that the school did not use the paid version of G Suite Education which would enable the break out room function. Therefore, conducting group discussions needed to be done in an alternative, somewhat more complex practice. Insights received through the semi-structured interview were helpful when planning for and preparing the experiment in order to implement it in the most appropriate way.
2.3 Work process
The initial step of the study was to design and adapt the survey that was intended for the students to answer after participating in online group discussions. The strategy of how the digital collaborative tool, Padlet, would be incorporated was also proposed in the initial stages. We, the researchers, were not responsible for executing the lessons ourselves where the group discussions took place, but it was incorporated by a teacher at the school. Therefore, the strategy was initially seen as a proposal that could possibly be altered depending on the teacher's ability to implement it.
In the next phase of the study, we contacted the school and communicated our plan for the study and roughly how it would be carried out. This was done through the principals and after having their approval we reached out to a teacher to conduct the semi-structured interview. A semi-structured interview is an informal conversation based on a set of questions that
researchers decide in advance, yet it proceeds in a way that allows some flexibility to deepen into certain relevant issues (Longhurst, 2016). We have chosen this interview format because it both served as a guideline for us to navigate through the questions, while it also offered enough freedom to explore some particular topics that emerged as the conversation was flowing.
The interview was conducted digitally through the video conference platform Microsoft Teams. It lasted for 50 minutes and was recorded in order for us to review it further afterwards and be able to accurately reference what had been said. As part of the semi-structured
interview session we introduced the digital collaborative tool Padlet and demonstrated to the teacher how it could be used.
After recruiting a teacher who expressed an interest in implementing group discussions, we entered into the negotiation phase with a common goal of finding the most suitable and convenient way to conduct the experiment. The factors that were discussed together with the teacher regarding the implementation of the study at this stage were: randomized placement of students into group discussions, the choice and usage of an appropriate video conference platform and how to enable online group rooms, as well as structure and creation of the Padlet boards. This communication process was continuous over a two-week time period in order to ensure that the study would be feasible and be planned to yield valuable results.
The next step was to conduct the experiment and carry out group discussions as part of regularly scheduled online lessons. Since the objective of this study was to discover how, if at all, a digital collaborative tool affects the students, we intended to minimize the teacher’s active involvement. Research suggests that instructors who strive to be ever-present will not
ensure high levels of teaching presence but rather prevent students from actively participating in the learning process and discourage them from taking the initiative (Watts, 2017). This is why we aimed to keep the main focus on the digital collaborative tool and prevent the teacher from acting as another intervention and influencing students’ experiences.
2.4 Data collection
The data was collected from 25 students, where 10 had participated in group discussions with the use of a digital collaborative tool and 15 had participated in group discussions without. The population that this study is researching, as previously defined, consist of students at the age of 12-16. More specifically, the population is students in Sweden who at the time of the experiment received education fully or partially online. There were, in the school year of 2020/21, a total of 4,789 comprehensive schools in Sweden (Skolverket, 2020). This is the population of which a sample for this study was selected to collect data from. Although not all of these schools can be assumed to include 12-16-year-old students, and therefore not be a viable sample in this study, the number indicates a generous selection of alternatives. The school that was part of this study was selected since one of the researchers previously attended this school. The personal connection to the school is further discussed in section 2.7.5. In this study there were multiple levels of sampling, and therein recruitment, that was required. Firstly, as mentioned, a school needed to be chosen and contacted. Secondly, one or multiple teachers needed to be recruited. A teacher was recruited who would conduct the experiment with two different groups of seventh graders. The two participating groups were not deliberately selected due to any particular characteristic that they possessed as a group. The only important requirement was that the two groups were as similar as possible to exclude confounding variables, which could in theory be achieved by several other group combinations as well. These seventh graders were then the third level of sampling, and the recruitment involved prompting the students to answer the survey.
Both of the research questions were aimed to be answered by the data collected through the CoI survey. All survey items had six different response options in order to measure the extent of agreement that a student had regarding each statement. The response options were
presented in Swedish and were phrased as follows (translated to English): A = “I strongly disagree”, B = “I disagree”, C = “Neutral”, D = “I somewhat agree”, E = “I agree”, F = “This question does not apply to my experience”. Each survey item was presented separately to ensure clarity and allow the respondent to focus. The survey was distributed online through the website Question Scout where the responses also were stored.
Image 1. Example of a survey item as it was presented to the respondents on the website Question Scout.
To answer the first research question, the data needed to be easily compared to identify differences between the two groups. By opting for close-ended questions we ensured that the survey participants were confined to a selection of predefined response options. This also meant that we could more easily analyze the data in a comparative manner. In order to answer both of the research questions, the collected data also needed to consist of some evaluation which could be translated into numerical values. When analyzing the data, this would allow for easy identification of different trends and the direction of them. By using the Likert scale as response options this was made possible.
The original CoI survey instrument uses a 5-point Likert scale, ranging from 0 (= strongly disagree) to 4 (= strongly agree), to score the responses (Arbaugh et al., 2008). Therefore, it was also chosen for the survey of this study. An additional opt-out possibility for situations when the statement did not apply to the student's experience was also included. This is due to the previously mentioned fact that the CoI survey instrument initially was developed to be suitable for evaluation of courses at tertiary levels. The same items, although rewritten, in this context could therefore sometimes be not applicable. The Likert scale was also selected because it is a suitable option for younger respondents compared to both dichotomous scales and multiple choice formats (Omrani et al., 2019). The Likert scale, unlike dichotomous scales, offers a way to measure intensity and is less probable to cause correct guessing in comparison to multiple choice formats (Omrani et al., 2019).
2.5 Data analysis
In order to examine quantitative data collected through the use of the survey we employed statistical analyses. According to Drew et al. (2008a), the use of statistical analyses is
appropriate for discovering “what occurred and whether … [an] intervention or treatment was effective” (p. 244).
Initially, each response option in the survey was verbally labeled, but to allow for numerical analysis of the data the options were later translated to a number between 0 and 5. The neutral point is represented by a 3, where any value larger than that (> 3) indicates an agreeing attitude to the statement and any value smaller than the neutral point (< 3) indicates a disagreeing attitude. The opt-out response option was translated to the value of 0, as it indicates a statement that was somehow deemed not applicable to the students’ experiences. The second step of familiarising with our data meant putting each of these translated values in a spreadsheet. This provided an overview of the answers of each respondent for all survey items and allowed for reviewing the collected data. Mertens et al. (2017) explain how cleaning data means increasing credibility of the results by removing unreliable data or invalid cases. The decision to delete a case should be made carefully, but it is important to do so when it threatens the reliability or validity of the study (Mertens et al., 2017). This was considered when reviewing the data collected in this study, to ensure credible results before analysing them further. Extreme tendencies and so called outliers, where the values of a case are extreme in any direction (Mertens et al., 2017), were the types of unreliable data that were most probable to appear in this study.
In order to present the data in a convenient and effective manner, we constructed a
contingency table. Each survey item was put in the rows, with the mean from the two different groups and the difference between them displayed in the columns. With the use of cross tabulation in a contingency table our aim was to analyze and showcase the correlations between the multiple variables. Cross tabulation is used to categorize, group and classify data to allow for comparisons (Sreejesh et al., 2013). Typically, contingency tables are designed so that demographic factors are represented in the columns which can be seen as “indicators of state of mind” (Sreejesh et al., 2013, p. 174). The rows represent the behaviour of the different states of minds, which then allows for comparison and analysing connections between the two factors (Sreejesh et al., 2013). The table we present in this study displays the group as either control or experimental as an indication of state of mind, whilst the attitudes are documented as the means of the survey responses. Therefore, this allows us to compare and identify potential relationships between group belonging and attitudes.
The first research question of this thesis aims to examine a potential difference between the usage and non-usage of a digital collaborative tool and therefore, inferential statistics were relevant to use. According to Drew et al. (2008c), inferential research is helpful in building conclusions when it comes to comparison of or relationships between the data. Therefore, a comparison of the data collected from the experimental group with the data collected from the control group was made. It was done by reviewing the size of the variation in the data
enabled us to differentiate the levels of impact that digital collaborative tool, Padlet, and its absence had on students’ experiences in group discussions.
When comparing means, with the intention to identify if they differ, the simplest way is to just inspect the mean values and draw conclusions based on them. However, when doing that it would only be possible to infer about the observed samples instead of the entire population (Iversen & Norpoth, 1987). By using inferential statistics, such as the analysis method student's t-test, researchers can determine whether the results are statistically significant which implies that the means are also representative of the population where the samples are drawn from (Boslaugh, 2012; Drew et al., 2008c). When results are proven to be statistically significant, it also means that the observed difference between them did not occur based on chance or random error but instead can be interpreted to have occurred based on a true relationship between the variables (Tashakkori & Teddlie, 2009).
Since we wished to infer about the effect of a digital collaborative tool beyond our drawn sample, we decided to test the significance level. There are several assumptions about the data that have to be met in order for researchers to be able to conduct the previously mentioned student's t-test (Boslaugh, 2012). According to Boslaugh (2012), one of the assumptions requires that “the population from which … [a] sample was drawn has an approximately normal distribution” (p. 156), which was not the case with our data set. Since we were unable to fulfill all the criteria for conducting a t-test, we opted for the alternative nonparametric equivalent of the unpaired t-test known as Mann-Whitney U test.
In the Mann Whitney U test, a null hypothesis (H0) is assumed to be true until proven
otherwise by analysis (Willard, 2020). As explained by Herzog et al. (2019) “the null hypothesis claims that, even though an observed difference of sample means occurs, the difference comes from undersampling, i.e., from the noise-alone distribution” (p. 33). The researcher should also state an alternative hypothesis (H1). Our hypotheses for this study were
as follow:
Null hypothesis: There is no difference between the two groups. Alternative hypothesis: There is a difference between the two groups.
A U-value will be computed from the test which then will be compared with a critical U-value to determine whether the null hypothesis can be rejected (Willard, 2020). If the obtained value is smaller or equal to the critical value, the null hypothesis can be rejected which implies that the difference is real within the population and not caused by chance (Willard, 2020). The purpose of calculating if the results are statistically significant, can therefore be seen as preventing us from drawing faulty conclusions about the population. The significance in itself does however not disclose anything particular about the results of the study, which implies that further discussion and presentation of the effect size is necessary (Herzog et al., 2019). The effect size of the results is therefore also reported in this study as it indicates the
magnitude of the effect (Durlak, 2009; Grissom & Kim, 2011). This is helpful for answering the first research question of this study, as it serves as a measurement of the extent of the observed difference. Reporting the effect size is also strongly advised and considered important according to several articles, in order to communicate the importance of the
findings to the reader in a clear way (Fritz et al., 2012; Grissom & Kim, 2011; Thompson, 2007). The most straightforward estimate of effect size is directly comparing the difference in the means of the groups (Durlak, 2009; Fritz et al., 2012). However, this often means that it is more difficult to compare with the effect sizes of other studies which suggests standardized effect size calculations as a more appropriate choice (Durlak, 2009). This is further supported by the fact that a report of effect size based on the difference between the means does not take variability of the data in consideration which “can conceal important properties of the effect” (Fritz et al., 2012, p. 3). Therefore, calculation of the correlation coefficient, signified as r, with the help of the z-score which was proposed by Cohen (Fritz et al., 2012), will be used for this study. It is a calculation recommended by Fritz et al. (2012) to be implemented on data without normal distribution and where a nonparametric test, such as the Mann Whitney U, has been used. Even though reporting r is most appropriate in this study based on the qualities of the collected data and because it will yield more accurate results, it was also later translated into Cohen’s d in order to ensure that our findings can be put in the context of prior relevant studies so that reasonable conclusions can be drawn. The probability of superiority (PS) is also reported in this study in order to clarify the effect size in “a more concrete and
meaningful way than the standardized difference” (Fritz et al., 2012, p. 14). As explained by Fritz et al. (2012) this statistic is presented as a percentage which represents the number of times “a randomly sampled member of the distribution with the higher mean will have a higher score than a randomly sampled member of the other distribution” (p. 14).
The second research question addresses the nature of impact (positive and negative) that a digital collaborative tool, Padlet, has on students’ experiences. To interpret and present our findings related to this research question we utilized descriptive statistics. These allow for evaluation and explanation of performance, scores or characteristics of groups (Drew et al, 2008a). By aiming to describe the type of impact that a digital collaborative tool had on students’ experiences in our sample, it was suitable to provide central tendency measures. The arithmetic average was calculated in order to reflect whether the CoI was more present in the control or in the experimental group. This was also helpful in establishing whether the digital collaborative tool contributed to a more productive and engaging group discussion or if it had a negative effect on students’ experiences. The use of central tendency measures, and more specifically the mean values, helps us to identify the most common and frequent responses in both groups, which are then used as a basis for making judgements about the kind of effect that a digital collaborative tool brought into group discussions.
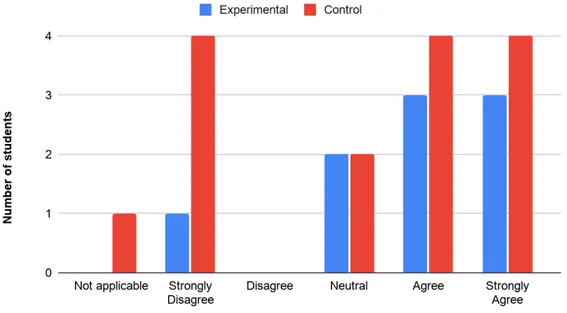
Bar graphs were created to visualize the aspects of the students’ experiences where the digital collaborative tool had the biggest impact. The six items where the mean of the answers from the control group differed the most from the experimental group were selected. Visualizing the distribution of answers from each group for these six items allows for easier identification of the nature of impact.
2.6 Validity and reliability
In this section we address the most important factors that were taken into account in order to ensure that the methodology as well as the overall thesis work are valid and reliable.
2.6.1 Reliability
Reliability and validity are the primary and most desirable properties of assessment tools (Bangert, 2009; Carrig & Hoyle, 2011). Replication is fundamental in scientific method, but by using measurement tools that are not reliable means that the research results are not replicable (Swan et al., 2008). There are several approaches to ensure that an assessment tool is reliable which often depend on using “statistical models of measurement and/or definitions of the set of replications across which reliability will be assessed” (Carrig & Hoyle, 2011, p. 129). A simple method to ensure reliability of a survey instrument is to provide clear and unambiguous measures. This would be done in order to ensure that, if repeated with the respondents, the results from the survey would to a large extent be similar (Andres, 2012). This was one of the goals of adjusting the CoI survey items to accommodate the target group of this study, as previously described.
Validating a test or an assessment instrument is a process that spans over an extended period of time and includes several independent studies that utilize that test or assessment instrument to produce evidence of its usefulness and relevance (Bangert, 2009). Even though many papers suggest that additional investigations should be conducted to further prove the validity and appropriateness of the CoI survey in a variety of contexts, Bangert (2009) asserts that “there is adequate evidence to date to support the use of the CoI survey in its present form as a formative assessment that can be used by faculty to improve the design and delivery of their online courses” (p. 111).
According to Arbaugh et al. (2008) “Cronbach’s alpha yielded internal consistencies equal to 0.94 for teaching presence, 0.91 for social presence, and 0.95 for cognitive presence” (p. 135). This indicates that a set of statements for each presence is truly measuring the same
fundamental notion, which in turn proves that CoI survey is a reliable assessment tool. Furthermore, the CoI survey has through multiple other studies been shown to yield reliable and valid results (Stenbom, 2018). This has been concluded through both exploratory and confirmatory factor analysis in these studies that were conducted over a span of about 10 years in different learning contexts (Stenbom, 2018).
Sample size is another factor that impacts the reliability of a result, where the larger it is the more reliable it is as it holds greater statistical power (Roni et al., 2020c). Sample size also affects the generalizability of the result which is part of the external validity (Roni et al., 2020c). There is however no definite number that dictates what an adequate sample size is (Drew et al., 2008c). Some researchers present numbers such as 12-14 respondents as a rule of thumb when comparing groups (Drew et al., 2008c) whilst others define 30 respondents per group as the suitable minimum (Strunk & Mwavita, 2020). This indicates that there is no agreed upon minimum that can be applied in every study, but rather researchers should when deciding a sample size “use their best judgment and consultation resources” (Drew et al., 2008c, p. 310). In other studies where the CoI survey has been employed for data collection, there has been a wide range of sample sizes. In the systematic review conducted by Stenbom (2018), the sample sizes vary from five respondents as the lowest number to 64,781
respondents as the highest, with a median value of 158. The sample size of this study, being 34 participants, places itself on the lower end of the spectrum. In total 25 respondents filled
out the survey, out of which 10 students participated in the experimental group and 15 in the control group. We find it to be a realistic sample size that also can be considered reliable in relation to the scope of this study and the context in which it is performed. The context, compared to tertiary levels of education, means that each class group is smaller and it would have been necessary to recruit more teachers, in order to gain a larger sample size. Although larger sample sizes are preferred in regards to generalizability, small studies can also yield valuable results particularly when they are part of early research within a specific area (Slavin & Smith, 2009).
2.6.2 Internal validity
Despite the CoI survey being a reliable measurement tool according to previous research (Arbaugh et al., 2008; Bangert, 2009; Kovanović et al., 2018; Swan et al., 2008), there are still some possible errors that can occur in the measurements. According to Lund Research Ltd (n.d.a), errors emerge due to some circumstances affecting the true value of the measurable component. These errors could arise as a result of factors like respondents’ current mood, degree of tiredness, overall wellbeing, ability to focus or distracting
environments (Lund Research Ltd, n.d.a). The impact of these errors may result in students’ evaluations to not be precise representations of their actual experiences in group discussions which might decrease the internal validity of the experiment. In this study, the students’ responses could therefore in some cases be a combination of their true evaluation with some degree of error. Although the errors specific to this study are not possible to control by the researchers, it is important to acknowledge the chance they have of impacting the results. In order to establish internal validity, it is important to eliminate common threats and ensure that there is a causal relationship between variable A, the cause, and variable B, the outcome (Martin & Bridgmon, 2012). When a study cannot ensure internal validity, the results are most likely deriving from another cause than the one intended to be investigated (Slack &
Draugalis, 2001).
To ensure that the causal relationship between the two variables is direct, a potential third, uncontrollable variable needs to be minimized as that otherwise can lead to impacting the result and the appearance of the relationship between the two variables (Salkind, 2010c). The potential confounding variables in a study like this could have been for example the possible different ages of the respondents, differences in instructions from the teachers and differences of subjects discussed. Eliminating these potential differences and making the intervention the key difference between the experimental group and control group will support arguments that the outcomes are attributable to the intervention (Capraro et al., 2019; Roni et al., 2020a). Our aim was therefore to diminish the effects of the external factors that we could control by ensuring that both control and experimental groups were placed under the same conditions. This was achieved by comparing online group discussions that took place in grade 7 among the students of the same age, 13, and within the same subject group. Furthermore, both the control group and experimental group can be assumed to have received similar instructions and guidance through the discussions as they were given by the same teacher. There are numerous participant-led determinants that may influence the outcome of the study yet are impossible to control by researchers (Lund Research Ltd, n.d.a). According to Donnon (2012)
“by randomizing learners ... the researcher strives to anticipate confounding factors that may influence the internal validity concerns related to doing quantitative studies” (p. e82). Taking this into consideration, we made sure to avoid selection bias by randomly assigning students to control and experimental groups instead of assembling these groups based on some common characteristics that students might share.
Another potential threat that could reduce internal validity is experimental mortality which has to do with participant drop-outs. This type of threat is only critical when the dropout rates are significantly different between the groups that are being compared (Lund Research, n.d.b). As a general observation, Lund Research (n.d.b) notes that the longer the study lasts the higher are the chances of participant withdrawals. Loss of participants can cause misleading conclusions since it is difficult to state that the findings of the experiment are due to the intervention and not the drop-outs (Lund Research, n.d.b). One measure that was undertaken, in regards to minimizing the chances of participant drop-outs in our study, was asking students to fill out the survey while the lesson was still ongoing. As opposed to doing it in their free time intended for the break between classes, giving them the chance to do it during the lesson might increase the probability of them filling it out. Other measures that were taken concerned the survey design. By adjusting the survey to accommodate them we had the intention to lessen the required effort of the respondents and their perceived difficulty. Another aspect that could lead to deceptive interpretations of the conducted study is the possibility that those students who partake in group discussion without integration of digital collaborative tools might still utilize these tools on their own initiative, without realizing that this decision could interrupt the purpose of the study. In order to track these behaviours we decided to add a question at the beginning of the survey, asking the students if they used any digital collaborative tool during the group discussion. They could choose an option from a predefined list but also write the name of the tool in an open ended option labelled “Other”. An answer to this question would inform us if and how many students from both control and experimental groups used any supplementary digital tools. This knowledge allowed us to make credible judgements about relationships between students’ experiences and any interventions that affect them.
2.6.3 External validity
The sample for this study is assumed to include students with different characteristics: boys and girls, students with different types of interests, students with varying grades, and from different family backgrounds. Including a broader variety of participants helps avoid sampling bias, which is when a sample is prevented from being representative of the overall population (Bhandari, 2020).
Due to practical concerns, most studies prioritise either internal or external validity, since they can have a tendency to impact each other’s effect (Drew et al., 2008d; Henry, 2009).
Generalizability of the result, which is part of external validity, tends to be prioritised in later dimensions of research within the chosen field and when larger studies are conducted (Drew et al., 2008d; Slavin & Smith, 2009). By opting for a sample of groups that are more
homogenous we exclude some confounding variables, which is beneficial for internal validity, but also sacrifice more generalizable results. This can be justified with the fact that this study
has a relatively small scope and time frame, but also as it is in early stages of the research program within this area. Druckman et al. (2011) also describe how “external validity results primarily from replication of particular experiments across diverse populations and different settings using a variety of methods and measures” (p. 34). Therein, external validity is not prioritized over internal validity in this study. Despite this not being the focus, there are still some circumstances of this study that contribute to the generalizability and external validity. For example, by reporting the calculated effect size, which is done in this study, the results become more generalizable (Grissom & Kim, 2011). The effect size allows researchers to compare across several studies (Fritz et al., 2012).
The ecological validity is high in this study due to the fact that the experiment was
incorporated into an actual lesson instead of being conducted outside of school context for example in a lab setting with minimized extraneous variables. This increases the
generalizability of the findings and makes them more applicable to real-life cases (Bhandari, 2020). Since the ecological validity is high, the findings of this study would not be able to be generalized to other settings outside of education, as there would most likely be different end goals of having a group discussion.
A threat to external validity is the Hawthorne effect which, according to McCambridge et al. (2014), is a change in behaviours of study participants caused by awareness of being
observed. In our study, there was a slight possibility that students might have changed their behaviour and perhaps made more or less effort when participating in the group discussions. Such behavioral changes might root from students being informed of the experiment taking place as they work on the task within group discussions. Some other reasons could be a teacher joining the group discussions to listen in and check on students as well as the researchers observing the students as they work on the task. To reduce chances of the Hawthorne effect taking place and affecting the outcomes of this study, we refrained from attending the online lessons and discouraged the teacher to interrupt the flow of the group discussions unless absolutely necessary.
2.7 Considerations
Several aspects were necessary to consider at the different stages of this research. Ethical, methodological and practical considerations are further addressed in the following sections of this chapter. These are relevant to reflect on prior to thorough development of the
methodology and data collection. 2.7.1 Consent
Getting consent means that potential respondents through an explicit act, such as verbal confirmation or written agreement, accept to take part (Gallagher, 2009). However, consent can only be given if the participant is informed about and understands certain factors of the research such as the purpose, structure and possible outcome (Gallagher, 2009). Valid consent also means that the participants are properly informed about their rights both during the study but also in the process of giving or refusing consent (Alderson & Morrow, 2011). Younger participants are vulnerable in their relation to adults due to the unequal social status and subsequent existent power imbalance (Gallagher, 2009; Roni et al., 2020b). This vulnerability
This is strongly connected to consent, as valid consent is given freely “without pressures such as coercion, threats or persuasion” (Alderson & Morrow, 2011, p. 101). Therefore, it was necessary in this study to not only provide the option of giving or refusing consent, but also to provide information about this study and the rights that the participants had. As the
participants of this study are of a younger age, the information that was presented needed to be easily understandable for that age group. Roni et al. (2020b) explain how considerations must be taken into account regarding both literacy and cognitive development of the respondents. Throughout the study the participants also had to have the possibility to
withdraw their consent and be able to stop participating in the research (Alderson & Morrow, 2011; Gallagher, 2009). In order to conform with the above mentioned standards, students who were recruited to participate in our study were verbally informed about the experiment taking place by the teacher who was conducting the lessons. Furthermore, the survey that the students were offered to fill in started with highlighting the right of students to choose if they want to partake as well as their right to drop out at any time.
2.7.2 Anonymity and confidentiality
Ethical considerations regarding confidentiality and anonymity are also relevant to include in our study. Anonymity can be seen as one form of confidentiality, concerning the act of maintaining the identity of participants secret (Saunders et al., 2015), where confidentiality concerns avoiding to disclose any information that has been provided by a participant which may identify them (ESRC, 2015). In research, the participants should be made aware of the extent of their anonymity and confidentiality (BSA, 2017). In this study, data that might identify the participants individually were not deemed necessary. For example, personal information such as gender or name was not collected, but rather the survey was restricted to identifying which group they belonged to (control group or experimental group) and
prompting them to evaluate their experience. As explained by Saunders et al. (2015) “true anonymity is by definition never achievable, i.e. there will always be at least one person with access to participant information” (p. 617). However, by not documenting any information that identifies the participants, the classes or the school the aim is to ensure the anonymity of the individuals to the largest extent.
2.7.3 Young survey respondents
Young respondents are generally more inclined to satisficing, where they tend to give answers they believe to be correct or expected by the researcher (Roni et al., 2020b). This is a factor that also had to be considered when setting up and conducting this type of study, in order to ensure honest answers that reflect the true experiences of the respondents.
When a respondent is satisficing, it means that they are giving superficial responses that they believe are reasonable or acceptable (Omrani et al., 2019). The satisficing theory developed by Krosnick describes how the combination of respondent and question characteristics has an effect on the reliability of the response (Omrani et al., 2019). This theory also describes a “strong relationship between the respondent’s cognitive ability and the reliability of responses” (Omrani et al., 2019, p. 330). Therein, this had to be considered in our research design, as the cognitive ability of younger respondents is different to the ability of adults. When designing a survey for young respondents some things to consider are that at the age of
12-16, the respondents are at risk of getting bored easily and lose motivation as well as being context sensitive and literal (Omrani et al., 2019). Aspects such as question type, response options, ambiguity and difficulty should then be handled with this in mind (Omrani et al., 2019). However, it is important to remark that the respondents of this study were at the age of 13 and there is an improved cognitive functioning of adolescents of this age compared to even younger kids, which means subsequently there is an increased reliability of their responses (Omrani et al., 2019).
2.7.4 Communication with the school
Other relevant considerations in the initial stages of the study were related to the
communication with the school. Aspects such as flexibility, minimizing stress for the teacher and communicating benefits of the study needed to be considered. In order to ensure good relationships with a school, it is important to understand the characteristics of that specific school and have knowledge about the school system (Svirydzenka et al., 2016). It is especially important to understand and respect the primary objective of schools, which is to educate children, and the probability of them being busy and concerned with other matters than hosting a research project (Svirydzenka et al., 2016). Apart from being aware of it, the researchers can also take further measures by discussing the study with teachers to minimize disruptions and receive input as well as communicate the flexibility of the research in favour of the school’s methods (Alibali & Nathan, 2010; Roni et al., 2020b). Furthermore, the researchers need to manage their own responsibilities in the research and through that minimize the burden of the school, the teachers and the students (Roni et al., 2020b). In the initial stages of the study, when contacting the school to seek approval of the study, the expectations of them as well as the connection between the study and beneficial outcomes for them as an educational institution should be clearly communicated (Roni et al., 2020b; Svirydzenka et al., 2016).
2.7.5 Personal connection
One of the researchers of this study has a personal connection to the school that was sampled, as it was the comprehensive school she studied at. This should not have had an impact on the data collection but was rather beneficial for the recruitment process.
This study had the aim to investigate students at the age of 12-16, but there were no specifications in regards to sampling a school. Therefore, the school was not chosen based upon any of its characteristics and could be replaced by any other school if the study were to be replicated. However, regarding the communication process with the school, the personal connection was influential, which means it is an important aspect to acknowledge. As it is estimated to have had a relatively large impact on the success of recruiting a teacher, the research process can be assumed to have had other issues or even results if there was no personal connection.
When determining which school to contact, instead of doing this randomly, this school was selected as it would simplify certain aspects when reaching out and communicating with them. As explained by Bartlett et al. (2017), getting access to a school for conducting research is time consuming and is often helped by an established and collaborative connection. If there