The impact of overconfidence on trading volume
dur-ing economic changes
Free scientific work to obtain the degree of a Master of Science at the Faculty of Business Administration
Jönköping International Business School
MASTER’S DEGREE
THESIS WITHIN: Business Administration NUMBER OF CREDITS: 15
PROGRAMME OF STUDY: International Financial Analysis AUTHOR: Reha Gügercin, Sabrina Tina Richter
Master Thesis in Business Administration
Title: The impact of overconfidence on trading volume during economic changes Authors: Reha Gügercin, Sabrina Tina Richter
Tutor: Dorothea Schäfer Date: 2021-05-24
Key terms Overconfidence • COVID-19 • Trading volume • Individual investors • Inves-tor behaviour • The correlation of psychological and economic variables
Acknowledgement
We want to thank everyone who supported us during this master thesis. Notably, we want to thank our supervisor, Dorothea Schäfer, for essential guidance and knowledge. We also want to thank every participant for their support and response to our survey. We
ap-preciate this very much and therefore decided to donate $1 US for each completed survey to AkaAni NPC in South Africa.
The impact of overconfidence on trading volume during economic changes
Sabrina T. Richter, Reha Gügercin
ABSTRACT
A central topic in behavioural finance is extensive trading. One of the most common behav-ioural explanations for this phenomenon is overconfidence. In finance, overconfident traders feel that their information is sufficient to justify a trade even though it is not. Investors who consider themselves to be above average in their level of expertise show higher trading vol-umes. During the COVID-19 pandemic, the trading volume in the financial markets increased significantly. Further, young and inexperienced traders entered financial markets and volatility increased. Overconfidence could provide explanations for some of these financial market par-ticularities. The study of Glaser and Weber (2007), which investigates the correlation of over-confidence and trading volume, lays the foundation for this study. We extend their research with a survey testing the degree of overconfidence and trading volume during COVID-19. The central aim of the thesis is to investigate to what extent overconfidence influences the trading volume during the COVID-19 pandemic. The analysis is unable to show a significant positive effect of overconfidence on the trading volume during COVID-19. But our research supports the findings that younger and inexperienced traders entered the market during 2020, who are on average more overconfident than experienced traders. The results further show that retail investors with more than two years of trading experience have significantly increased their trading volume during 19. The analysis also provides evidence that during the COVID-19 pandemic, traders who assign themselves above average within their investment skills traded significantly more.
TABLE OF CONTENTS
LIST OF ABBREVIATIONS ... II LIST OF FIGURES ... III LIST OF TABLES ... IV LIST OF APPENDICES ... V
1. INTRODUCTION ... 1
2. THEORETICAL BACKGROUND AND LITERATURE REVIEW ... 3
2.1. Overconfidence ... 3
2.2. Overconfidence and trading volume ... 9
3. COVID-19 CRISIS AND TRADING VOLUME ... 13
4. NEW DISCOVERY AND HYPOTHESES ... 19
5. METHODOLOGY ... 21
5.1. Sample and Data Collection ... 21
5.2. Survey Design ... 23 6. KEY FINDINGS ... 30 6.1. Data ... 30 6.2. Main Results ... 33 6.2.1. Overconfidence ... 33 6.2.2. Trading volume ... 35
6.2.3. Correlation of overconfidence and trading volume during COVID-19 ... 38
6.3. Additional Findings ... 42
6.3.1. Gender ... 42
6.3.2. Level of Expertise ... 43
7. DISCUSSION ... 46
7.1. Methodology and research samples ... 46
7.2. Measuring methods and results ... 49
7.3. Research hypotheses ... 52
8. CONCLUSION ... 54
APPENDIX ... 56
LIST OF REFERENCES ... 65
List of abbreviations
COVID-19 coronavirus disease 2019
e.g. exempli gratia
EMH efficient market hypothesis
et al. et alii
EUR euro
GDP gross domestic product
GDPR general data protection regulation
H1 hypothesis 1
H2 hypothesis 2
H3 hypothesis 3
i.e. id est (that is)
p. page
S&P 500 Standard & Poor's 500
UK United Kingdom
US United States
VAR vector autoregressive
VIX Chicago Board Options Exchange Volatility Index WHO World Health Organization
List of figures
Figure 1: Increase of publications from 2000 to 2020 ... 6
Figure 2: Miscalibration measurement methods ... 8
Figure 3: Trading volume of Deutsche Börse Cash Market (in EUR) ... 18
Figure 4: Listing number of surveys ... 22
Figure 5: Structure of the survey ... 24
Figure 6: General knowledge questions ... 25
Figure 7: Stock price forecast - question type 1 ... 26
List of tables
Table 1: Summary of previous studies – overconfidence and trading volume ... 13
Table 2: Summary of previous studies – COVID-19 and trading volume ... 19
Table 3: Survey evaluation ... 30
Table 4: Geographic distribution percentage ... 31
Table 5: Profession distribution ... 32
Table 6: Measures of miscalibration (overconfidence) ... 35
Table 7: Security holdings ... 36
Table 8: T-Test: two-sample assuming equal variances (trading during COVID-19) ... 38
Table 9: Pearson Correlation Matrix ... 39
Table 10: Regression – impact of overconfidence on trading volume during COVID-19 ... 40
Table 11: The differences between male and female participants ... 42
Table 12: T-test: two-sample assuming equal variances (gender) ... 43
Table 13: Level of expertise across domains ... 44
List of appendices
Appendix 1: Descriptive survey introduction to each part ... 56
Appendix 2:General knowledge questions part 1 ... 57
Appendix 3: Stock price forecast part 2 (first 3 questions) ... 57
Appendix 4: Stock price forecast part 2 (first 3 questions solutions) ... 58
Appendix 5: Stock price forecast part 2 (second 3 questions) ... 58
Appendix 6: Trading volume questions ... 59
Appendix 7: Demographics questions ... 60
Appendix 8: GDPR Thesis Study Consent Form ... 61
Appendix 9: Analysis increase of overconfidence publications ... 62
Appendix 10: Analysis trading volume 2019/2020 ... 63
Appendix 11: Trading volume during COVID-19 analysis ... 64
1. Introduction
In 2020, dramatic economic impacts from the COVID-19 pandemic can be observed. In the specific case of capital markets, these economic impacts are primarily characterised by excessive stock price volatility. The traditional finance paradigm, which contains per-fectly rational and ideal self-control, fails to explain this period of extreme volatility (Bansal, 2020). Along with volatility, trading volumes increased significantly during the year 2020 (Ortmann, Pelster & Wengerek, 2020). In the US, a considerable increase in small investors, the so-called "Robin Hood traders", can be observed (Fritzgerald, 2020). This development can be related to the observation that especially more young and inex-perienced traders entered the trading market (Chiah & Zhong, 2020). As the COVID-19 crisis brought up new market participants and conditions inexplainable by traditional fi-nancial models behavioural finance provides alternative explanations (Bansal, 2020). Moreover, behavioural finance models explain certain aspects of financial decision-mak-ing that are inconsistent with the EMH. A central topic of behavioural finance is over-confidence. Several empirical studies discovering the effect of overconfidence on market efficiency (De Bondt & Thaler, 1995). Overconfident investors in financial markets gen-erate high trading volumes, thus disrupt market efficiency. Glaser and Weber (2007) state that investors who consider themselves to be above average in their level of expertise or overconfident trade more. Berk and DeMarzo (2017) argue that overconfident traders feel that their information is sufficient to justify a trade when it is not. As a result, the over-confident trader is revealed to trade more (Barber & Odean, 2000). The observed positive relationship between overconfidence and trading volume encourages to investigate to what extent overconfidence plays a role in the rising number of new trading accounts and the increasing trading volume during the COVID-19 pandemic (Chiah & Zhong, 2020; Ortmann et al., 2020). Hence, this thesis aims to answer the question: does overconfi-dence significantly impact the trading volume during the COVID-19 pandemic?
The analysis proposes no generally significant and positive effect of overconfidence on the trading volume during COVID-19. However, the significant results support the con-jecture that younger and inexperienced traders entered the market during 2020. 57% of the participants confirmed that COVID-19 was a reason to start trading, and 23% started trading in 2020. Combining the results of two miscalibration measures, a general
knowledge part and a stock price forecast part, it can be concluded that 84% of the par-ticipants who started trading are overconfident on average. The newcomers are with 26 years on average younger than the average age of all participants. Further, the results show that younger and inexperienced investors, on average, are more overconfident than experienced traders. Our study provides evidence that retail investors with more than two years of trading experience significantly increased their trading volume during COVID-19. The analysis also shows that investors who assign themselves to good/strong knowledge with investment experience trade on average twice as much as all sample par-ticipants. As the regression shows a positive influence of "level of expertise" on "trading volume during 19", the assumption of a significant positive influence of COVID-19 can be highlighted.
Observing Germany as a wealthy and economically strong country, investors are much more willing to invest in the capital market than investors in other countries. Due to the restraints (movement restrictions and lockdown orders) in Germany, the stock market is the only viable substitute for gambling platforms in this country (Chiah & Zhong, 2020). Therefore, the survey focuses on German participants. The data collection used for the analysis was created by surveying retail investors. As Glaser and Weber (2007) did, an online questionnaire is used to investigate the influence of overconfidence on trading vol-ume. We discover the overconfident behaviour of the participants amidst the background of COVID-19. For the survey, retail investors with every experience and professional level were evaluated compared to Glaser and Weber (2007), who only considered profes-sional traders. Part 1 and part 2 of the survey investigate the degree of overconfidence of a participant. Part 3 examines the trading volume during COVID-19. In the following analysis, these two factors will be used to investigate the research question.
The paper is structured as follows. Chapter 2 deals with the theoretical background and the literature review to establish the basic framework of overconfidence and trading vol-ume. Overconfidence could impact trading volume; it follows a comparison of different studies. Chapter 3 deals with the current COVID-19 crisis from an economic point of view. With the contribution to the already existing literature, chapter 4 presents the cre-ated hypotheses. Chapter 5 describes the empirical method of this thesis. A representation of the analysis, key findings, and additional survey findings are in chapter 6. Finally,
chapter 7 shows the discussion to connect the stated literature, the theoretical background, and the COVID-19 paper with the results of this thesis. Chapter 8 concludes.
2. Theoretical background and literature review
2.1. Overconfidence
The characteristics "believing we know more than we truly know" and "believing we are better than others" may appear very similar; however, psychologists make a fundamental distinction between the two (Skala, 2008). The distinction is much more pronounced in economics and finance and will be explained more deeply in the following paragraphs. Glaser, Nöth and Weber (2004) claim that there is no precise definition of overconfidence in literature. Moore and Healy (2008) differentiate overconfidence according to three sub-divisions. The three distinctions, overestimation, overreplacement, and overprecision, will be elaborated.
Behavioural Finance, as a sub-discipline of behavioural economics, widens the assump-tion of universal raassump-tionality by incorporating findings from psychology and sociology. It focuses on explaining the actual behaviour in contrast to the optimal behaviour prescribed by traditional finance models (Glaser et al., 2004). The traditional theories became more popular in the mid-eighteenth century (Pompian, 2011). In 1844 John Stuart Mill intro-duced the rational economic man or homo economicus, who maximize its satisfaction by given constraints (Morgan, 2006). Perfect rationality, perfect self-interest, and perfect in-formation are the underlying assumptions for this agent. The traditional financial frame-work has been derived from these assumptions (Pompian, 2011). Barberis and Thaler (2003) state that agents should update their existing knowledge with new information correctly and use this knowledge to maximize their satisfaction within the start of a ra-tional solution. Since the fallibility of human decisions is hardly considered, investors are assumed to be entirely rational and thus free of systematic biases (De Long, Shleifer, Summers & Waldmann, 1990). A central element of the traditional financial theories is the EMH which states that all available information is already reflected in asset prices. Information is available to all investors equally, and no one can outperform the market (Berk & DeMarzo, 2017). Hence, on an efficient market, price movements follow a ran-dom walk (Bodie, Kane & Marcus, 2018). No investment pattern can be identified, and
therefore a planned approach to investment cannot succeed. This paradigm is based on the notion that all investors are rational (Berk & DeMarzo, 2017).
In contrast to this, Herbert Simon introduced in 1947 the concept of bounded rationality, which is tailored to cognitively constrained agents; he thereby was the first to revise the notion of perfect rationality. Bounded rationality is supported by three restrictions on cognition on natural human behaviour: the "incompleteness of information; difficulty in anticipation of the consequences of future actions; and scarce knowledge of all possible human behaviours" (Cristofaro, 2017, p. 170). Simon (1955) sees his contributions as a marker between psychology and economics. In the late 1950s, a boom in research of bi-ases in human decision-making among researchers studying the effects in economic con-texts unfolded (De Neys, 2010). However, it was not before 1974, Tversky and Kahne-man pioneered with their work of heuristics and biases in judgment the research field behavioural economics and finance. Ackert, Church and Deaves (2003) built on their pre-vious work and state that the traditional financial paradigm needs to be questioned with new models which are not in line with the EMH. They claim that models based on the EMH only explain certain aspects of financial decision-making but fail to incorporate an essential element of human nature – emotions, which could improve decision making. The most common behavioural bias is the overconfidence effect (Barberis & Thaler, 2003). Also, according to De Bondt and Thaler (1995), one of the most solid findings in the psychology of judgment represents overconfidence as a judgment bias. Plous states in 1993 that overconfidence is the most problematic and terrible bias in judgment and decision-making. Overconfidence does not necessarily affect financial decision-making; it has also often been used to explain different situations. For example, Howard (1983) and Johnson (2004) see overconfidence as one of the causes of war. Overconfidence is also blamed as a cause for labour strikes, litigation (Neale & Bazerman, 1992), and high volumes in corporate mergers and acquisitions (Malmendier & Tate, 2005). Camerer and Lovallo investigate in 1999 that overconfidence has an essential impact on business and investments, which led to entrepreneurial failure. Hence, exposure to higher risk is often generalised as a proxy for overconfidence (Barber & Odean, 2001). A perceived higher level of expertise could form an explanation for overconfident behaviour. Further,
McKenzie et al. (1992) claim that experts and novices show equally overconfidence be-haviour, and Russo and Shoemaker (1992) even argue that experience possibly reduces overconfidence.
Instead of constantly putting overconfidence in a negative context as a bias to rational behaviour, precedent research also discusses the positive side of overconfidence. Gervais, Heaton, and Odean (2002) state that overconfident and optimistic behaviour in manage-rial positions could increase the firm's value. Overconfident as well as optimistic manag-ers often underestimate the risk of potential projects. Therefore, compared to risk-avmanag-erse rational managers, they are less likely to postpone deciding to enter an investment. In doing so, they are acting in the best interests of the shareholders. Koellinger, Minniti, and Schade (2007) find evidence suggesting that overconfidence in own skills and abilities often leads individuals to become entrepreneurs. This finding goes hand in hand with the results of Camerer and Lovallo (1999), who focus on excessive risk-taking and entrepre-neurial failures due to overconfidence. From this, a discussion could be initiated with one side condemning overconfidence and one the other side arguing that it is better if one acts optimistically and overconfident. Armor, Massey, and Sackett (2008) investigate the po-tential positive implications of overconfidence and find that people believe that the actual outcome benefits more from making optimistically biased rather than accurate predic-tions. Further, overconfidence leads to success in the business sense and increases sub-jective attractiveness (Murphy et al., 2015). Being self-confident is essential for success in many different areas, ranging from job performance and business to sports, health, and physical well-being (Kanter, 2004; Peterson, 2006; Taylor & Brown, 1994; Taylor, 1989). Russo and Shoemaker (1992) investigated 2,000 managers and find that fewer than 1% are not overconfident. Overconfidence does not have to be present initially; it can also build up through positive experiences of success. Hilary and Menzly (2006) dis-cover a consistency of their results with an attribution bias. The ability of analysts to forecast future earnings makes them even more overconfident after a successful event. Given the profundity and pervasive nature of overconfidence as a bias, there will always be a new situation in which the term overconfidence is used to explain or reason for all actions. Since 2000, there has been a seemingly recurring steady increase in interest and thus in publications of overconfidence in all areas (see Figure 1). ScienceDirect showed 7,090 results in a data-based search for the term "overconfidence" (ScienceDirect, 2021).
Source: own illustration (ScienceDirect, 2021)1
Figure 1: Increase of publications from 2000 to 2020
The different manifestations of the economy, especially the business and investment side, will be discussed. As mentioned before Glaser and Weber (2007) claim there is no exact definition of overconfidence. Overall, overconfidence in most of the literature is defined in three manifestations (Moore & Healy, 2008). The first distinction is the overestimating of one's true performance. Overestimation occurs, for example, when a student answers a test with 20 questions and assumes that 50% of the questions are answered correctly, but only 7 of the questions are answered correctly; he or she overestimated themselves. The second distinction is overplacement of one's performance in relation to others, also called the "better-than-average" effect, which means that people have unrealistic positive views about themselves (Taylor & Brown, 1988). This subdivision of overconfidence is the least empirically studied phenomenon. Early and essential studies created by Cross (1977), who discovers that most professors considered themselves teaching ability above average, and Svenson (1981), who shows that most of the college students in America and Sweden consider their driving ability to be above average and therefore claim to be safer drivers above the 50th percentile. However, the first empirical study was done by Codol (1975), who hypothesized that people believe that they adhere to desirable norms
1These statistics are not meaningful. Only one data platform was used, and non-relevant studies might
have been included or omitted. In addition, the year 2021 is not shown as it cannot be included as a whole year. 0 100 200 300 400 500 600 700 800 200020012002200320042005200620072008200920102011201220132014201520162017201820192020 Absolute numbers increase
more than others. The third distinction is excessive precision or overprecision in one's beliefs which can also be assigned as miscalibrations. This distinction refers to people's certainty about the accuracy of their beliefs or just their excessive idea that they know the truth. Commonly, researchers investigating overprecision use numerical solutions for their participant's questions. The participants then must estimate within 90% confidence intervals upper and lower bounds to general business knowledge (Glaser, Langer, Reynders & Weber, 2007). This measure is explained by a study from Lichtenstein, Fisch-hoff, and Phillips in 1977, which mainly deals with the fact that the probability distribu-tion of people is too tight when estimating uncertain quantities. These subdivisions, as mentioned earlier, are very close to those of Glaser et al. (2007). However, a distinction is not only made in the subdivision but also in the measurement. Nevertheless, some of the previously conducted studies failed to observe the classification of overconfidence and then resorted to different methodologies (Fellner & Krügel, 2012). This thesis will focus on the third subdivision - overprecision. One-third of the existing empirical studies, especially the paper by Glaser and Weber (2007), investigated overconfidence by using miscalibration.
Subdivision of overconfidence – overprecision (miscalibration)
Overprecision seems to be the most persistent of the three subdivisions of overconfidence (Moore & Healy, 2008). Many studies already used this measuring method, and therefore various election methods have been developed; however, they show different results (Budescu & Du, 2007). The calibration measures could be understood as the objective accuracy and the degree of compliance between subjective confidence. The two most famous measures are the interval estimate and the probability estimate. To measure mis-calibration with interval estimates, which is also called the fractile method, uncertain con-tinuous quantities are used.2 It represents the most similar measurement for overconfi-dence in economics, finance, and management (Glaser & Weber, 2010; Glaser et al., 2004). Glaser et al. (2013) even discover a new method to measure overconfidence with interval estimates. This method bases on the implied probability mass behind a specified
2"For example, studies that ask people to state a 90% confidence interval for several uncertain
quanti-ties find that the percentage of surprises, i.e., the percentage of true values that fall outside the confi-dence interval, are higher than 10%, the percentage of surprises of a perfectly calibrated person" (Gla-ser et al., 2004, p. 6).
prediction interval.3 Soll and Klayman (2004) made an even further differentiation; they differentiate into the range method, the two-point method, and the three-point method. In 1991 Keren states that by using the fractile method, the confidence intervals given by participants are too narrow. Lichtenstein et al. (1977), Budescu and Du (2007) and Tversky and Kahneman (1974) came to the same result. However, interval estimates are less studied than the direct probability estimates (Soll & Klayman, 2004). Direct proba-bility estimates of binary events can be subdivided into full-range or half-range methods (Budescu & Du, 2007). Budescu and Du (2007) address both ways. In the full-range method, judges (no further definition of judges is given) are asked to estimate probabili-ties that various statements are true on a scale from zero (undoubtedly false) to one (un-doubtedly true). In the half-range task, on the other hand, subjects are first asked to decide whether a particular statement is true and then assign a probability to this decision. The scale varies from 0.5 (random choice) and 1 (certainly true). Overconfidence can there-fore be indicated since the correct answers in both cases are mostly lower than the prob-ability assigned by the judges (Gigerenzer, Hoffrage & Kleinbölting, 1991). In the survey designed for this thesis, the degree of overconfidence is measured with miscalibration and thus the interval estimate method as it is the one most similar related to the aspect of overconfidence in business.
Source: own illustration
Figure 2: Miscalibration measurement methods
In the interval estimates method, overconfidence or underconfidence is determined by the rate of surprises which is the percentage of true responses that fall outside the
confidence intervals. The hit rate, contrary, represents the correct answers in percentage within the specified intervals. Therefore, the surprise rate should be less than 10% if a well-calibrated person is expected to have a hit rate close to the target 90% level. How-ever, previously conducted studies such as Glaser, Langer, and Weber (2013) show over 70%. A disadvantage of the fractile method is that the direct probability estimates lead to much better calibration of judges; this is called "format dependence" (Juslin, Wennerholm & Olsson, 1999). Nevertheless, miscalibration in interval estimates is used as this "is most closely related to the facet of overconfidence that is modelled in economics, finance, and management" (Glaser et al., 2013, p. 405). Glaser et al. (2007) find that in stock market forecasts, when subjects are asked to estimate returns compared to price forecasts, vola-tility estimates are lower. Also, Budescu and Du (2007) notice that overconfidence in participants' future stock price estimates is most pronounced when participants are asked to provide 90% confidence intervals. Thus, it depends on whether subjects are questioned for price or return forecasts. And therefore, the overconfidence bias depends significantly on this. In addition, an increase in overconfidence is documented with an increasing fore-cast horizon (Glaser, Langer & Weber, 2005).
Also, the amount of information participants provide seems to influence the degree of overconfidence. Tsai, Klayman, and Hastie (2008) claim that with the information con-tent increase of judges, their confidence increases rather than their accuracy. This leads to significant discrepancies between these two factors. Further, expertise seems to affect overconfidence. Glaser and Weber (2010) state that it is hard to answer whether the strength of professionals' bias is comparable to that of non-professionals. Nevertheless, financial knowledge is described as beneficial to improve behaviour and reduce bias in tasks. Task difficulty also seems to influence the degree of overconfidence. The discovery of the "hard-easy" effect contains in various studies. Soll (1996) employing direct prob-ability estimates, and Lichtenstein and Fischhoff (1977) argue that under the "hard-easy" effect, they found that more complex tasks led to a higher degree of overconfidence vice versa for more manageable tasks or even underconfidence.
2.2. Overconfidence and trading volume
Trading volumes increase significantly during the year 2020 (Ortmann et al., 2020). The Deutsche Börse Frankfurt stock exchange shows €1.4 trillion trading volume in the year 2020 compared to 2019 (€1.2 trillion) a significant increase can be seen (Deutsche Börse
Frankfurt, 2021). An increase in trading volume (see figure 3) in financial markets could be the most contradicting observation for the financial paradigm (De Bondt & Thaler, 1995). Glaser and Weber (2007) state that rational thinking heterogeneous investors can only justify certain parts of the large trading volume. Barberis and Thaler (2003) argue extensive trading is attributable to one of the most common behavioural biases: overcon-fidence. Glaser et al. (2004) research studies in economics and finance that are known to show a correlation between psychological data (including measures of overconfidence) and economic variables (including trade volume). Fenton‐O'Creevy, Nicholson, Soane, and Willman (2003) use data on the behaviour of professional traders and thereby succeed in empirically analysing the relationship between psychological and economic variables. Several empirical studies investigate the effect of overconfidence on market efficiency. A central claim is that overconfident investors in financial markets generate high trading volumes and thus disrupt market efficiency (De Bondt & Thaler, 1995). Moreover, ex-tensive empirical studies show that higher risks are taken by more overconfident inves-tors, which leads to lower average returns due to extensive trading volumes (Barber & Odean, 2000). Berk and DeMarzo state in 2017 that overconfident traders feel that their information is sufficient to justify a trade even though it is not. In this turn, the overcon-fident trader is revealed to trade more, and the transaction costs will ultimately lead to a worse result compared to a trader who is not overconfident and trades less (Barber & Odean, 2000). Overconfident investors perceive their abilities to be superior to others; that's why they commonly take bold decisions and trade actively while underestimating the risk associated with active investment strategy (Kyle & Wang, 1997; Odean, 1998). Studies typically use excessive trading and exposure to higher risk as proxies for over-confidence (Barber & Odean, 2000; Barber & Odean, 2001; Odean, 1999).
Overconfidence is the most important behavioural factor needed to understand the high trading puzzle (De Bondt & Thaler, 1995). Odean (1998) finds that a higher level of over-confidence leads to a higher trading volume, which he states as the most powerful impact of overconfidence. The hypothesis of whether overconfidence leads to higher trading vol-ume is likewise tested by Statman, Thorley, and Vorkink (2006) for the US market. They claim that high returns lead to higher trading volume because success with investments leads to higher levels of investor overconfidence. Also, Glaser et al. (2005) find that over-confidence is higher among professionals than in the respective non-professionals. Glaser
and Weber (2007) see an increase in trading among investors who consider themselves to be above average in their investment capabilities or past performance; however, those investors did not perform above average in their past. Their study uses several measures to test the influence of overconfidence on trading volume, including the miscalibration measure and the "better-than-average" effect. They can only show that overconfidence leads to higher trading volume with the "better-than-average" effect. Thereby it is crucial to mention that the empirical evidence between miscalibration and trading volume has not yet been empirically tested too often (Glaser & Weber, 2007); although miscalibration is the most closely related method to the aspect of overconfidence in business (Glaser et al., 2004; Glaser et al., 2013; Glaser & Weber, 2010). The miscalibration measure shows a significant negative correlation (Glaser & Weber, 2007). It is important to mention that many discoveries are consistent with those of Glaser and Weber (2007). Oberlechner and Osler (2008) support the hypothesis from Friedman (1953), which states that traders who behave irrational and therefore trade losses will be driven out of financial markets. Con-trary, they find that those traders are not forced out of the market but find evidence that currency dealers are more overconfident than traders of other security classes. Graham, Harvey, and Huang's (2009) study contribute to a better understanding of the theoretical relationship between overconfidence and trading volume. They focus primarily on the "better-than-average" aspect of overconfidence, leading to higher trading frequency. They find that more internationally diversified portfolios with higher trading turnover are often held by investors who feel more competent than others.
Graham et al. (2009) discover that investors who hold smaller portfolios or have a lower education and female investors are less likely to perceive themselves as competent than investors with more extensive portfolios or higher education and male investors. Barber and Odean (2001) find similar results. They use gender as a proxy for overconfidence in their study. In their paper, they investigate a sample of US online broker investors. They notice that men have a higher level of overconfidence than women and trade more than women, which matches several overconfidence models. Also, Menkhoff, Schmeling, and Schmidt (2013) state that the influence on overconfidence behaviour decreases within an increasing age. Furthermore, they also conclude that there is a potential among younger investors with increasing experience to give wider confidence intervals and increase over-confidence. Contrary to Begru (2016), Fellner-Röhling and Krügel (2014), and Deaves,
Lüders and Luo (2009) test if trading behaviour or profit generation is gender-related. None of them could find any significant evidence.
Study by Country and Data Results and Findings Method
Barber and Odean (2001)
US; 35,000 house-holds
Men are more overcon-fident (especially single men)
Account data from households; fre-quency of trading as a measure of overcon-fidence
Glaser and Weber (2007)
Germany; 215 pri-vate investors
Investors who assign themselves to be better than average trade more than others
Survey investigation including miscalibra-tion through estimat-ing 90% confidence intervals
Odean (1998) US; 10,000 broker-age customer ac-counts
Higher level of over-confidence leads to a higher trading volume
Panel regression
Statman et al. (2006) US; market level High returns lead to higher trading volume because success with in-vestments leads to higher levels of investor overconfidence
VAR and associated impulse response functions
Glaser et al. (2005) Germany; 123 pro-fessionals and 66 students
Degree of overconfi-dence is higher among professionals than non-professionals
Calibration measure through confidence interval estimation Graham et al. (2009) US; 1,000
respond-ents
Investors with smaller portfolios or lower edu-cation, and female in-vestors are less likely to perceive themselves as competent
Interviews (demo-graphic factors) and frequency of trading are analysed
Russo and Shoe-maker (1992)
US; 2,000 individ-uals
Experience possibly re-duces overconfidence
Quiz for participants Menkhoff et al.
(2010)
Europe; 496 pri-vate investors; data collection 2004
Miscalibration measure shows that with increas-ing age overconfidence behaviour decreases and younger investors with increasing experience give wider confidence intervals while the op-posite is shown by unre-alistic positive self- evaluation
Survey (better than average, miscalibra-tion, and illusion of control) Budescu and Du (2007) US; 63 graduated accounting stu-dents (experiment 1), 75
undergradu-Direct probability esti-mates can be subdivided in full-range or half-range methods; over-confidence in partici-pants' future stock price
Miscalibration meas-ure (stock price fore-cast)
ate business stu-dents (experiment 2)
estimates was most pro-nounced when partici-pants were asked to pro-vide 90% confidence intervals
Fellner and Krügel (2012)
Germany; 168 stu-dents
Men trade more than women; investors with higher overconfidence tend to trade more
Miscalibration meure; experimental as-set markets
Source: own illustration
Table 1: Summary of previous studies – overconfidence and trading volume
3. COVID-19 crisis and trading volume
Since news of a novel virus began circulating in January 2020, the virus has cost many lives and is causing ongoing damage to economies around the world (Fernandez-Perez, Gilbert, Indriawan & Nguyen, 2021). Although COVID-19 has emerged in almost all countries, the responses to the crisis are very different. While most countries, including Germany, rely on hard restrictions such as lockdowns, Sweden has imposed few social restrictions (Fernandez-Perez et al., 2021). However, COVID-19 has significant eco-nomic implications due to the virus's high risk of contagion (Zaremba, Kizys, Aharon & Demir, 2020; Zhang, Hu & Ji, 2020). Supply chain and production disruptions, labour restrictions, flights, and general travel restrictions, reduced consumer spending and sen-timent, temporarily closed businesses and schools and a general ban on events all have a negative impact on companies' financial performance (Burgmeier, Langlois & Wester-lund, 2020; Debell & Kalidas, 2020). These impacts were also observed on the capital markets.
There is already a rapidly increasing literature on the impact of COVID-19 on the stock market (e.g., Baker et al., 2020; Gormsen & Koijen, 2020; Yilmazkuday, 2020). Yil-mazkuday (2020) examines the impact of the number of COVID-19 deaths on the S&P 500. Baker et al. (2020) investigate the impact of COVID-19-related news on stock mar-ket volatility and report that COVID-19 had a much higher impact on stock marmar-ket vola-tility than other similar diseases. Zhang et al. (2020) find evidence that the pandemic has a significant impact on global capital markets as the pandemic has created a high risk and investors have suffered serious losses in a short period (Zhang et al., 2020). Following the announcement by the WHO to declare COVID-19 as a pandemic in March 2020, the
global financial market began to plummet. Hence, there was striking volatility observed in March 2020 (Bansal, 2020). While the S&P 500 still had reached a peak of 3,386 points on February 19th, 2020, the price dropped to 2,237 points on March 23rd, 2020. This development reflects into a 34% drop (Zhang et al., 2020). Onali (2020) conclude that infection and death rates associated with COVID-19, have leverage on the volatility of the Dow Jones and S&P 500. In the ten countries that were most affected by COVID-19, an increase of over 25% in the risk level (deviation of daily returns) was observed. How-ever, the US market showed the strongest increase in volatility as it was in March four times greater than in February. By comparison (Zhang et al., 2020), China had the highest volatility in February and the lowest in March. Consequently, the evidence shows that risk in financial markets has increased significantly due to COVID-19. Nevertheless, the reaction of the financial markets in the respective countries varies and depends on the intensity of the outbreak. Across all markets, the expectation regarding the pandemic and the associated economic losses have made markets very volatile and unpredictable (Zhang et al., 2020).
However, Gormsen and Koijen (2020) argue that it is not a change in the long-term ex-pectations in the markets that are responsible for the observed elevated market volatility, and Zhang et al. (2020) find that there are emotional factors that have a major impact. The emotional factors can be amplified by social media with impulses from COVID-19 news leading to significant price movements on the stock market (Broadstock & Zhang, 2019). The notion that elevated market volatility from COVID-19 also stems from emo-tional factors and not only from changes in expectations can be backed by behavioural finance research. For example, Benos (1998) is able to show that overconfidence contrib-utes to greater volatility in financial markets. More recently and in light of COVID-19 related research, Espinosa-Méndez and Arias (2021) note a rise in herd behaviour in terms of returns, volatility, and trading volume during the pandemic. A potential explanation for increased irrational behaviour could be the appearance of new market participants. In the US, a considerable increase in small investors, the so-called "Robin Hood traders", could be observed. These are usually young, inexperienced private investors who have entered the capital market during the pandemic (Fritzgerald, 2020). The increase in this type of investors could be related to the expectation by US households that the stock market will recover faster than in previous crashes despite the notable global financial
market decline and increased financial market risks due to the COVID-19 outbreak (Chiah & Zhong, 2020; Hanspal, Weber & Wohlfart, 2020). Further, Bansal (2020) notes that investors have been very optimistic on growth forecasts around the world, despite they observed the crisis in many other countries. Investors traded neither gold nor risky investments such as cryptocurrency, but equities and index positions (Ortmann et al., 2020). Ortmann et al. (2020) further note that men and older investors traded more inten-sively. It is important to mention that some investors take long positions in equities and indexes, while others take short positions. Therefore, the disequilibrium in the market is almost zero. The reason for this is that some investors believe that it is a good opportunity to enter the stock market during the lockdown and invest in long positions because they are counting on a quick recovery of the economy after the pandemic has subsided. How-ever, there are also investors who see this sight too optimistically and therefore take short positions. Moreover, easing programs can also lead to differences between short- and long-term expectations across investors (Gormsen & Koijen, 2020), which can also lead to ambiguous investor behaviour. Kumar (2009) and Gao and Lin (2015) assume that some investors use the stock market as an instrument for gambling – so-called substitution hypothesis. In times of pandemic, casinos and other gambling facilities are closed. There-fore, it is likely that the COVID-19 outbreak is related to an increase in the volume of trading in stocks as a replacement for gambling. (Chiah & Zhong, 2020).
In their comprehensive study Chiah and Zhong (2020) examine the global impact of the pandemic on trading volume in the stock markets. They find that trading activity meas-ured by stock turnover increased significantly during the pandemic. Their results are con-sistent with the substitution hypothesis as they observe a stronger increase in trade volume in countries with more extensive gambling opportunities (Chiah & Zhong, 2020). They further examine the trading activities in economically stronger developed and emerging countries. Chiah and Zhong (2020) also investigate the trading frequency in nations that enjoy a little and great trust among citizens. Hence, these points will be discussed in more detail in the next paragraph. Besides, Ortmann et al. (2020) also notice that investors' trading activity increases during the COVID-19 breakout. They find that the number of accounts opened by investors with brokers increased and that trading activity in existing accounts also increased. With the doubling of COVID-19 cases, investors increased their weekly average trading activity by 13.9%. Chiah and Zhong (2020) use the daily trading
volume of the global stock market between January 2019 and May 2020 in their study to examine 37 countries for a daily stock turnover during COVID-19, which provides insight into trading activity. They find that the average daily stock turnover was 0.24%. This result is consistent with the international evidence in Griffin, Nardari and Stulz (2007), who also note a positive daily turnover in the capital market. In addition, they determine that daily turnover is also higher in countries with higher GDP, which is also consistent with Griffin et al. (2007). For example, when comparing daily turnover before and during the pandemic, they observe that Australia's average daily turnover before COVID-19 is 0.27% and during COVID-19 it is 0.44%. In the overall observation, they state that the turnover during the pandemic is higher than before, which is statistically significant. Thus, Chiah and Zhong (2020) provide initial evidence that trading was generally more intense during the pandemic.
In their main findings, Chiah and Zhong (2020) document increased equity trading activ-ity around the world during the pandemic. The effect remains still robust when controlling for country-specific macroeconomic indicators. The increase in trading activity is more pronounced in markets with better corporate governance and legal systems. This result suggests that investors in better institutional environments are more willing to take risks and trade. This is consistent with precedent literature stating that trust and stock market involvement have a positive relationship (Guiso, Sapienza & Zingales, 2008). Investors in wealthier countries also tend to trade more during the pandemic. In other words, in financially strong countries investors are more willing to invest their savings in the stock markets during the pandemic (Chiah & Zhong, 2020). Furthermore, Chiah and Zhong (2020) document that investors turn to stock markets as a substitute for gambling. Trading activity increases more intensely during the pandemic in markets with larger gambling opportunities. While traditional gambling is restricted by taxes because it is considered wrong in social life, the result also represents important policy conclusions, as these re-strictions only apply to financial markets to a certain extent. In terms of cultural dimen-sions, the volume of trade increases more (less) during the pandemic in countries with higher (lower) levels of trust and individualism (uncertainty avoidance). In his paper, Onali (2020) examines the relationship between COVID-19 deaths and trading volume. He concludes that the deaths in the US and UK lead to a reduction in trading volume. Takahashi and Yamada (2021) look at the investment of foreign investors in the Japanese
stock market during the COVID-19 shock. They observe that in the third week of March, investors sold their positions, which led to a negative trading volume. Investors acted due to real economic disruptions such as supply chains and consumption and withdrew their capital market investments. This led to negative interest rates, larger deviations, and higher trading volumes (Harjoto, Rossi, Lee & Sergi, 2020).
Considering the development that there is elevated market volatility which indicates to be attributable to emotional factors, the appearance of new market participants with very distinct beliefs and motivations and high trading volumes – a measure already used in the past as a proxy for irrational behaviour and in particular overconfidence – it would add to current behavioural finance research to examine the impact of overconfidence on trad-ing volume durtrad-ing the pandemic. However, none of the existtrad-ing research goes down this path. Bouteska and Regaieg (2018) find that the overconfidence bias, has a significant impact on trading volume during crises. According to them the overconfidence of inves-tors represents the optimism that influences the stock market in a positive way. Therefore, they argue that investors tend to be overconfident, which outweighs their preference to avoid losses. As a result, the market moves away from a normal state. Bouteska and Re-gaieg (2018) publish their research before the pandemic. Hence, it would be interesting to test their findings for trading data from 2020 and 2021. However, Glaser and Weber (2005) state that after a one-time crisis respectively the terrorist attacks of September 11th, 2001, investors adjusted their forecasts and no longer underestimated the volatility of stock returns as much as the control group before the event, which led to a reduction in overconfidence. Consistent with these findings, Bu, Hanspal, Liao and Liu (2020) find that Chinese students were less willing to take risks during the COVID-19 crisis. There-fore, they were pessimistic about the economy and made fewer risky investments. How-ever, Bu et al. (2020) do not set their findings in the context of precedent research on overconfidence.
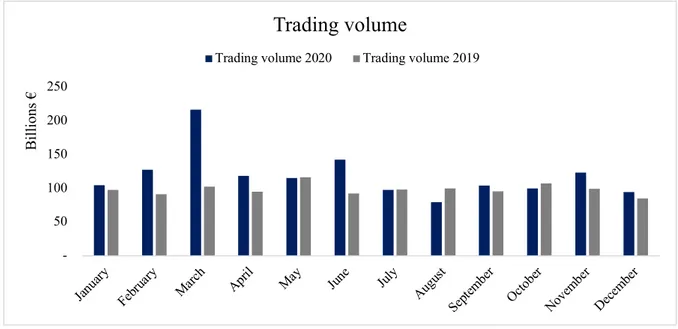
Figure 3 presents the trading volume in 2019 compared to 2020 derived from Deutsche Börse. Deutsche Börse is one of the largest securities platforms in the world. It serves as a trading platform for shares and other securities, providing access to the global capital market for every company and every investor. Deutsche Börse is the largest securities exchange in Germany, accounting for around 90% of turnover. Therefore, it is able to show trading activities in Germany, which we analysed data from it.
Source: own illustration (Deutsche Börse, 2021)
Figure 3: Trading volume of Deutsche Börse Cash Market (in EUR)
Looking at the trading volume of Germany, it is noticeable that the trading volume has increased compared to the year 2019. Especially, in March, the trading volume was with a peak over 200 billion euros, which increased, compared to the year 2019 where the peak was only at 100 billion euros. Only in May and July the volume was almost the same. In August and October, the numbers were lower. This could be attributable to the fact that the security markets were recovering as lockdowns were easing and businesses opening. These findings are also consistent with the prevailing COVID-19 literature. On the one hand, the peak in March may be consistent with the argument of Takahashi and Yamada (2021) and Ortmann et al. (2020) that investors and retail investors increased their selling due to the uncertainties of the upcoming economic development. On the other hand, the peak can be explained with investors seeing an opportunity to enter financial markets at low price levels (Hanspal et al., 2020). Applying Chiah and Zhong's results (2020) it could be argued that increase in trading was supported by Germany's status as a wealthy and economically strong country. Further, the restraints for German casinos could have attracted risk-tolerant investors who see the stock market as a substitute for gambling.
50 100 150 200 250 Janua ry Febr uary March April May June July Augu st Septe mbe r Octobe r Nove mbe r Dece mbe r Bi lli on s €
Trading volume
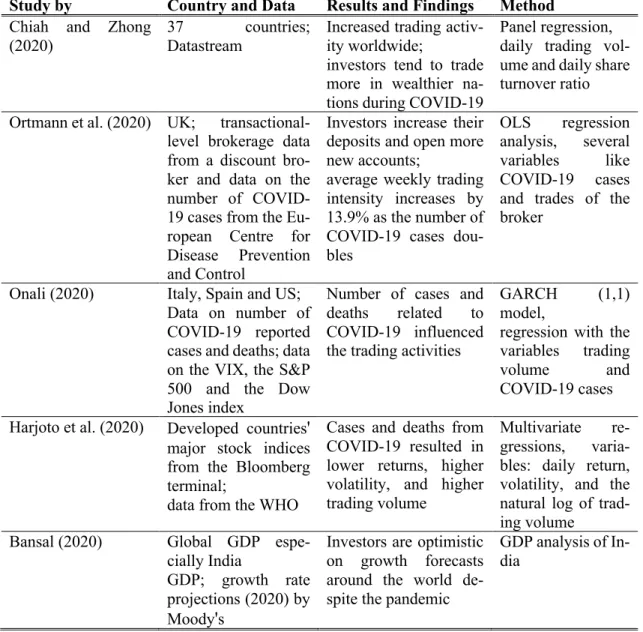
Study by Country and Data Results and Findings Method Chiah and Zhong
(2020)
37 countries;
Datastream
Increased trading activ-ity worldwide;
investors tend to trade more in wealthier na-tions during COVID-19
Panel regression, daily trading vol-ume and daily share turnover ratio Ortmann et al. (2020) UK;
transactional-level brokerage data from a discount bro-ker and data on the number of COVID-19 cases from the Eu-ropean Centre for Disease Prevention and Control
Investors increase their deposits and open more new accounts;
average weekly trading intensity increases by 13.9% as the number of COVID-19 cases dou-bles
OLS regression analysis, several variables like COVID-19 cases and trades of the broker
Onali (2020) Italy, Spain and US; Data on number of COVID-19 reported cases and deaths; data on the VIX, the S&P 500 and the Dow Jones index
Number of cases and deaths related to COVID-19 influenced the trading activities
GARCH (1,1)
model,
regression with the variables trading
volume and
COVID-19 cases Harjoto et al. (2020) Developed countries'
major stock indices from the Bloomberg terminal;
data from the WHO
Cases and deaths from COVID-19 resulted in lower returns, higher volatility, and higher trading volume
Multivariate re-gressions, varia-bles: daily return, volatility, and the natural log of trad-ing volume
Bansal (2020) Global GDP espe-cially India
GDP; growth rate projections (2020) by Moody's
Investors are optimistic on growth forecasts around the world de-spite the pandemic
GDP analysis of In-dia
Source: own illustration
Table 2: Summary of previous studies – COVID-19 and trading volume
4. New discovery and hypotheses
The theoretical background and literature review on overconfidence and trading volume and the recent papers on trading volume and COVID-19 serve as a basis, inspiration, and call for new discoveries for this thesis. However, none of the existing papers measures overconfidence as a bias and analyses its impact on trading volume with the background of 19. Although the latest research does show results on the impact of COVID-19 on trading volume and the impact of overconfidence on trading volume, no paper combines the two. Further, the survey design used for this thesis is unique. The first two
parts of the survey were testing for overconfidence; the third part asked for information about their trading volume during COVID-19. Also, instead of questioning retail inves-tors with many years of trading expertise, retail invesinves-tors with varying levels of trading experiences, ages, and professions were surveyed. This diversity allows the thesis results to receive an overall view of the relationship between overconfidence, trading volume, and COVID-19 for all kinds of different retail investors. To investigate this connection, we are testing three hypotheses in the following.
Glaser and Weber (2007) state a significant impact of overconfidence on trading volume in general. Hence, this paper will first investigate the impact of overconfidence on trading volume not in general but during COVID-19.
H1: 2020 shows an increase of younger and inexperienced traders that are more over-confident on average than experienced traders.
Most recent authors like Chiah and Zhong (2020) and Ortmann et al. (2020) state that trading volume increased significantly during the pandemic and that new accounts were opened. As overconfidence leads to an increased trading volume and the trading volume increased during the pandemic, it could indicate a significant positive correlation between overconfidence, trading volume, and COVID-19. Chiah and Zhong (2020) state that more young and inexperienced traders entered the trading market during COVID-19. Menkhoff et al. (2013) find evidence that there is potential among younger investors to be more overconfident. Examining the relationship between the level of expertise and overconfi-dence could give important insides as lots of studies find disparate results on this, as mentioned in chapter 2. To examine this hypothesis, an evaluation is constructed with all retail investors who only have one year of trading experience (all those who started trad-ing in 2020). Subsequently, the degree of overconfidence is determined and compared to those who started trading before 2020.
H2: Retail investors with trading experience of more than two years have significantly increased their trading volume during COVID-19.
Aside from testing whether the increase in trading volumes during 2020 came from young and inexperienced traders, this thesis also aims to investigate the contribution from
exist-ing traders (Chiah & Zhong, 2020). Also, recent COVID-19 papers argue that older in-vestors increased their trading activity during COVID-19 (Ortmann et al., 2020). For ex-amining the hypothesis, participants with no experience and participants who started trad-ing durtrad-ing COVID-19 are excluded. Two years of tradtrad-ing guarantees experience are needed to test the hypothesis. The survey includes the fraction of money as a percentage, investors have traded during the COVID-19 compared to their previous trading experi-ence. This is analysed with a statistical test to see if and how much more they have traded.
H3: COVID-19 positively influenced the increase of trading among investors who assign themselves above average within their investment skills.
Glaser and Weber (2007) state that investors who consider themselves to be above aver-age in their level of expertise and thereby in their investment experience trade more. Chiah and Zhong (2020) and Ortmann et al. (2020) support this hypothesis as they claim that trading volume increases significantly during the pandemic. In addition, Bansal (2020) notes that investors have been very optimistic about growth forecasts worldwide, despite observing the crisis in many other countries and therefore traded more. This paper contributes to current research as it introduces a new factor into the observed positive relationship of trading volume and investment skills, namely investor confidence. Based on the participants' self-assessment of their level of expertise, dividing the participants into two groups is possible. Subsequently, a statistical test is carried out to investigate whether the trading volume increased more for those who assign themselves as more ex-perienced.
5. Methodology
5.1. Sample and Data Collection
We have chosen a quantitative research method for our work because we are looking for significant statistical correlation in our generated data. To show the relationship between overconfidence and trading volume, either an experiment or a survey can serve to gain new insights (Deaves et al., 2009). Thus, to obtain empirical data, a survey was used in this thesis.
The survey was conducted and created as an online questionnaire in the English language via Qualtrics. The full version was used without any limitations of the tools. Three dif-ferent areas had to be answered. The average response time was 11 minutes. If the survey was started but not finished, it was moved from the running responses to the recorded responses after a while. This process ensured that each participant had enough time to complete the survey even with possible interruption. However, the surveys which ex-ceeded a certain time were marked with "false" and not included in the evaluation. Before the online questionnaire went online, a total of eight test runs were conducted by col-leagues and us. This test should eliminate possible errors and incomprehensibility. It should guarantee a smooth process and lead to an efficient survey experience. The trial runs were not included in the final number of surveys completed. The participants could take part via a web link, and it was possible to answer the study via cell phone, tablet, or computer. The link was first sent to colleagues and family members and then shared on the social media platform LinkedIn.
The release was on March 1st, 2021, and it was possible to participate in the survey for a total duration of three weeks. On the release date the link was only sent to family members and closer friends via social media like WhatsApp. Each participant was contacted indi-vidually with a direct message. After the first week, we already had 53 recorded and complete responses. On March 8th of 2021, the link was sent to fellow students from the University of Hohenheim and the Ludwig-Maximillian-University of Munich. The link was also shared in the group of TU-Investment Club of the Technical University of Mu-nich. After the second week, we had gained 30 more participants. In the third week, on March 15th, 2021, the link was published on the social media platform LinkedIn, which helped us to get a total of 111 completed surveys; the collection phase ended on March 22nd, 2021.
Source: own illustration
To ensure that all surveys are filled out completely, we have marked all questions as mandatory. Above all, it was necessary to confirm the GDPR rules to give a signature to use the data and publish them in our work officially. In total, 199 participants have opened the survey. By subtracting eight surveys for the test run and the 111 completed surveys, 80 participants remained who were additionally interested in taking part in the survey. The reason for the incomplete participation is divided into several areas. On the one hand, the language barrier could have been a reason as the survey was sent to mainly German participants but was designed in English. On the other hand, it could have been the lack of knowledge in the general and financial area. With the introduction, participants without trading experience should have sorted themselves out.
5.2. Survey Design
After participants clicked on the invitation link, the first part of the survey began with an introduction. Figure 5 shows the structure of the survey. The online questionnaire was divided into four different parts. It started with a short introduction and ended with the GDPR's and a signature, which had to be confirmed and provided by the participants. The introduction of the questionnaire was designed to explain the purpose and the tasks of this study. It should have pointed out that the participant, in the best case, has traded before and during COVID-19. In addition, the participants were informed that the survey is ex-pected to take 10 minutes. The aim of the thesis was introduced as trying to measure the phenomena of overconfidence in different ways and relate it to trading volume during COVID-19. This goal was intentionally not described precisely to prevent participants from possibly adjusting their behaviour or change. To ensure that the interval method is understood correctly, there was an additional example of the first part of the general knowledge questions. This showed how the question could be answered without steering the participant in one direction. In addition, it was explicitly stated in the introduction that tools such as Google should not be used to avoid falsification and thus render the survey useless.
Source: own illustration
Figure 5: Structure of the survey
In the prevailing literature, no broad definition for overconfidence exists (Glaser & We-ber, 2007). The degree of overconfidence in this survey was measured by using miscali-bration and thus the interval estimate method. In Part 1, the general knowledge questions, participants were questioned to provide within 90% confidence intervals upper and lower bounds. This is a widely used way to measure miscalibration (Biais, Hilton, Mazurier & Pouget, 2005; Cesarini, Sandewall & Johannesson, 2006; Klayman, Soll, González-Val-lejo & Barlas, 1999; Soll & Klayman, 2004). A total of four of these general questions were asked, so this part took almost 17% of the entire survey. Only four questions were created to maintain the participant's attention span. The number of questions was still sufficient to obtain valuable data. Figure 6 shows the structure and style of the general knowledge questions (find all general knowledge questions in the appendix). Two of the four questions had no context with economics, but good basic knowledge and understand-ing of economics were beneficial for the last two questions. We tried to vary within the questions to avoid any discrimination. Our study asked participants to provide a 90% confidence interval for several knowledge questions that needed a numerical answer. This determines the percentage of surprises. The detection of overconfidence is captured using this calibration index (rate of surprise). The number of this index is calculated for each participant. A rate of surprises of 1 reflects a well-calibration, 0 reflects underconfidence and values from 2 to 4 overconfidence. With the rate of surprises given by all participants, the individual calibration score is determined.
Source: own illustration
Figure 6: General knowledge questions
Part 2 consisted of six questions on stock price forecasts. Methodologically, they were structured in the same way as the general knowledge questions in part 1 but measured overconfidence in a different domain. As mentioned earlier in the literature section, it is helpful to measure overconfidence in different ways. This gives us a more robust measure of overconfidence, allowing us to compare our studies with earlier studies, e.g., Glaser and Weber (2007). It was good to have a basic knowledge of finance. Nevertheless, it was also possible to answer these questions intuitively without prior knowledge in trading or a lack of financial literacy. In the first three questions, participants were questioned to predict stock prices forecast from three graphs. For the graphs, we have used actual stock price values of the companies Daimler, Tesla, and Wirecard from the year 2020. The names of the companies were not mentioned but were given random letters A, B, D (find all graphs in the appendix). The unknown nature of the companies shown in the graphs was intended to prevent experts in the finance area from having an advantage, and thus from distorting the results.
Source: own illustration
Figure 7: Stock price forecast - question type 1
Figure 7 shows the questions of type 1 of the stock price forecasts. In all three questions, different time intervals were deliberately chosen. The first question had an interval from the middle of the month to the end of the month. The second question's interval ranges from the middle of the year to the end of the year, and the third question's interval, from week 20 to week 40 (random weeks).
Source: own illustration
Figure 8: Stock price forecast - question type 2
For the questions of type 2 in part 2, as shown in Figure 8, the actual stock price forecast had to be given by unknown stock prices. For this purpose, however, no graphs were given, but the companies Daimler, Tesla, and SAP were listed with their current stock prices from the 26th of February 2021. Then, participants had to predict the stock prices for the 31st of March in 2021. These different periods were chosen to determine whether the degree of overconfidence changes by changing the length of the period for the pre-diction of share price.
In this survey, actual companies were intentionally chosen because researchers such as Gigerenzer et al. (1991) claim that overconfidence is partly an experimentally induced artefact of non-representative items, which is the issue attempted to be addressed. When using stock price forecast to collect data for overconfidence, measurement is possible in different ways. The assignment for this task made it clear to participants that the all-time series cannot be related to price movements of actual stocks; it was impossible to detect price patterns of real assets. Thus, participants' discipline-specific knowledge of real-asset market trends should not impact the calibration measurement. For simplicity, this study uses the Fellner and Krügel (2012) measure that accompanies the first part of the general knowledge question. The sum of the cases in which the stock's actual value was outside the interval specified by the participant was used to calculate the calibration index. As
Glaser and Weber (2007) state, investors with overconfident behaviour often underesti-mate the riskiness of an asset or overestiunderesti-mate its accuracy, which leads to confidence intervals that are too tight. We have used confidence intervals of 90% to discover if our occasions are in line with this statement. As in Part 1, overconfidence in stock price fore-cast is captured by a calibration index. For each subject, the number of cases in which the actual value at the end of the period was outside the specified interval is calculated. An index of 1 again indicates good calibration, 0 reflects underconfidence, and values from 2 to 6 overconfidence.4 The selected stocks are real and randomly selected, thus circum-venting the problem of a potentially unrepresentative selection of Part 1. The graphs and future predictions of the stocks were presented to the participants in randomised order. To ensure that participants were attentive to the changes in the price range and not make it too confusing, we decided to use partially uniform scales. This was conducted because participant's perception of the variability of the respective time series can be significantly influenced by scales (Lawrence & O'Connor, 1993). Since there were six forecasts in part 2, each with three graphs in type 1 and three future predictions in type 2, pairs were formed using the same scale. The lowest ranking of the pairs was 40-70, then one pair was in the middle range with 120-160, and the last pair was in the upper range with 400-700.
The Cronbach's alpha, which Lee Cronbach developed in 1951, measures' reliability or internal consistency of multiple questions. Reliability is a characterisation of test proce-dures and comprises the true test values, the observed values, and the measurement er-ror. Therefore, it investigates how closely related a set of test questions are as a group. Cronbach's alpha can assume values between - ∞ and 1. This measure is calculated for part 1 and part 2.
In part 3, the participants were asked eleven questions about their trading behaviour dur-ing COVID-19. In the well-known literature, authors like Glaser and Weber (2007) and Deaves et al. (2009) have obtained data from brokerage to measure trading volume. Gla-ser and Weber (2007) calculate the trades of the investors. This results in the following dimensions: the number of stock market transactions, the number of stock market pur-chases, and the mean monthly stock portfolio turnover. For our study, we asked specific
4Another measurement method would be that of Glaser et al. (2013). They also use the method of
Pearson and Tukey (1965) to estimate return volatility but before transforming the individual price forecasts into returns.