EFO705
Master Thesis
Effective Media Channels Evaluation
A case study of Toyota‟s Intermediate Cars
Mälardalen University
MIMA International Marketing Program
School of Sustainable Development of Society and Technology
GROUP 2195
Authors: Feng Wang--19840908
Ren Xie--19840707
Tutor: Konstantin Lampou
Date: 05/27/2009
Abstract
Date: 2009-5-27Course: EFO705 Master Thesis
Authors: Ren Xie Feng Wang
rxe08001@student.mdh.se fwg08002@student.mdh.se
Tutor: Konstantin Lampou
Program: M.S International Marketing
Title: Evaluate effective medium for the promotion of Toyota‟s intermediate cars Problem
For promoting Toyota‟s intermediate cars, which media channels and specific media vehicles are the most effective ones?
Purpose
The aim of this project is to investigate the characteristics of Chinese people who are the target customers and the potential ones for intermediate cars of Toyota, as well as evaluate the effectiveness of different media channels for Toyota. Our ultimate goal is to give some suggestion for Toyota to select the effective media for their intermediate cars in China.
Method
The findings are based on the primary sources consisting of questionnaires which are post on autohome.com website and the secondary sources are consisting of dissertations in Mälardalen University, reference books, articles and journals. So the research question is answered.
Conclusion
In the conclusion part, we will summary the evaluation of the six main medium. And we draw our conclusion like this, Toyota should pay a great attention to this approach, spend certain effort on newspaper and magazine, while choose a targeted strategy to enter the fields of Internet and outdoor, and radio, we find it is not an ideal media for Toyota to promote.
Acknowledgement
Over the period of conducting this paper, we have met lots of constraints and difficulties. Without the assistance, we would never accomplish this thesis. Therefore, we would like to dedicate this acknowledgement page for those that have contributed to our dissertation.
First of all, we would like to thank our project adviser, Konstantin Lampou, for being so generously instructive all along the semester. Secondly, we express gratitude for our main and side opponents for their valuable and kind suggestion for this paper. Also, we would like to give the special thanks to Jamal, Evans and Foxall who are the authors of Consumer Behaviour, and Kotler and Keller who are the authors of Marketing Management. Without their books, we can not design our research model. In addition, the appreciation also goes to the website master of autohome.com who helps us upload our questionnaire on their website. Lastly, we would like to thank all those who took the time to answer our questionnaires.
Table of Contents
1. Introduction ... 1
1.1 The Choice of Topic... 2
1.11 Why We Choose Toyota ... 2
1.12 Why We Choose Promotion and Media... 2
1.2 Problem Statement... 3
1.3 Strategic Question ... 3
2. Research Questions ... 3
3. Conceptual Framework ... 3
3.1 Literature Review ... 3
3.2 The Research Model ... 4
3.3 Conceptual Framework ... 6
4. Methodology ... 10
4.1 Data Collection ... 10
4.1.1 Primary data ... 10
4.1.2 Secondary empirical data ... 12
4.1.2.1 Secondary sources ... 13
4.2 Data Analys is ... 13
5. Finding ... 15
5.1 Study the Target Market ... 15
5.2 Evaluate Effective Media... 18
5.2.1 Newspaper ... 18
5.2.1.1 Considering variables ... 18
5.2.1.2 Specific Media Vehicles ... 20
5.2.2 Television ... 21
5.2.2.1 Considering variables ... 21
5.2.2.2 Specific Media Vehicles ... 23
5.2.3 Radio ... 24
5.2.3.1 Considering variables ... 24
5.2.3.2 Specific Media Vehicles ... 26
5.2.4 Magazine ... 27
5.2.4.1 Considering variables ... 27
5.2.4.2 Specific Media Vehicles ... 29
5.2.5 Outdoor ... 29
5.2.5.1 Considering variables ... 29
5.2.5.2 Specific Media Vehicles ... 30
5.2.6 Internet ... 30
5.2.6.1 Considering variables ... 30
5.2.6.2 Specific Media Vehicles ... 32
6. Analys is ... 34
6.1 Study the Target Market ... 34
6.2.1.1 Considering variables ... 35
6.2.1.2 Specific Media Vehicles ... 36
6.2.2 Television ... 38
6.2.2.1 Considering variables ... 38
6.2.2.2 Specific Media Vehicles ... 39
6.2.3 Radio ... 40
6.2.3.1 Considering variables ... 40
6.2.3.2 Specific Media Vehicles ... 41
6.2.4 Magazine ... 41
6.2.4.1 Considering variables ... 41
6.2.4.2 Specific Media Vehicles ... 42
6.2.5 Outdoor ... 43
6.2.5.1 Considering variables ... 43
6.2.5.2 Specific Media Vehicles ... 43
6.2.6 Internet ... 44
6.2.6.1 Considering variables ... 44
6.2.6.2 Specific Media Vehicles ... 45
7. Conclusion ... 46
8. Recommendation ... 49
List of Tables and Figures
Figure:
Figure 1: Targeting market and media evaluation ... 5
Figure 2: Age of Responders ... 15
Figure 3: Education of Responders ... 16
Figure 4: Income of Responders... 17
Figure 5: Occupation of Responders ... 18
Figure 6: Comparison of Ratings of TV Programs of Local Channels ... 24
Figure 7: Favorite Radio Pragramme of Responders ... 25
Figure 8: Favourite car broadcast programme ... 27
Figure 9: Location of Magazine advertisements ... 28
Figure 10: Website Visitors‟ Browsing Habit ... 30
Figure 11: The growth of Internet Users in China ... 32
Figure 12: Increase of TV covering rate in China ... 71
Figure 13: The Scale of China‟s Internet Advertising Market from 2001 to 2012 (Forecast) 79 Figure 14: A Week Rank of Auto Website Weekly Visiting Times ... 80
Table:
Table 1: A framework for international promotion ... 6Table 2: Favorite Newspaper Content ... 19
Table 3: Favorite Ad in Newspaper... 19
Table 4: Compar ison between the Ratings of Newspaper Ad and the Whole Ad Industry .... 20
Table 5: Favorite TV Program ... 22
Table 6: Compar ison between the Revenues of TV Ad and the Whole Ad Industry ... 22
Table 7: Favorable Specific Website of Respondents... 33
Table 8: Top 30 of the Ratings of Channels in Local Stations ... 70
Table 9: Market Share Rate Ranking of Auto Magazine ... 74
Appendix:
Appendix 1: Questionnaire ... 58Appendix 2: About Toyota ... 62
1. Introduction
In this paper, we would like to discuss the promotional dimension of Toyota in China from a perspective of looking for effective media channels for the company and conclude according to our evaluation and analysis, finally to enable Toyota can increase its market share.
Under the context of global economic crisis, most industries had been in recession, including motor manufacturing. As the biggest motor manufacturer around the world, in American market, Toyota suffered a down of 13% of its market share (Guoji, 2008). But by contrast, the sales in Chinese market increased 17% in FY2008 (Asian Dispatch, 2009). With the momentum, Toyota has its further goal of the increase of market share in China, and which is the right purpose of this thesis.
We found that from a view of the level of price and quality, Toyota‟s main competition with its major rivals is concentrated on the intermediate level cars in Chinese market, thus to have a targeted and valuable thesis, we decide to focus our research on this mid-range car market.
To reinforce of promotion, which is our objective of this paper, we found that launching quality advertisements is the core in this iss ue, while selecting effective medium is one of the most important task in launching quality advertisements. So evaluating and analyzing effective medium become what we are going to work on throughout this paper.
According to the theme and objective of this research, we will focus our findings on the information about Chinese media channels and the characteristics of the target consumers. Limitation during this research exists, which is mainly manifested when we are collecting information about medium, for example the ratings. Another limitation is probably from the questionnaire we will design for the research, which lies in the effectiveness of the population and the number of responders.
1.1 The Choice of Topic
1.11 Why We Choose Toyota
The reasons why we choose Toyota as our thesis subject are:
Toyota is a company who has a glorious history of over 80 years. Through a long period of development, the company has evolved sound operational and managerial patterns and corporate culture. Examples include TPS (Toyota Production System) and Leaning Manufacturing, etc.
What‟s more, Toyota begun to expand to the world in 80s and obtained a noticeable success especially in North American market. This helped Toyota grasp a successful experience of international marketing approaches, in which field our thesis subject will focus on.
Under the context of financial crisis, the shrinkage of American market caused Toyota a sale decline of 33.9% in November 2008, comparing the same period in 2007. But strikingly, the sales in Chinese market in 2008 increased by 20%, which reflected the strong need in this area (Luo, 2009). Thus this is why we choose Chinese market for Toyota‟s international marketing analysis and where also causes our interests.
1.12 Why We Choose Promotion and Media
We choose the promotion as our research direction for this paper from the 4Ps of marketing mix, which consists of the four elements of marketing activities. According to the information collected, we found the improvements and adaptations on promotion aspect is the most practical and suitable one for us.
The decision of promotion is due to the feasibility, which means the final paper not only consists of analysis on Toyota‟s promotion, but allows us to propose feasible suggestions on that to make the paper have a meaning of actual application.
And we choose evaluating different medium to be our target direction, because to launching valuable advertisements is based on effective media channels, which is the
premise of attaining a successful promotion.
1.2 Problem State ment
In this paper, we are going to examine and evaluate the effectiveness of different medium channels in order to select the most valuable ones for Toyota‟s intermediate cars‟ promotion, and finally we will propose feasible suggestions based on the findings and analysis in order to help Toyota to increase its market share.
1.3 Strategic Question
For promoting Toyota‟s intermediate cars, which media channels and specific media vehicles are the most effective?
2. Research Questions
1. To find out the characteristics of the people who are the target customers and the potential ones of intermediate cars of Toyota.
2. To evaluate the effectiveness of different media channels for the intermediate cars of Toyota.
3. Conceptual Framework
This chapter will provide a theoretical frame that we use in analyzing chapter. The readers will have a chance to understand concepts and models before going through the collection of information.
3.1 Lite rature Review
In the book, Marketing Models (Lilien and Kotler, 1992), there has been discussions about evaluating the effectiveness of medium. In the Advertising part of this book, the authors introduced the evaluating approach.
the desired number of exposures to the target audience and to schedule the delivery of those exposures over the planning period.
Advertisers are seeking a response to its advertising from the target audience; in this case, the exposure (E) could be assumed a level of product trial. As the theory introduces, the effect of exposures depends on the exposures‟ reach, frequency, and impact. These factors can be defined as follows:
Reach (R): the number of different persons or households exposed to a particular
media schedule at least once during a specific time period.
Frequency (F): The number of times within the specified time period that an
average person or household is exposed to the massage.
Impact (I): The qualitative value of an exposure through a give n medium.
The relationship among reach, frequency, and impact can be shown as:
Total number of exposures (E) is the reach times the average frequency, that is, E= R×F. It is also called gross rating points (GRP).
According to the authors, through this app roach, researcher can evaluate the effectiveness of different medium with the concepts of E, R, F and I. This is one of the most famous and classic theory for evaluating medium.
But in realistic research, the gaining of the data the theory involves like Reach and Frequency is very difficult for us, because most of this data is not free for public. So in consideration of the limitation of the feasibility, we would like to choose the following combination of model to conduct our thesis research in order to a nswer the research questions.
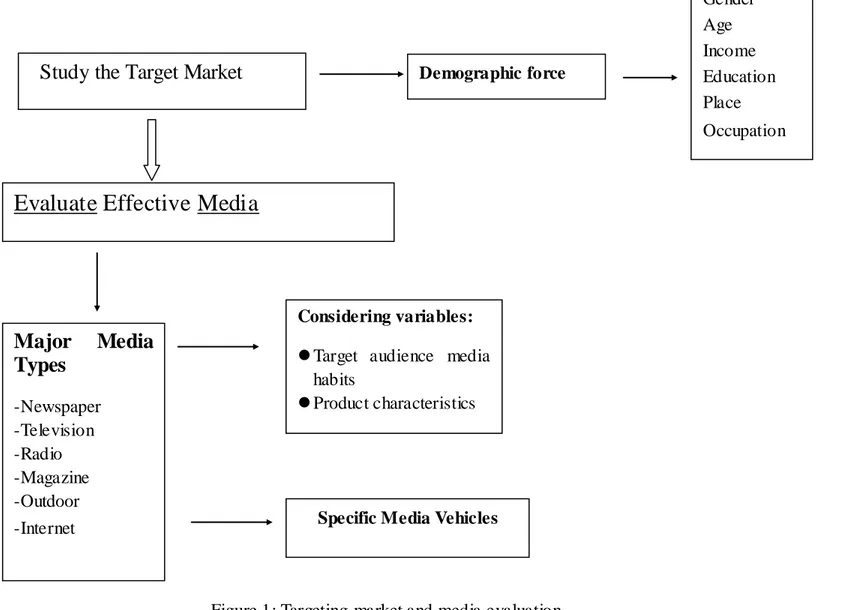
Figure 1: Targeting market and media evaluation
Adapted the model from Kotler and Keller (2006, p574)
Evaluate Effective Media
Specific Media Vehicles
Study the Target Market
Demographic forceMajor
Media
Types
-Newspaper -Television -Radio -Magazine -Outdoor -Internet Considering variables: Target audience media habits Product characteristics Gender Age Income Education Place Occupation
As the model indicates, this model mainly has two parts: Study the target market and Evaluate effective medium. And we choose Evaluate effective medium to be our focus direction.
As the first step of the model, our objective is to study the target market that has been decided in the introduction part, the intermediate car market. In this part, we are going to mainly analyse the target and potential consumers from the demographic perspective.
Second, we will focus on our main direction that to evaluate different medium for Toyota. In this phase, we first estimate and choose several valuable media forms, then evaluate these advertising forms with the three considering variables in the model. With these chosen medium, we examine different values and functions of them.
In the last part of analysis, we will look for specific vehicles of the evaluated medium.
3.3 Conceptual Frame work
In this paper, several models will be used to help us conduct our research. Generally, the two major steps of this thesis are selected from the model A framework
for international promotion in the book, International Marketing, as following,
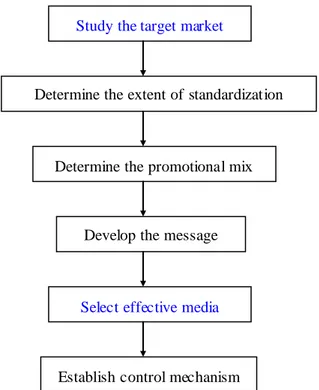
Table 1: A framework for international promotion
Study the target market
Determine the extent of standardization
Determine the promotional mix
Develop the message
Select effective media
In the original model, there are six steps of international promotion. The aim of this model is to reconcile an international advertising and sales promotion effort with the uniqueness of every market, which is the challenge confronting the international marketers. And to integrate this model with our thesis, we choose two steps from the entire six to be our major theoretical structure, namely, Study the target market and
Evaluate effective medium respectively, which are related to the research ob ject of this
paper. Our finding and analyzing parts will be conducted by these two parts and finally come to our conclusion, which can answer the research questions.
Study the target market:
Firstly, as having chosen our target market, that is, intermedia te cars, we are going to analyse the demographic characteristics of this target group. We learnt the concepts and theories of demographics from the Jamal et al (2006) book, Consumer Behaviour. According to the book, consumer demographics are important for marketers because consumers can be targeted by using variables such as age, gender and occupation. Consumer behaviour differs with demographic variables. For example, many of our purchases vary by age category. Similarly, men and women can behave different ly as consumers because of their different cultures.
In this section, we will discuss a number of demographic factors and research the corresponding customer behaviour habits. This kind of information and discussion can help us to match and choose the right medium when we are evaluating different media channels. To achieve this aim, our group gains such information via Internet and the questionnaire that we design. In the questionnaire, we are going to set 6 questions about customers‟ demographic characteristics, which involve gender, age, income level, education background, occupation status and resident place.
Evaluate effective medium:
The next is our major part of this model, evaluating different media forms for Toyota‟s intermediate cars. We choose the models in the book, Marketing
As illustrated in the model, firstly, we select 6 kinds of major advertising medium which are newspaper, television, radio, Internet, magazine and outdoor respectively to be our evaluating objects. We select these 6 channels mainly according to their large market shares of advertising revenue in China, which can reflect that these 6 medium are the largest advertising channels in China no matter in terms of economic scale or popularity in public. So these chosen medium will be the most effective for Toyota to advertise in order to improve their promotion in Chinese market.
The approach we analyse and evaluate these major medium is shown in the research model. Two variables has been chosen and listed in the research model, which are target audience media habits and product characteristics.
The variable of target audience media habits means what the target customers usually do in the daily life, which includes what is the most popular time or content towards particular media. This kind of information is mainly gained from the questionnaire we design for the target customers.
For instance, for newspaper, we are going to get two aspects of information bout customers‟ habits: which sections are the most popular in newspaper, and which parts of ad in newspaper are paid most attention.
For television, through the questionnaire, we try to learn which kinds of TV programs are the most popular for audience and what is the favorite time that our target customers watch TV.
This kind of investigation is also manifested in other advertising medium including Internet, outdoor, radio and magazine through the questionnaire.
The second variable, product characteristics is another dimension for us to evaluate the 6 medium. Here, the term “product” used in the book, Marketing
Management means media channel. Thus, this variable is to discuss the characteristcs
of different advertising medium. This information we will get is mainly illustrated like the developmental status of the medium, the economic scale, the market share of the advertising revenue and as well the ratings and circulations of the medium we choose. After that, we will use the model, „specific media vehicles’, which is also from the book, Marketing Management. Since we have evaluated the effective medium, with
this model, we will examine which specific media vehicles are the most effective for Toyota.
For instance, for TV media vehicle, which TV stations are most effective to advertise, and for journal vehicle, which specific magazines are most effective to propagate Toyota‟s products.
10
4. Methodology
In order to answer our research questions, information will be mainly conducted in three main areas. Firstly, in study of target market, we wil l find out information of demographic characters such as age, gender, social grades and income level about customers who would like to buy intermediate cars of Toyota, for example, Camry, Coralla, Accord and Reiz. The sales of these intermediate cars are around 100,000 to 200,000RMB1 in China. (Chevip, 2006) Secondly, in the evaluation effective media, we will find out information of different media in Chinese market such as audience rating, cost of different media and so on. Also, we will find out some information about the specific media vehicle. For instance, for TV media vehicle, which TV stations are most effective to advertise, and for journal vehicle, which magazines are most effective to propagate Toyota‟s products.
4.1 Data Collection
In this thesis, we decide to collect data from both primary and secondary sources. So we could complement insufficiency of each source and obtain enough data in order to answer our research questions which are find out the characteristics of the customers in the target market and evaluate effective medias for the promotion of Toyota‟s intermediate cars.
4.1.1 Primary data
According to Fisher (2004, p 132), There is a great variety of means that can carry out the primary research in the Master‟s thesis such as questionnaires, interviews, observation. We would like to choose questionnaire for consolidating our analysis. The questionnaire will be a semi-open one, which consists of some tick boxes first and several open questions at the end. Questionnaire is an effective measure to attain the most direct information. In this case, we are going to design our questions which are following the analyzing model: study the target market, evaluation effective media
and specific media vehicles. You can see these questions in appendix. Since the data are going to be collected from the Chinese customers, the questionnaires would be written in both English and Chinese. Because our target market is China, people would more prefer to answer questions by Chinese.
We design the questions to collect the demographic information of customers in our target market which is intermediate cars market and customer‟s habits about the different media channels. Therefore, we can know which media is effective for Toyota to promote its intermediate cars.
And to accomplish this questionnaire, we plan to post it on Chinese motor online forum, which has millions of members of motor fans and users, who will help us get the valid information and enough respondents.
Sample size
The targeted populations of this research are the visitors of motor forum which is www.autohome.com.cn. According to Baidu (2009), the autohome forum is a largest motor forum in China and there are around 1,500,000 visitors per day visit this forum. We will use convenience sampling technique as our method to collect the questionnaires. According to SCORE Mathematics (2009), convenience sampling is the method of choosing items in an unstructured manner from the population frame. A convenience sample chooses the individuals that are easiest to reach. It is convenient for researcher, but can not insure that this sample is an accurate representation of population. Due to the time limitation, the sample is the numbers of questionnaires that we collect within one week.
Question Format
There are totally 17 questions in this questionnaire and the questions are very easy to understand. There are two parts in the questionnaire which are study the target market and evaluation effective media.
rating scales, Likert scales and open questions.
In this questionnaire, the question 2 is a dichotomous question which is asking the responders‟ gender information.
Then, the multiple choice questions are 1, 3, 4, 6, 14 and 16. Questions 1, 3, 4 and 6 collect the demographic information of the responders such as age, education, income and career. Question 14 and 16 are about responders‟ reaction for print advertisement. They collect customer‟s reading habit about magazine and newspapers.
Thirdly, the questions 7, 9, 11 and 15 are checklists questions. Responders can choose more than one item if they want. Those questions are all about choice of the effective type of media to Toyota‟s intermediate cars.
Finally, because of the big population of our questionnaire, it is better to use semi-open questions in our questionnaire. For example, the questions 8, 10, 12, 13 and 17 are all about the responders‟ habit of choosing media. They will give our researchers more information about which media customers like and which specific vehicle they like. Also, there is another semi-question 5 and the aim of asking this question is colleting responders‟ information which part of China they come from.
4.1.2 Secondary empirical data
Secondary data is another important channel to obtain the information of the research. The secondary data provides sufficient knowledge background about information of different media in Chinese market. For collecting secondary data, our main analyzing method is documentary research with both open and pre-coded form. According to Fisher (2004, p 135), open approach is used to look for common narrative structures that are shared by many similar documents. Pre-coded study of documentary research is used to collect electronic document such as browsing the webpage and electronic journals. Fisher (2004, p 135) argues that pre-coded study of documents use electronic document files or electronic textual databases to count the frequency and context of the appearance of certain key words or phrases.
websites with a good reputation for trustworthiness of their content. For example, we will access to reliable and updated website like China Internet Network Information Center (CNNIC) from where we can collect statistics about the growth of number of Internet users in China. Also, we will collect secondary data from the articles and journals in Malardalen University‟s database like ProQuest, Emerald, ABI/inform and Business Insight, and the famous and reliable business magazines and Internet.
4.1.2.1 Secondary sources
Online databases Online newspaper Online business journals
Literature books “Marketing Management” by Kotler and Keller (2006), “Consumer Behaviour” by Jamal et al (2006) and “International Marketing” by Cateora and Ghauri (2005)
4.2 Data Analysis
There are three ways to stretch out study and make conclusion that is inductive, deductive, and adductive. According to Fisher (2004, p 248), induction is the process of drawing general conclusions from specific and detailed findings. It means that researcher starts in empirical findings, but do not reject theoretical pre-conceptions. Deductive is defined as the process of inferring particulars from a general statement. It means researcher starts with theories.
In our report, we start with theories, which relate to our research questio n, then through studying data. And then we draw our conclusion and give some recommendations. Therefore, deductive way is the most suitable for our thesis.
Based on Bryman‟s theory (2004, p 366), qualitative research is a research method which focus on „words more than quantification in the collection and analysis if data‟. And the quantitative research is focus on the „numbers‟ more than words. Additionally, the quantitative researchers are more distant and keep the point of view of themselves‟
but not the participants. Also, the quantitative research „bring a set of concepts to bear on the research instruments being employed‟ (Bryman, 2004, p 394).So the quantitative research is in performance to the theory „testing‟ but not „emergent‟. As for our research, it used the questionnaire to collect the data from participants, while we kept the identity of „researchers‟ to analyze the numbers. Meanwhile, we tried to test the our main research model which is updated from <Marketing Management> by Kotler and Keller (2006, p 574). With this kind of research methodology, we aimed to figure out the targeting market and media evaluation of the feature of this model.
The result of the questionnaire will be counted and finally displayed through the way of comparing percentages when we are going to introduce and analyze. By comparing the percentages of every option in one question, we can get the various relationships between the options.
5. Finding
5.1 Study the Target Market
Most demographic information is collected by primary data, questionnaires. A total of 267 questionnaires were returned within one week and there are 209 completed responses and 58 incomplete responses. The first six questions of questionnaire are used to collect demographic information of responders.
Gende r
Totally 266 responders answered this question. The sample consisted of 140 male responders which account for 52.63% of total responders. The female responders are 126 which make up 47.37%.
Age
266 responders answered this question. The age of responders is most 26 to 30 years old which account for 68.05 % of total responders and there are 181 people. The second age group is between 20 and 25 years old which make up 20.68% of total (55 responders). The number of responders between 31 and 40 years old is 14 which account for 5.26%. Those who are under 20 years old or above 40 only have much smaller percentage which account for 3.38% (9 responders) and 2.63% (7 responders).
Figure 2: Age of Responders 0.00% 20.00% 40.00% 60.00% 80.00% 20 or below 20-25 26-30 31-40 40 or above Age Percent of respondents
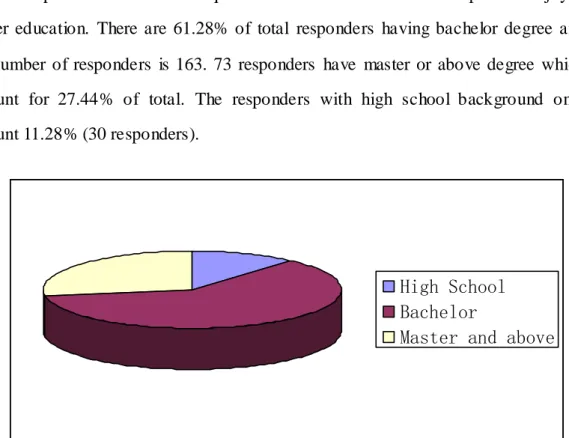
High School Bachelor
Master and above
Education
266 responders answered this question. More than half of the sample had enjoyed higher education. There are 61.28% of total responders having bachelor degree and the number of responders is 163. 73 responders have master or above degree which account for 27.44% of total. The responders with high school background only account 11.28% (30 responders).
Figure 3: Education of Responders Income
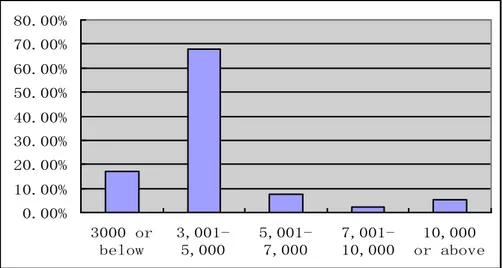
Totally 266 responders answered this question. The income of the majority of the responders is between 3,001 and 5,000 RMB which account for 68.05%, 181 responders. The second one is under 3,000RMB group which are 45 responders and account for 16.92%. Thirdly, the income of responders from 5,001 to 7,000 makes up 7.52% which include 20 people. The responders who earn 7,001 to 10,000 are only account 2.26% which is only 6 people. Finally, the number of responders who earn above 10,000 is 14 and make up 5.26% of total responders.
0.00% 10.00% 20.00% 30.00% 40.00% 50.00% 60.00% 70.00% 80.00% 3000 or below 3,001-5,000 5,001-7,000 7,001-10,000 10,000 or above
Figure 4: Income of Responders Place of residence
In question 5 of the questionnaire, we tried to learn the geographic distribution of our target and potential customers. From the result, we can see that all the 247 respondents are from dozens of cities of China. Among these, there are 46 respondents from the central area of China, there are 69 people from northern China, and 75 from eastern and finally 57 people from southern China. In the meanwhile, b ut we also notice that over 85% of the respondents are from intermediate or large cities.
Occupation
Totally 247 responders answered this question. The corporate or public institution workers are majority of responders which account for 41.30% of total responders, 102 people. The second large group is students which account 37.65% of total (93 responders). The free lancer and civil servant respectively make up 10.12% (25 responders) and 6.88% (17 responders). The unemployed responders account for 3.64% which is 9 responders. At the least, there is no retired people answered our questionnaires.
Student Corporate or public institution worker Civil servant Peasant Retired Free lancer Unemployed
Figure 5: Occupation of Responders
5.2 Evaluate Effective Media
We selected totally six major media types which are suitable for promoting Toyota‟s intermediate cars, including newspaper, television, radio, magazine, outdoor and Internet.
5.2.1 Newspaper
5.2.1.1 Considering variables
Target audience media habits
Through from the questionnaire we sent via the Internet, we collected the information about the media habits of the audiences to be our reference when we are evaluating different medium and specific media vehicles.
In question 15, we asked which sections in the newspaper you like. The options include news, sports, entertainment, series and economy. Through this question, we planned to learn which parts of newspaper were the most favorite in the target customers, which can give us a reference when we evaluate the newspaper media.
Contents
Results
% of Respondents Number of Respondents
News 34.57% 159
Entertainment 26.52% 124
Economic 19.13% 88
Sports 16.52% 76
Series 2.83% 13
Table 2: Favorite Newspaper Content
In another question about newspaper, we gave several choices of different kinds of ad in newspaper. The choices are color printing advertising, full-page advertising, half-page advertising, small plates advertising and the raphe advertising. With the answers, we can find which kinds of ad are most popular in readers.
According to the responses, among the 218 responds,
Contents
Results
% of Respondents
Number of Respondents
Color printing advertising 57.34% 125 Full-page advertising 28.90% 63 Half-page advertising 8.26% 18 Small plates advertising 3.21% 7 The raphe advertising 2.29% 5
Table 3: Favorite Ad in Newspaper Product Characteristics
Newspaper ad ranks the second largest in all the ad industries, which follows the largest TV ad. The revenue of newspaper ad has been accounting for 22-23% in all the ad forms for recent years (Xie, 2006). By 2008, the scale of the revenue has reached 82.68 billion RMB (Hui, 2008).
Though the newspaper ad is the second largest ad industry, as the appearance of the emerging ad forms like Internet, the newspaper ad‟s market share has kept decreasing for years and the increasing rate got a slide, too (News, 2009).
Table 4: Comparison between the Ratings of Newspaper Ad and the Whole Ad Industry
5.2.1.2 Specific Media Vehicles
To get the information about newspaper, firstly we need to know which ones are valuable for our research, which involves circulation and geographic features. Following is the top 10 newspapers on circulation in China (Nie, 2004):
1. 参考消息 (全国)
Cankao Xiaoxi (Nationwide) 2. 人民日报 (全国)
People‟s Daily (Nationwide) 3. 扬子晚报 (江苏)
Yangtse Evening Post (Jiangsu Province) 4. 南方都市报 (南方)
Southern Metropolis Daily (Southern Area) 5. 羊城晚报(广州)
Yangcheng Evening News (Guangzhou Province) 6. 楚天都市报 (湖北)
Chutian Metropolis Daily (Hubei Province)
Year Increasing Rate of All ad industries Increasing rate of Newspaper ad % of ne wspaper ad in all ad industries 2006 11.1% 8.61% 19.9 2007 10.68% 6.42% 19.4 2008 9.11% 8.1% 18.3
7. 新民晚报 (上海)
Xinmin Evening News (Shanghai) 8. 北京晚报 (北京)
Beijing Evening News (Beijing) 9. 大河报(河南)
Dahe Daily (Henan Province) 10. 南方日报(南方)
Southern Daily (Southern Area)
5.2.2 Television
5.2.2.1 Considering variables
Target audience media habits
We mainly got the information from the questionnaires we sent.
According to the question 8, among the 247 effective responses, 169 respondents said that they usually watched TV in evening, especially during the “prime time”, which is from approximate 20-23.
And from the question 9, we can know what kinds of program are the audience favorites.
And from the question 9, we can know what kinds of program are the audience favorites. Our options have series, movie, sports, news, science & education and entertainment.
Programme
% of Respondents
Number of Respondents
Movie 23.60% 147
News 19.90% 124
Entertainment 17.98% 112
Series 17.17% 107
Sports 12.04% 75
Table 5: Favorite TV Program
And in question 10, we tried to know there is any car programs watched by audience usually. But the answers didn‟t show any popular one for us.
Product Characteristics
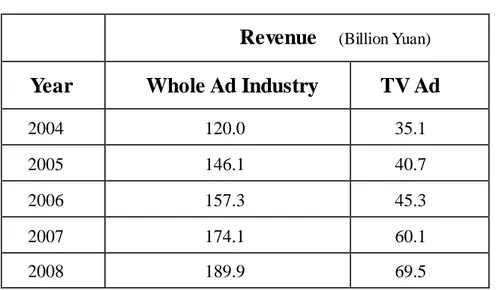
TV advertisement, emerging with the appearance of television in 1940‟s, has bee n developing rapidly in the last several decades. Nowadays, TV ad has become the most major and important ad form in the world, as well as in China. During the latest years, the revenue share of TV ad has been keeping at the level of 38% in the gross advertising revenue, which ranking the largest all the time, followed by newspaper and magazine, which ranked second and third respectively (Xie, 2006). Here‟s the comparison of the advertising revenue between TV ad and the whole advertisement industry in China in these recent years (Lxroto, 2005) (Hbjjrb, 2007),
Revenue
(Billion Yuan)Year
Whole Ad Industry
TV Ad
2004 120.0 35.1
2005 146.1 40.7
2006 157.3 45.3
2007 174.1 60.1
2008 189.9 69.5
Table 6: Comparison between the Revenues of TV Ad and the Whole Ad Industry As to the motor industry, in 2008, the advertising fee of this field ranked fourth after real estate, medicine and food. Additionally, the fee of motor industry increased by 28.25%, and it only followed the first increase of 28.77% by service industry (News. yntv, 2009).
consecutive years so far (Didibaba, 2006).
5.2.2.2 Specific Media Vehicles
CCTV
CCTV plays a dominant role in TV media of China, which has been in a monopolistic position in Chinese TV media industry.
The programmes broadcasted by CCTV cover 90% population of China, and the number of audience has exceeded over 1.1 billion (CCTV, 2007).
From Aug. 8th to 24th of 2008, the time when the Olympics was being held, the audience share of CCTV reached 52.19% , while the share of the first 6 months of the year was only 35.69% (Yang, 2008). And the audience share of the open and closing ceremony were 83.62% and 72.77% respectively. During the two weeks of the Games, there over 1.125 billion Chinese watched this event. Additionally, the ad revenue of CCTV during the games reached 2 billion RMB (Dong, 2008).
Spring festival is the most important festival in China like the Christmas in Western. Ever year, CCTV holds the Spring Festival Evening Gala on the eve of the spring festival. In 2009, the ratings of this program were 34.82%, higher than the 32.39% in 2008. And the ad revenue of this 4- hours TV program was 0.6 billion RMB strong (Msn, 2009) (Luo, 2009).
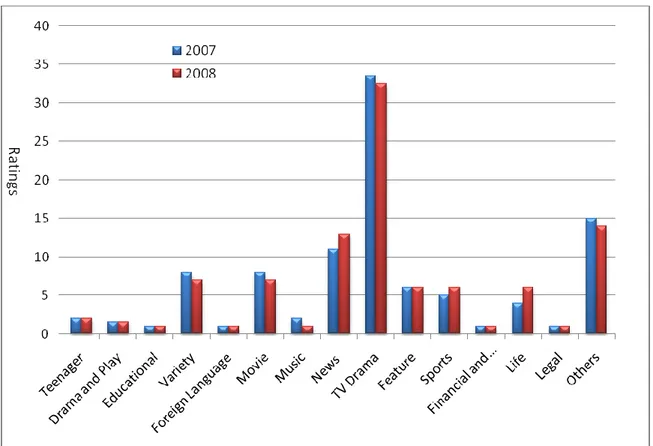
Local TV stations and channels
The following diagram indicates the comparison between the ratings of different TV programs in 2007 and 2008. This data is the comprehensive calculation of all the local channels (Hntvlyc, 2007).
Figure 6: Comparison of Ratings of TV Programs of Local Channels
5.2.3 Radio
5.2.3.1 Considering variables
Target audience media habits
In order to gain a better understanding of the audiences‟ preference in which kind of radio programmes such as news, entertainment, traffic programme, talk show and music, and then make suggestions for TOYOTA to make efficient advertisements strategies, we designed a question 11 (see appendix 1)
Figure 7: Favorite Radio Pragramme of Responders
From the pie graph above, we can come to the following conclusions: three kinds of main radio programmes attract the vast majority of a udiences, and the other two kinds of radio programmes only share the total left audiences, whose number is still less than any of the three radio programmes‟.
On one hand, when our analysis comes to the three main kinds of radio programmes, we can find that there are still some differences among them the music programmes came out on the top of the audiences‟ number. 143 responders answered that they would choose the music programmes as the preferable programme. The percentage took 31.43% of the total. Which came next is the entertainment programmes. 117 responders pick this kind programme as their preference and the percentage is 25.71%. Music and entertainment programmes, as the most common choices, are the most easily accessible and to understand. However, there is some difference between the third one and the former two kinds of programmes. The third kind of programmes which was usually chosen as audiences‟ preferable choice is the news programmes. 103 responders though that this kind of programmes were very attractive and the percentage of them is 22.64%. Although it is not one of the casual and relaxing programmes, the news programmes still won the vote from the audiences.
On the other hand, duo to the question is multiple-choice, we also should notice the two other kinds programmes, the traffic programmes and talk-show programmes.
News
Entertainment Traffic programme Talk show
Both of them only share around 20% of the total responders together. The traffic programmes are the answers of 49 responders and took 10.77% of the whole, while the talk show programmes are only chosen by 43 responders, which is 9.45% of total. Because of our multiple choices, these two kinds programmes are not only be picked up as the audiences‟ first choices, but also abandoned by around 80% responders from our survey, which means those 80% will not be active to listen to both of the two non-attractive programmes.
In addition, from the results of question 7 of questionnaire in Appendix 1, only 20 responders pick the radio element which account for 4.43% of total responders whe n they select mainly media channels to gain information.
Product Characteristics
According to website hc360 (2005), based on the age, most radio‟s audience in China are aged from 15 to 24 years old and from 50 to 64 years old. From the listening time, there are three period are the peak period of radio, including the morning period from 7am to 8am, the afternoon period from 12.30 to 13.30 and the middle night period from 22.30 to 23.30. The early morning period is the most important one.
5.2.3.2 Specific Media Vehicles
In order to collect the responder‟s specific preferable car broadcast programme, we designed a question 12 (see appendix 1).
As well for the specific preferable radio programmes about automobiles, we can get the data from the pie graph below.
Figure 8: Favourite car broadcast programme
In this question, 155 people participated in this survey and the responds showed the huge difference among the responders. Most of the responders thought that there was no stable radio programmes about automobiles are their preferences and the radio programmes about automobiles they listened were selected randomly. Beyond this part of responders, the other part is our research focus. In this part, 2 responders have never listened to any kinds of radio programmes about automobiles and 3 responders have no interest in the automobiles programmes. 14 responders‟ answers are totally different from each other and each answer is one specific programme. The two valuable answer-groups have the more concentrated choices. 12 responders selected Traffic Voice as their preferences and 6 responders picked Traffic Art out. Their percentages severally are 0.077% and 0.039%.
5.2.4 Magazine
5.2.4.1 Considering variables
Target audience media habits
In order to acquire the better understand readers‟ attitudes about location of 118 14 6 12 3 2 Random Other radio station
Traffic art radio Traffic voice Dislike any Never heard any
0.00% 10.00% 20.00% 30.00% 40.00% 50.00% 60.00% 70.00% 80.00%
Cover page Middle page Last page Between
articles
magazine advertisements, we designed a question 14 for our survey responders (see appendix 1).
Figure 9: Location of Magazine advertisements
From the bar chart, we can see clearly, there is a highly visible difference about the location of magazine advertisements. 164 people who answered the question would notice the advertisements on the cover page, and this number took a high percentage of 71.93%. That is almost 28 times of the last page advertisements‟ readers (6 responders). Meanwhile, the middle page advertisements and between articles advertisement have the similar percentage of reader-attracting rates, 14.04% (32 responders) and 11.40% (26 responders). All appearance, the cover page advertisements are much easier to be noticed and efficient.
In addition, from the results of question 7 of questionnaire in Appendix 1, 52 responders choose magazine as their mainly media channels to gain information which is account for 11.53% of total respondents.
Product Characteristics
In the four main medias (television, newspaper, radio and magazine), magazine is the number one in the quantity in China. At the end of 2004, there were 9490 different kinds of China‟s magazine. In China, the main source of the income of the magazine
still depends on the sales in the market, not advertising (Lu and Bei, 2003) (see appendix 3.4)
5.2.4.2 Specific Media Vehicles
In order to collect the information about the responders‟ specific preferable magazines, we designed a question 13 (see appendix 1)
There are 132 answers from the 157 responders are „no magazine about automobiles I have usually read‟ and only 27 responders gave the exact name of the magazines they have usually read. In the 27 respondents, <The Friend of Car> manifestly is the most popular magazine and 6 responders have or usually read this magazine. It took 22.22% of the 27 respondents. Each of <Car Magazine> and < Car Information > was been selected by 3 responders, which shared 11.11% of the total. The other options with exact name of magazines are 15 and all of them are different magazines. This result basically coincides with the Table 9 which can be seen in appendix 3.4. As the most influenced magazine, <The Friend of Car>, provides a good flat for showing because of its high market share rate (15.43) and coverage rate (99.26). Unfortunately, the data is based on the minority magazines readers (27 readers from the total 157 responders).
5.2.5 Outdoor
5.2.5.1 Considering variables
Target audience media habits
In terms of target audience, the outside ad will be confronted with almost all kinds of people outside. Thus, there is no specific media habit in this field to evaluate. Product Characteristics
Outside ad industry is one of the ad medium that have the largest increasing rate in China. The economic scale extended from 1.3 billion in 2003 to 3.4 billion in 2008 with an average increasing rate of more than 20% (Chu, 2008). And the market share
has been keeping at the level of over 10% (China.com, 2009).
In the field of outside ad industry, there is still huge market potential for marketers. But since the economic crisis, many small ad companies were closed down in 2008. In turn, in this industry, the competition between several biggest ad companies in China becomes more and more fierce, but the huge market makes them develop quickly but cannot beat each other.
5.2.5.2 Specific Media Vehicles
In this section, there is no specific media vehicle.
5.2.6 Inte rnet
5.2.6.1 Considering variables
Target audience media habits
For getting an understanding of website visitors‟ browsing habit, we designed an open question 17 (see appendix 1). From the answers to this open question, we can conclude that how many responders chose one specific kind of websites to visit, for instance, how many of them choose the gateway websites, searching websites, communication website, audio website and auto website to visit.
96
77
55
15
8
83
10
Gateway website Seraching website Communication website Video website Auto website others No frequency websiteFrom the respondent, we can conclude that, owning the largest group of visitors, the gateway websites have been chosen 96 times by the responders. What is coming next is the searching websites, and this kind of websites has 77 adherents. In the third position, the communication websites also abstract people‟s attention and 55 people from our responders told us those communication websites, which can provide them a flat to contract their friends, acquire others‟ information and present themselves, are the website they frequently browse. Beyond the big three groups, two other kinds websites were mentioned in the respondent. One is the automobiles website. 8 people answered that they would visit this kind of websites if they need some information from Internet. The other one is the video website. This kind of burgeoning websites is the choice for 15 responders. At the same time, there were 83 respondents were the responders chose other kinds of websites, such as the education, finance or sports websites. Additionally, 10 responders answered that they did not have the stable kind of website they frequently browse.
In addition, from the results of question 7 of questionnaire in Appendix 1, 220 responders answered that they would choose Internet as the preferable media channel to gain information which account for 48.78%.
Product Characteristics
According to CNNIC report (2008), 54.9% Internet users are male, 57.9% are unmarried, and 51.2% are under 25 years old in China. The majority of Internet users have at least a college diploma. In the total users, there are 36.7% are students, 25.3% are enterprise staff, 33.9% users earn more than 1500 Yuan a month, however, if student users are left out, this percent goes rises to 53.6%.
Figure 11: The growth of Internet Users in China
From the appendix 3.1, the CNNIC Report about Internet users, the total number of Internet users in China arrived 110 million as of December 31, 2006. On June 30, 2007, the total number of Internet users in China reached 162 million and the Internet users nearly grew 100 per minute within last half years and the Internet penetration rate reached 12.3%. At the end of the June 2008, the number of netizens in China reached 253 million which became the first one in the world. Nevertheless, the Internet penetration rate is only 19.1% percent. (CNNIC, 2006, 2007, 2008)
5.2.6.2 Specific Media Vehicles
From the question 17, we also can calculate how many responders chose one specific website to visit. The following table can show the details.
Category of we bsite Specific Website Number of respondents
Gateway we bsite Sina.com 43
96 Sohu.com 23 163.com 20 Yahoo.com 10
Searching we bsite Baidu.com 51
77 Google.com 18 Hao123.com 8
The Growth of Netizens in China
0 50 100 150 200 250 300 Years
Number of Internet User (million)
Table 7: Favorable Specific Website of Respondents
In the group of gateway websites, sina.com took the first position, and 43 responders in this group choose it to visit frequently, the percentage of its adherents from the total number is around 44.79%. Other websites are sohu.com with 23 responders (23.96% of total), 163.com with 20 responders (20.83% of total) and yahoo.com with 10 responders (10.42%). In the second group of searching websites, baidu.com won the most selection from the responders. It has the significant advantage (51 responders, 66.23% of total). Comparing with baidu.com, google.com only has 18 responders‟ choice (23.38%) and hao123.com in this group only have 8 (10.39%). Meanwhile, in the third group of communication websites, xiaonei.com and QQ.com have the similar adherents‟ number, 21 and 22. However, other websites, such as facebook.com and MSN.com in this group can only share the left 12 adherents. In the last group of video websites, youku.com took the two thirds selections (10 adherents) in this group and others only had 5 totally.
Communication we bsite QQ.com 22
55 Xiaonei.com 21
MSN 10
Facebook.com 2
Video Website Youku.com 10
15 Youtube.com 3 Tudou.com 2
6. Analysis
6.1 Study the Target Market
Gende r
According to the data got form questionnaire, we can learn that, for car market, especially for Toyota, the target and potential customers have no difference in gender. The percentages of male and female are 52.63% and 47.37% respectively among all the 266 respondents, which are basically the same. So when analyzing different medium, there is no need to consider the issue of gender division.
Age
From the perspective of age, according to Figure 2, we can know that the main target customers are concentrated between the ages of 26-30, which account for 68.5%. This is because this group of people normally has worked for years and began to consider their future like building a family, so this is the right age of thinking of having a car. Consequently, with some income, this ages of people become the main target customers.
Education
From the situation of the response of question 3, the choices of respondents indicated that among these people, the largest group is the people who have a bachelor degree, which account for 61.28%. And the degrees above and below bachelor both occupy a relatively lower percentages. The high school degree is 11.28% and the master and above degree takes 27.44%. This distribution just reflects the situation of education background of the Chinese population right now. So from the angle of education degree, our target customers should be focused on this group and we set our strategy on the characters of these people group.
Income
From the distribution of income in figure 4, we can know that the main target customers have the income from 3000-5000 RMB. The percentage of this income level reaches at 68.05% large. According to this data, we find that the major target population has an intermediate income level. This shows that we should concentrate our limited promoting resources on our middle-ranged cars, whose prices are not too high to the main target customers, but not the luxury models. Occupation
From figure 5, the chart illustrates that there are two main c ustomer groups for us to focus, which both have large percentages. One is the group, corporate or public institution workers, 41.30%, and another group is students, 37.65%. These two groups rank the first and second population among all the Occupation choices. This result reflects our main target customers should be focused on the common people and the youth. For common people, price is sensitive; while for the youth, fashionable appearance is the key character that can attract their attention.
Place of residence
From the result of question 5, we can see that the cities where the respondents come from are situated basically in every part of China, which means the customers have no special dialects or customs that Toyota should customise in terms of advertising. But from another perspective, we found that over 85% of the respondents are from intermediate or large cities. This information reminds us that Toyota should concentrate its ad resources on the big cities.6.2 Evaluate Effective Media
6.2.1 Newspaper
6.2.1.1 Considering variables
ranking second in the whole ad market after TV ad for years. Since the second largest position in ad industry, there should be much benefit and space for Toyota‟s promotion, and cannot be ignored.
But we also notice that because of the development of new rising ad forms like Internet, the market share for newspaper, having a decline in recent years, in 2006 was 19.9%, in 2007 was 19.4%, while in 2008 was even 18.3%. This situation can also be reflected by the increasing rate of newspaper ad. In the last 3 years, its increasing rates were always below the ones of the whole ad industry.
6.2.1.2 Specific Media Vehicles
For this case of industry decline, we should set our strategy by more targeted manner that is focusing on the most important newspaper channels. First, we think Toyota need to evaluate the largest newspapers in China. And we define the scale in terms of their circulations.
The above newspapers are the largest ones in China in terms of circulation, which means possess the largest influence and value for promotion. Among these newspapers, we divide them into 3 levels according to the geographic scale, which are nationwide, area-wide and regional. This kind of categorization can help us clear what and how we should focus and investigate on them.
National: Cankao Xiaoxi People‟s Daily
Area-wide: Southern Metropolis Daily (Southern Area) Southern Daily (Southern Area)
Regional: Yangtse Evening Post (Jiangsu Province)
Yangcheng Evening News (Guangdong Province) Chutian Metropolis Daily (Hubei Province) Xinmin Evening News (Shanghai)
Dahe Daily (Henan Province)
To have a well- targeted manner, we need to put different advertisements in different newspapers according to their characters.
From the responses of the questionnaire, we can see that there are four kinds of content in newspaper that are popular. In sequence, they are news, entertainment, economic and sports, whose percentages are 34.57%, 26.52%, 19.13% and 16.52% respectively. Only 2.83% of all the responses choose series, thus we give it up as few readers attend to this section. So we have four choices to advertising in different sections in newspaper.
From the finding part, we can find that some newspapers are founded with a government or party background. Normally, this kind of newspaper has a character of authority and accuracy, especially in news section. The newspapers with this character in top 10 are Cankao Xiaoxi, People‟s Daily, Yangtse Evening Post, Xinmin Evening News, Southern Daily and Beijing Evening News.
And at the meanwhile, we also can see that there are four newspapers characterized by entertainment, which are Southern Metropolis Daily, Chutian Metropolis Daily, Dahe Daily and Yangcheng Evening News. These above newspapers are good at putting advertisements in entertainment section.
We find that there is no newspaper is characterized by economy and sports. So the ads in these two sections will be added in some of the top 10.
In addition, from the question 16 in the questionnaire, we can find that readers tend to look at the ads in the color-printing paper, whose percentage is approac hing 60 %. So we think Toyota should advertise their ads with color-printing paper in the right section.
6.2.2 Television
6.2.2.1 Considering variables
According to the introduction of TV ad industry, we can know that the annual revenue of TV ad has been occupying the largest portion in the whole ad industry all the time. Its market share always keeps the level of 38% about. Last year, the revenue scale reached 69.5 billion RMB. This data indicates to us that TV ad plays a dominant role in the ad industry and is the most important way for Toyota to launch its promotion campaign. From the angle of motor industry, we can also prove the importance of TV ad for Toyota. According to the data in finding part, in 2008, the advertising fee invested by motor industry increased 28.25% compared with 2007. This amount ranked the fourth largest among all the industries. And from the perspective of Toyota itself, we believe the company has the financial ability to launch effective ad campaigns, because in recent 11 years, Toyota‟s advertising investment has been ranking the first in all Japanese companies according to the news published by Japan.
Since the dominant position of CCTV in Chinese TV media, the strategy for advertising in CCTV is extra significant to Toyota‟s entire promotion portfolio.
First of all, we need to know what kinds of TV program are audience‟s favorites. According to question 9 in the questionnaire, in all the 247 respondents, there are 147 chose movie programs, which accounted for 23.60%. And 124 preferred news, 112 audiences liked to watch entertainment content, there are 107 respondents chose series and 75 for sports making up 12.04%. We don‟t care about the science & education part because of its lowest percentage.
So the TV programs about movie, news, entertainment, series and sports, these five will be the target sections where Toyota‟s ads focus. According to the program content, following channels need Toyota‟s attention: CCTV 1 for news, CCTV 3 for entertainment, CCTV 5 for sports, CCTV 6 for movie and CCTV 8 for series.
questionnaire. And from the result of question 8, the time distribution is very explicit. Among the 247 answers, there are 169 respondents said they tended to watch TV in evening. The time span ranges between 20 pm to 23 pm, which is the so-called “prime time”. As the respondents are the people who have had or are going to have intermediate cars, the time span in the answers is just when our target and potential customers can receive Toyota‟s ads.
Besides the overall advertising strategy towards CCTV, Toyota also needs to notice the prominent effect of major events, because CCTV tends to possess the broadcast rights of the events. There are two instances for this case.
One is the Beijing 2008 Olympic Games. According to the information in finding, during last year‟s Olympic Games, only in China there were 1.125 billion people who watched the Games, and the high audience share will guarantee the receiving of the ads. This is an extremely important chance for Toyota to put their advertisements because of the huge population gathered in a specific short time (about 2 weeks).
Another event is the Spring Festival Evening Gala. From the information, we can see that in 2009, the ratings of this event was 34.82% and the ad revenue only from it reached 0.6 billion RMB.
6.2.2.2 Specific Media Vehicles
In this section, we are going to look at the ad market of local TV stations. But facing the mass local stations and various channels, Toyota needs to take an effective manner to optimize its limited ad resources. From the finding part, we know that among all the TV programs, the ratings of series had the absolutely dominant status in 2007 and 2008. Thus, advertising in the series programs will be the most effective and targeted way for Toyota to promote.
6.2.3 Radio
6.2.3.1 Considering variables
According to hc360 (2005), most audience of radio are aged from 15 to 24 years old and from 50 to 64 years old. From the results of our questionnaires, the main responders who interest in Toyota‟s intermediate cars are from 26 to 30 years old and the responders who under 20 years old or above 40 years old are much smaller which only account for 3.38%. These people are not main target customers for Toyota‟s intermediate cars.
Radio advertisement only shows its products depending on the sounds and voice because of the lack of vision. The automobile‟s advertisements, for example, can only show the potential customers how the autos‟ appearance and the performance make them satisfied by the radio hosts‟ description. Additionally, those autos‟ radio auditive advertisements can use very limited objects to show the strength, such as the sound of engine. If either of them gives audiences misleading impression, no matter how fantastic the designing is, this advertisement is failed.
Based on the responses to No. 11 question in our questionnaire, we can find that three kinds of main radio programmes attract the vast majority of audiences, while the two others are welcome in a very small group, so we will focus on which kind of radio programmes is more efficient for Toyota advertisements‟ posting in this part.
There are 31.43% of the total responders answered that they would choose the music programmes as the preferable programme. And 25.71%.responders selected entertainments programme as their preference. Meanwhile, 22.64% responders though the news programmes were very attractive for them.
However, the two other kinds programmes, the traffic programmes, which are the selected by 10.77% (49 people) of the whole responders and the talk-show programmes, which are only chosen by 43 responders, which is 9.45% of total. Both of them two only share around 20% of the total responders together.