A model developed for Swedish Museums
Performance measurement and
evaluation for cultural non-profit
organisations.
MASTER THESIS WITHIN: General Management NUMBER OF CREDITS: 15
PROGRAMME OF STUDY: Engineering Management AUTHORS: Jenny Hammar & Erik Lagerborg
TUTOR: Thomas Kohler JÖNKÖPING May 2017
2
Abstract
This study highlights the difficulty for non-profit cultural organisations to measure and evaluate the performance of their operations. The goal was to suggest and test a model for performance evaluation that can be used by museums, more specifically it was developed for Swedish Museums.
The theoretical framing of the study is Operations Management. With this being a practical and problem-solving research discipline, the pragmatic approach with Design Science research was chosen as the methodological foundation. Based on this strategy several research methods were used in the process of solving the problem and designing the model.
Based on previous models for performance evaluation, with the adaptation to the setting of Swedish Museums a model was presented, tested and evaluated in the study. The study was delimited to the design phase and implementation was not part of the report.
After having tested the model, a follow-up interview was conducted. In the interview, the test results were presented to a museum manager in order to validate that the model can be used as a tool for decision support and as a way to report non-financial results to stakeholders such as politicians or their representatives.
Key Words:
Performance measurement, evaluation model, non-profit, cultural organisations, museum, operations management, arts management, cultural economics
3
Table of Contents
1 INTRODUCTION ... 5
1.1 Background ... 5
1.2 Problem ... 7
1.3 Research Questions and Purpose ... 7
1.4 Structure of the Report ... 8
2 FRAME OF REFERENCE ... 9
2.1 Operations ... 9
2.2 Kulturarvspolitik- Museilagen ... 11
2.3 Performance measurement ... 11
3 RESEARCH METHODS AND PROCESS ... 19
3.1 Design Science Research (DSR) ... 19
3.2 Research Design and Process ... 21
4 RESULTS AND ANALYSIS ... 27
4.1 Analysis of secondary textual data ... 27
4.2 Survey ... 27
4.3 Interviews ... 33
4.4 Performance Evaluation Model adapted for museums ... 33
4.5 The model ... 34
4.6 Model testing ... 41
5 DISCUSSION AND CONCLUSION ... 45
5.1 Answer to research question 1 ... 45
5.2 Answer to research question 2 ... 45
5.3 Answer to research question 3 ... 45
5.4 Fulfilling the goal and purpose ... 46
4
6 CHALLENGES, LIMITATIONS AND FUTURE RESEARCH ... 47
6.1 Challenges of the Study ... 47
6.2 Limitations of the Study ... 47
6.3 Future Research ... 48
7 REFERENCES ... 49
5
1
Introduction
The following chapter introduces the notions of non-profit organisations and the problems of performance measurement and evaluation they face, which motivates the work described in this thesis.
1.1 Background
When a group of people comes together to achieve something they often create an organisation. The nature of the organisation may be formal or informal and the size may differ but never the less it is an organisation (Stevenson, Oxford dictionary of English, 2011). The organisation was formed with a purpose to achieve something, for a business that something may be profit for the owner, for a charity it may be to improve the environment for marine life. For most organisations, monetary funding is essential in order to run operations and achieve their mission. Funding might be obtained in different ways. The individuals or organisations that fund non-profit organisations usually do so with a purpose and an idea of what the resources are intended for. Therefore, in order to ensure continuous funding, it becomes important for the non-profit organisation to maintain a high level of trust from the contributors (García, González, & Acebrón, 2012; Bernstein, Buse, & Bilimora, 2016; Krug & Weinberg, 2004). Regardless of what the purpose of the non-profit organisation is, all strive to earn the trust from their contributors and one way to achieve trust and to assure that their work is carried out right is to measure the performance of the organisation (García, et al. 2012; Bernstein, et al. 2016; Krug & Weinberg, 2004).
When measuring performance, first the meaning of the word performance needs to be defined, in order to know what to measure. Performance can simultaneously be an action, the result of an action and the level of success of said action put in relation to a benchmark (Lebas & Euske, 2002). Context can be used to help clarify what is meant by performance in the specific case (Lebas & Euske, 2002). The purpose of the organisation sets the context for how to evaluate performance.
An organisation’s performance might be evaluated in several ways, a common and easy way is to benchmark against last year’s performance as well as against other similar organisations performance. There are different types of numerical measurements that could be used. These can be both financial measurements such as growth, profit margin and Return on Investment (ROI). There are also non-financial measurements such as customer satisfaction, employee satisfaction and customer retention which can be made numerical. Other ways to evaluate organisations are through measuring their efficiency and effectiveness compared to resource usage. Another perspective of performance for non-profit organisations is impact, sometimes called social impact depending on the nature of the organisation. Impact can be both relevant and important when assessing how a charity organisation uses its resources and if the resources were spent on promoting the purpose of the organisation. When using the term impact in association with performance measurement at a museum or any other cultural organisation is it easy to interpret or misinterpret that the evaluation is determining the artistic qualities of the work (Turpide & Laurin, 2009).
The term non-profit organisation encompasses many different types of organisations, all having in common that their purpose is not to generate profit for owners and investors. They can be charities, associations, political organisations or governmental agencies, museums and clinics amongst others (LII, 2017). With some non-profit organisations, the purpose is clear and easy to understand; whilst others, such as museums, there might be many different purposes (Paulus, 2003; Barrio, Herrero, & Sanz, 2009) and therefore these organisations may be more difficult to grasp. A mission statement usually defines the organisations’ objectives and how to reach them (Kaplan & Norton, 2004; Bain & Company, 2017). A mission statement is therefore, a starting point when developing a strategy for the organisation’s activities in order to achieve their purpose. This strategy can then be used both for operational and evaluation purposes. (Kaplan & Norton, 2004).
6
1.1.1 Swedish museums
One branch of the cultural sector are museums, which are defined by International Council of Museums (ICOM) as: "A museum is a non-profit, permanent institution in the service of society and its development, open to the public, which acquires, conserves, researches, communicates and exhibits the tangible and intangible heritage of humanity and its environment for the purposes of education, study and enjoyment.” (ICOM, 2007). Another definition presented by the Swedish government, formulated in a law about to be accepted in 2017: “A museum has in this law reference to an institution that is open to the public, which acquires, preserves, investigates, communicates and exhibits the tangible and intangible evidence of people and their environment.” (Regeringen, 2016), Although there is a large variety of museums, this report will cover those defined as community funded museums (Sveriges Regering, 2016) including governmental-, regional- and municipal museums as well as museums where the board of directors is politically appointed with up to 50 percent (Sveriges Regering, 2016; Kulturanalys, 2016).
The governmental museums, also called central museums (Kulturanalys, 2016), are museums considered of special interest for Sweden, for example, The Wasa Museum and The Museum of Swedish history. Regions and municipalities are also funding museums of interest, sometimes in joint ventures (Kulturanalys, 2016). These museums were defined as regional museums (Länsmuseums) or municipality museums (kommunala museum). Apart from these museums, there are also other types of museums but this report will not cover them.
In the early 1980s, there was a general progression within the international world of museums for a shift in management philosophy within the tax-funded sector. In order to achieve this, the funders looked towards the realms of for-profit businesses. The museums started to adapt and formalise goals and management processes (Köping, 2007). This change in management philosophy required the managers of the respective organisation to account for how the funds granted had been used (Köping, 2007) and prove that it had been used the way the funders intended. The managers were often required to account for reached goals, financial results, market plans and number of visitors each year. They were also asked to evaluate their organisation in both financial and qualitative terms (Köping, 2007). At the same time, the funds have not been increased at the same pace as costs have risen, and some museums have even had their funding decreased (Köping, 2007). Another financial issue for museums is that their external income from archaeological consultations was opened up for competition from the private sector. Museums that have not successfully met the competition have lost a large part of their external income due to this. For example, Jönköpings läns museum has had a decrease in external income with almost 40 percent between the years 2007-2015.
Decreased funding means that museums have had to adapt their costs accordingly, often by cutting down on staff. In the same time, the demand from funders of increased reporting has meant that staff with specialist competences needed in a museum are laid off while the support functions are kept and the same trend has been seen in Swedish museums (Köping, 2007; Lindqvist, 2007; Matarasso, 2007; Narduzzo & Zan, 2007).
The politicians in Sweden are governing the tax-funded museums by the "arms-length" principle (Köping, 2007; Matarasso, 2007). This means that politicians are not involved in the running of the museums nor the content, but rather they have left those decisions to the manager (Köping, 2007). The “arms-length” principle is about to become institutionalised in the new law for museums (Sveriges Regering, 2016). A problem with the “arms-length” principle is that the funder becomes distanced from the organisation leaving it adrift. One manager at a large central museum stated that the only time the funders were interested in the museum where when the financial results were negative (Lindqvist, 2007).
Apart from granting funds, the politicians set down the general direction for the organisations in form of mission directives (uppdragsbeskrivning). These are based on the main directives from the government and what local politicians want the museum to achieve. These mission directives are often general and not prioritised, making difficult for managers to divert the funds according to the funders intent (Lindqvist, 2007; Matarasso, 2007). Some museums use these generic missions from the funder as a base for creating their own mission statement (Jönköpings läns museum, 2005 - 2015).
7
1.2 Problem
Many non-profit organisations are funded by the public or donations and it is therefore in the interest of the non-profit organisations to show the financial contributors that the money is being used as intended. In order to keep the public and the funders trust in the organisations, it is necessary for the organisations to be able to show them that the resources granted are being used properly. A good way for organisations to prove this is to measure and evaluate their performance according to their mission, in a formalised way. This ensures transparency of the organisation’s transactions and operations and is a way for management to increase credibility.
In a for-profit organisation, performance measurement is quantifiable and there are a number of different Key Performance Indicators (KPI) that can be used to measure how the organisation is performing (Atkinson, Waterhouse & Wells, 1997; Chen, 2010). For non-profit organisations, many of these KPIs are not as relevant, or even possible to use, when assessing the performance of the organisation (Kaplan, 2001; Chen, 2010; García, et al., 2012; Turpide & Laurin, 2009). That does not mean that performance measurement is not important for non-profit organisations but it may prove to be a more difficult process.
Most non-profit organisations do not have a traditional production process where productivity, efficiency and effectiveness can be defined. The output from the organisation’s operations could be immaterial and therefore difficult to measure. One KPI often used to evaluate the performance of an organisation is the financial result of the organisation, where positive (profit) are considered good and negative (loss) bad. The problem with accounting for the financial result of a non-profit organisation is that if they end up with a positive result it could be as bad as making a loss since a positive result mean they have not used all available funds to achieve their mission.
Therefore, it is necessary for non-profit organisations to have an alternative method for measuring and evaluating their performance.
1.3 Research Questions and Purpose
The background and problem description above describes the difficulties of measuring and evaluating organisational performance when profit is not the goal for an organisation. It also describes the importance for a non-profit organisation of gaining and maintaining the trust from those granting funds to the organisation. One way of gaining and maintaining trust is to account for efficiency and effectiveness in the organisation’s operations. This can be done by evaluating the organisational performance with the aim of reporting back to those that grant funds. The difficulty lies in having a structured and relevant method that is suited for a non-profit organisation within the cultural sector. Therefore, the purpose of this study is formulated as follow:
The purpose of this study is to increase both theoretical and practical knowledge for how non-profit organisations within the cultural sector can measure performance and evaluate their operations.
To reach the purpose, which is more general in its formulation, a more concrete goal with the study has been established.
The goal is to suggest and test a model for performance evaluation to be used by cultural non-profit organisations. The focus of this study is to reach the goal and by doing so creating both theoretical and practical knowledge for performance evaluation as a tool to improve operations in non-profit cultural organisations. The setting for the development and testing of the model will be Swedish museums. Answering the following research questions will contribute to reaching the goal and suggesting a model for performance evaluation to be used by non-profit organisations in the cultural sector.
1. To what extent do Swedish Museums measure and evaluate their performance today?
2. Which non-financial factors and criteria are important to include when evaluating and measuring performance in a cultural non-profit organisation?
8
3. Is there already an established model that can be improved or adapted for Swedish museums? Research question 1 will serve to prove relevance and business need which is a criterion for the chosen methodology of Design Science Research as described in the guidelines explained in Table 1 in section 3.1.
Research question 2 will help in the design process and in the testing and iteration part of the process where the model is adapted to better suit the intended organisations and their needs.
Research question 3 will also help the design process, particularly in the initial part where the model is formulated.
1.3.1 Delimitations
The report was delimited to measuring the performance of the museum as efficiency or effectiveness. The report did not delve into measuring the impact of museums, such as increasing the awareness of democratic ideas, enhanced learning and understanding of the historical context of the society. In order to measure the impact of a museums activities, it would be necessary to collect data from several external sources which is beyond the scope of this report.
Since the model was supposed to evaluate performance there would be a need for the collection of data to be systematic and consistent in order for the evaluation to be relevant. But as this model was supposed to be generic it only stated what data to be collected not what methods should be used collecting it, since this may differ between different organisations. Neither did the report develop implementation methods for performance measurements in museums.
When conducting research within the cultural sector, artistic quality would often have to be considered. This was also true for this study. In a report, Nordgren (2015), discussed this question. According to Nordgren (2015), artistic quality was not actually defined so there was no clear answer to what it is. She has through research found that there was a strong sense of importance within the sector that it should not be defined. If it was to be defined in a discursive context the definition would be based on the actor with the highest amount of power to decide. This power could be expertise, systematic or hierarchal. She also points out that the definition of artistic quality was not defined in law or from the government but rather by the actors within the cultural sector. Based on the research by Nordgren (2015) the authors of this report were of the opinion that artistic quality was not possible to measure. As this report was about performance evaluation and large parts of performance evaluation are about knowing what you are measuring this report delimited itself from artistic quality as a part of the model and KPIs in the model.
For practical reasons based on time and geographical limitations, only Swedish museums were investigated. All museums selected for the study abide by the principle of public access and thus facilitating the availability of data.
1.4 Structure of the Report
The remainder of the report is structured as follows:
Chapter two cover the frame of reference and related work. Chapter three explains the methodology and chosen methods used for the study. In chapter four, the results of the study are presented along with the suggested model for performance evaluation. Chapter five covers discussion and conclusions drawn from the study. Finally, chapter six describes challenges, limitations and possible future studies.
9
2
Frame of Reference
As outlined in the introduction, the topic of the study is performance evaluation for cultural non-profit organisations. To gain a deeper understanding and in order to build a theoretical framing as well as identify gaps in knowledge, a literature review was performed.
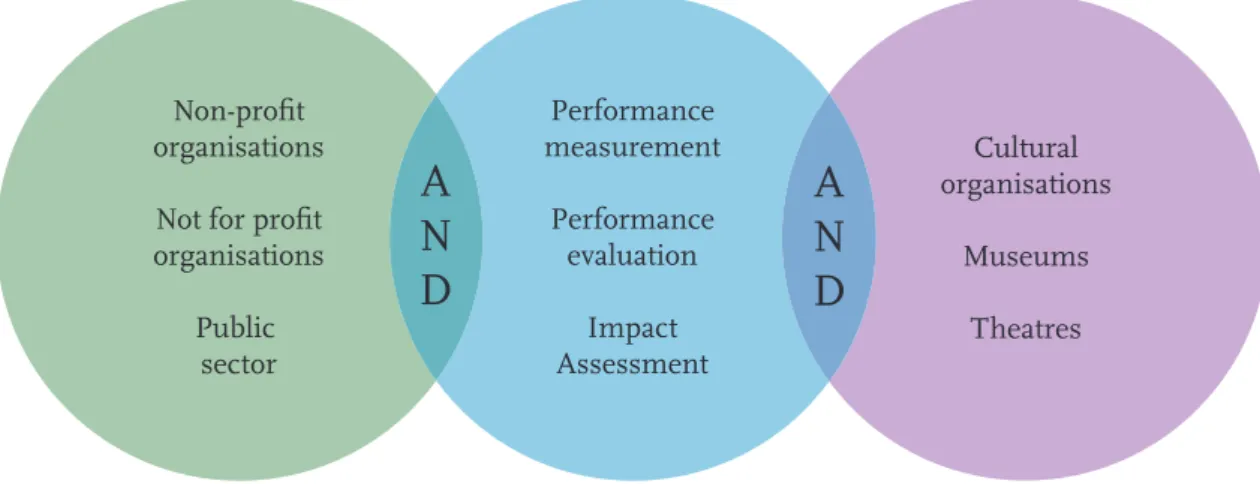
There are different types of literature reviews, systematic and traditional (Easterby-Smith, Thorpe, & Jackson, 2015). The one performed for this study was more traditional since snowballing and reference tracing was allowed after the first round of articles reviewed. More articles were found after going through references of already read articles related to performance evaluation for cultural organisations.
Figure 1 Illustration of search words used in the literature review
As illustrated in Figure 1 the initial search was done with search words related to performance measurement in combination with either non-profit or cultural organisations.
2.1 Operations
In most organisations, there is some sort of operations function, even if not mentioned or thought of as operations. Part of what operations are could be explained as the activities within the organisation that provide value to customers, either through services or products. According to Slack, Chambers and Johnston (2007), there are three core functions within any organisation and operations is one of them. A major function of an organisations operations is the transformation of input into output, and it is this transformation that is adding value for the customer (Slack et al. 2007). How well an organisation is exploiting its operations in alignment with customer needs is what can make or break the organisation (Slack et al. 2007). Therefore, it is vital for any organisation to manage its operations effectively.
2.1.1 Operations Management
According to Slack and Lewis (2011), by satisfying the customer demand the customer will use the organisation and make it possible for the organisation to fulfil its mission. The processes that create value for the customer, such as production, services and sales are part of the operations (Slack & Lewis, 2011). Managing the operations with the customer as the focal point is called operations management (OM). OM also focus on making sure the processes are efficient and effective in order to create as much output as possible from the input (Slack et al. 2007). All processes have a customer (Jonsson & Mattsson, 2016) and one definition of customer is that they are paying for the organisation’s services or products. According to Matarasso (2007), the government buys cultural services from the institutions on behalf of the citizens. And by doing so the contract between the
Non-profit organisations Not for profit organisations Public sector Cultural organisations Museums Theatres Performance measurement Performance evaluation Impact Assessment
A
N
D
A
N
D
10
purchaser (the citizen) and the supplier (the cultural institutions) becomes more complicated since the government have few and limited means of knowing if the citizens are satisfied with the services offered by the institutions (Matarasso, 2007).
A common management philosophy in for-profit organisations is the business model where the core idea is to make a profit by generating revenue (Slack & Lewis, 2011). Another management philosophy is the operating model which has a different focus. The focus with an operating model is customer demand and how the operations and capacity of the organisation need to align with those, rather than assuming a profit motive (Slack & Lewis, 2011). This makes the operating model viable for all types of organisations, including non-profit and the public-sector organisations (Slack & Lewis, 2011). This stems from the fact that all operations need to take the same form of decisions, no matter if there is a for-profit or non-profit perspective (Slack, Chambers, & Johnston, 2007). According to Slack et al.(2007) a problem for operations management within non-profit organisations is the fact that their strategy is more complex than for-profit organisations, therefore it is a larger chance that the operations manager need to make decisions based on conflicting goals (Slack et al. 2007). By adapting to an operating model, an organisation will have to define what the organisation does both in their business and in their processes. According to Slack and Lewis (2011), this knowledge will make it possible to clearly examine the organisation in terms of a key relationship between structures, processes and business functions.
Slack and Lewis (2011) presents elements that are normally included in an operating model:
• Key Performance Indicators (KPIs) – with an indication of the relative importance of performance objectives;
• Core financial structure – profit and loss (P&L), new investments and cash flow; • The nature of accountabilities for products, geographies, assets, etc.;
• The structure of the organisation – often expressed as capability areas rather than functional roles;
• Systems and technologies;
• Processes, responsibilities and interactions; • Key knowledge and competence.
In order to align the organisation with customer demands, an organisation following the operating model will need to coordinate and plan capacity usage with customer demands in mind (Slack & Lewis, 2011), since it is the customers that evaluate the performance of the organisation (Jonsson & Mattsson, 2016).
2.1.2 Capacity
Capacity is the ability of an organisations operations to produce service or products and by doing so create value for the customer (Jonsson & Mattsson, 2016). By trying to foresee or interpret the demand from customers, anticipated capacity can be planned for ahead. This means that it is necessary for the organisation to adapt the availability of capacity when the demand changes (Jonsson & Mattsson, 2016; Slack & Lewis, 2011; Jacobs, Berry, Whybark, & Vollmann, 2011).
Capacity is calculated based on a production group or other unit within the organisation. Capacity is a value that is used for planning how much that unit or production group will be able to produce during a set period (Jonsson & Mattsson, 2016; Jacobs et al, 2011). The calculated capacity value could either be presented as machine hours or man hours depending on the processes and/or organisation (Jonsson & Mattsson, 2016). When calculating the capacity of units, it is necessary to divide the capacity into different levels in order to know how much of the capacity that it is possible to plan (Jonsson & Mattsson, 2016). The first level is Maximum capacity which is the theoretical production capacity of the unit if it is to run for 24 hours a day every day of the year (Jonsson & Mattsson, 2016). The level below is called the Nominal capacity and is defined as the capacity that the
11
organisation normally plan to use (Jonsson & Mattsson, 2016). Nominal capacity is often calculated with these four variables according to Jonsson and Mattsson (2016):
• The number of machines or other production units • The number of work shifts per day
• The number of hours per work shift
• The number workdays per period of planning
An example of how this calculation could be used is to take a Swedish employee with a standard work week. The employee is alone in the production unit and works only one shift a day. The employee works for eight hours during the shift and for five days during the period of planning, in this case, one week. This leads to the formula (1*1*8*5=40) meaning that the worker will have a nominal capacity of 40 hours per week.
When planning ahead it is not advisable, according to Jonsson and Mattsson (2016) to use the nominal capacity since it is unlikely that all of it can be used for production. There may be machine breakdowns, short time absence, maintenance et cetera. When considering these factors and deducting them from the nominal capacity, a level of capacity called Gross capacity has been reached (Jonsson & Mattsson, 2016). In order to get the last level of capacity, it is necessary to account for other activities in the organisations. Such as waiting for material, communication with supervisor, breaks et cetera. It will also be necessary to account for non-planned activities that may be necessary, for example, reworking defective products or emergency repairs that may occur (Jonsson & Mattsson, 2016). When all that have been accounted for, the organisation has reached the lowest level of capacity called Net capacity and it is this value that can be used for planning value adding production (Jonsson & Mattsson, 2016).
2.2 Kulturarvspolitik- Museilagen
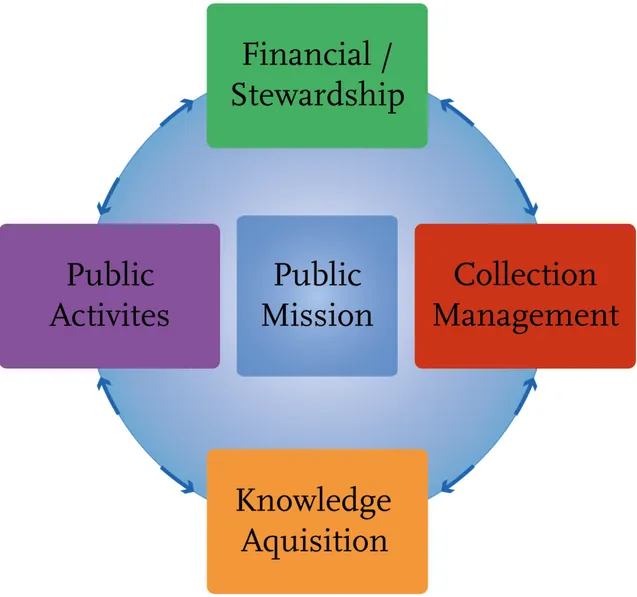
In 2016, the Swedish government proposed a new law in regard to cultural heritage politics and museums called Museilagen, prop. 2016/17:116. Prop. 2016/17:116 is to take effect as of July 1st, 2017. Parts of prop. 2016/17:116 are directed directly towards museums and what the Swedish government intend for them to do. Prop. 2016/17:116 defines and makes it clear that politicians are not to influence the content of the museums in any way but rather to govern at an “arms-length” distance. The part of prop. 2016/17:116 which is of most interest for this report are the paragraphs six to ten, that are divided into three sections named Publik verksamhet (Public activities), Kunskapsuppbyggnad (knowledge acquisition) and Samlingsförvaltning (Collection management) (Sveriges Regering, 2016). Within public service, it becomes clear that the Swedish government intends exhibitions and other activities be aimed towards the public. Prop. 2016/17:116 states that these activities should be knowledge based, being broad and accessible for everyone. If necessary the activities should be adapted to fit the users.
In the section knowledge acquisition, prop. 2016/17:116 explains that the museums shall contribute to research and other knowledge acquisition. This shall be achieved by having a high level of competencies within their organisations.
The last section on collection management defines that the museums shall have an active management of their collections (Sveriges Regering, 2016).
2.3 Performance measurement
Most organisations that use resources will need to account for how these resources are being used. It becomes even more important if the individuals or organisations granting funds for the organisations are not a part of daily operations. One way to organise is for the funders, to use a board of directors (BoD) to evaluate the organisation. The running of daily operations of the organisation is often left to the manager. An important role for the BoD is to monitor the organisation’s
12
performance and make sure that the organisation is effective and uses the resources allocated in the way the funder/owner intended (Miller, 2002; Bernstein, Buse, & Bilimora, 2016). Although there has been research made on the BoD monitoring behaviour in for-profit organisations the same cannot be said about BoD behaviour in Non-profit organisations (Miller, 2002).
The owner or funder of an organisation have a clear idea of what the organisation is meant to do with the funds and this is often defined as the organisation’s mission which in turn is decided by the BoD (Bernstein et al. 2016). Performance evaluation or measurement is a way for the funder/owner making sure that the organisation is fulfilling its mission (Bernstein et al. 2016). By measuring the performance and reporting back to the fundraisers, their trust in the organisation will be maintained (Bernstein et al. 2016; Basso & Funari, 2004). Maintaining the trust of fund granters is vital for organisations, especially non-profit organisations since this is one of the main ways to raise new funds necessary for the organisation’s survival (Kaplan R. S., 2001).
Apart from being a way of measuring the performance of the organisation performance measurement is a way to manage that the organisation is working towards the strategy set up for the organisation and support the managers in decision making (Otley, 2002; Blackbourne, Molnar, Herrick, Fiori, & Matthew, 2004; Kaplan R. S., 2001; Krug & Weinberg, 2004).
For-profit organisations have traditionally used financial measurements as a way of evaluating performance, ROI being one of the most common (Otley, 2002; Neely & Austin, 2002). During the late 1990’s it became more recognised that financial measurements are not enough as they do not give a complete picture of an organisation’s performance; there was a need for a more multidimensional performance measurement method (Neely & Austin, 2002; Kaplan & Norton, 1992). For Non-Profit organisations, financial factors are even less useful as a measure of performance, since the mission and strategy for them do not include making a profit.
Performance is a commonly used word but it has different meanings depending on the organisation’s mission and context (Otley, 2002; Pignatoro, 2011). Lebas and Euske (2002) present a list of definitions of performance, whereas this report will focus on the first five:
1. Measurable by either a number or an expression that allows communication (e.g., performance in management is a multi-person concept);
2. To accomplish something with a specific intention (e.g., create value); 3. The result of an action (the value created, however measured);
4. The ability to accomplish or the potential for creating result (e.g., customer satisfaction seen as a measure of the potential of the organisation for future sales);
5. The comparison of a result compared with some benchmark or reference selected – or imposed – either internally or externally;
6. A surprising result compared to expectations; 7. Acting out in psychology;
8. A show, in the “performing arts”, that includes both the acting or actions and the result of the actions as well as the observation of the performers by outsiders;
9. A judgement by comparison (the difficulty here is to define who the “judge” is, and to know by which criteria the judgement will be formed).
For each organisation, it is necessary to clearly define what is meant with performance in order to be able to measure it and get accurate results. The definition should be so clear that it is possible for a third party to understand it, or at least so there is no discrepancy between the manager’s interpretation and the workers’ interpretation (Kennerly & Neely, 2002). In order to measure performance, it is necessary to find Performance Indicators (PI) (Jääskeläninen & Roitto, 2015), also referred to as Key Performance Indicators (KPI). When deciding for which KPIs the organisation should use in its evaluation, it is important to consider the mission of the organisation in order to avoid measuring unimportant factors (Pignatoro, 2011). Another important aspect when deciding KPIs will be what method to use when collecting data and being consistent in this data collection (Pignatoro, 2011). When using a single KPI it is important to be aware of the fact that the KPI is only a single dimension
13
of what most probably is a multidimensional phenomenon, and therefore does not give the whole picture (Pignatoro, 2011).
When measuring the performance of an organisation there are different methods to use, that can be put into two different categories, quantitative or qualitative. Quantitative methods often collect data in form of numbers and present them by themselves or in correlation to another number. By presenting the evaluated phenomenon in correlation to another phenomenon it is possible to decide if it is good or not. Qualitative methods to collect data are mostly in form of interviews or surveys. The data collected are in form of individuals’ perception of a phenomenon and are collected to gain a deeper understanding.
2.3.1 Efficiency and Effectiveness
Both effectiveness and efficiency can be used when evaluating the performance of an organisation but they describe different things and it is important to know the difference. Effectiveness is “the degree to which something is successful in producing a desired result” and Efficiency is the ability to “achieving maximum productivity with minimum wasted effort or expense” (Stevenson, Oxford Dictionary of English, 2010). Both may be useful measurements of organisational performance.
Efficiency is usually described as how well the organisation are using its resources and avoiding
waste (Lebas & Euske, 2002). Efficiency can also be described as getting the most output with the minimum amount of input, or to keep output at the same level while lowering input (Basso & Funari, 2004). Input is in the case of efficiency to be considered all kind of resources such as time, money and materials. While output is what is generated using the material provided. For organisations with multiple outputs and inputs efficiency will be more difficult to define and measure (Basso & Funari, 2004).
Effectiveness is sometimes defined as; is the organisation doing the right thing. This can be
redefined as whether the organisation’s output is in line with what the organisation is intended to do. In a for-profit organisation, this might mean delivering what the customers want to buy at the right price at the right cost. While for a non-profit organisation it might mean that using the resources available to achieve the mission set out by the funders (Kennerly & Neely, 2002)
2.3.2 Performance Measurement Systems (PMS)
In order for an organisation to measure its performance, it will be necessary to use some form of system or method for the evaluation to be purposeful. Kennerly & Neely (2002) presents a set of characteristics that is necessary for a performance measurement framework. The characteristics are:
1. The system should reflect efficiency and effectiveness measures and therefore reflect financial and non-financial measurements as well as internal and external measurements. The idea is to provide a "balanced" picture of the business.
2. The system should provide an easy to understand overview of the organisation’s performance 3. The system should measure all areas of performance that are vital to the organisation’s success,
meaning the system must be "multi-dimensional".
4. The system should provide a picture of the organisation in order to make it able to identify areas where there is need of a greater focus. Giving the managers and stakeholder comprehensiveness.
5. The system should be an integral part of the organisation’s functions and throughout the hierarchy.
6. The system should show that the results are a function of the determinates. And therefore, it will be possible for management and stakeholder not only to get a correct historical picture but also using the system to plan the future.
14
These characteristics have been broadened and developed in later literature to include more factors and criteria, thus giving a broader perspective. Cocca and Alberti (2010) present a wider set of design characteristics for use when designing a PMS.
1. Performance Measurement Characteristics:
a) Derived from strategy
b) Link operation to strategic goals c) Simple to understand and use d) Clearly defined / explicit purpose
e) Stimulates continuous improvement / right behaviour f) Relevant and easy to maintain
g) Monitoring past performance h) Planning future performance i) All stakeholders considered j) Promote integration
k) Defined formula and source of data
2. PMS design requirements:
a) Strategic objective identification
b) Top management support / commitment c) Key users / employee involvement / support d) Facilitator
e) Maintenance structure f) Targets / Benchmark settings g) Timescale settings
h) A responsible for the measurement i) Alarm signal / corrective actions j) Double loop learning
k) Relationship between measures
l) Linking performance to compensation process m) Procedures defined
n) IT infrastructure support
A PMS intended for non-profit organisations, such as museums, will be more difficult to design since their goals are more complex than for a for-profit organisation (Paulus, 2003). In order to design a PMS for museums Paulus (2003) presents five design demands that need to be fulfilled and how to fulfil them:
• Validity. Paulus (2003) proposes that the following characteristics must be included in order for the PMS to be valid:
o Multidimensionality o Role of employees o Value of collection o Future generations
• Reliability. In order for a PMS for museums to be reliable, it is necessary for the system to be coherent and deliver the same result if no variables are changed. The system should also have a high level of sensitivity and precision.
• Feasibility. Describes how possible it is to perform the activity
• Externality: In order to keep the system reliable, it is necessary to involve a third party in either the collection of data or the evaluation. This should be done in order to avoid self-evaluation.
15
• Synthesis. A good PMS for museums should also synthesise the data rather than letting the user do this. This is done in order to minimise personal subjectivity.
2.3.3 The Balanced Scorecard
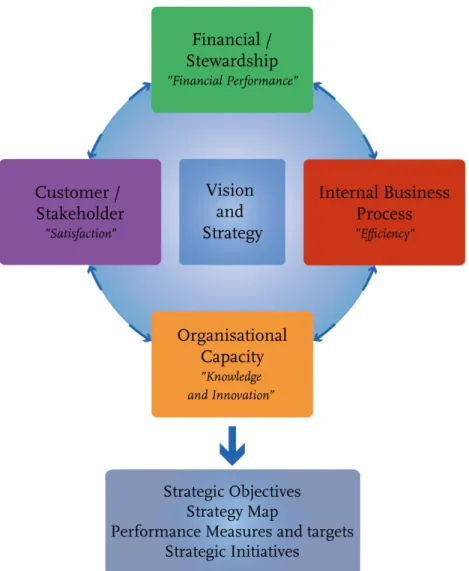
The Balanced Scorecard (BSC) was created and further developed by Kaplan and Norton (1992, 1996 and 2001) as a performance measurement tool that was multidimensional and taking more than financial result into account. It is intended to give the managers a tool for evaluating the organisation and if it is performing in accordance with the set strategy (Kaplan & Norton, 1992; Kaplan & Norton, 1996). To achieve this, it is necessary for the organisation to identify a mix of performance drivers and the outcome to measure (Kaplan and Norton, 1996). Kaplan and Norton (1992) also intended to make the system easy to use and to give the managers a comprehensible number of measurements that still gives a good picture of the whole organisation (Kaplan & Norton, 1992).
BSC introduced in 1992 uses four different perspectives of an organisation’s performance. The first three perspectives are non-financial: the customer perspective, internal perspective and the innovation and learning perspective. The fourth perspective, the financial perspective offers insights into economic aspects for the organisation (Kaplan & Norton, 1992). In the articles regarding BSC, Kaplan and Norton (1992, 1996) stresses the importance of detailing each organisation’s own unique situation when deciding which KPIs to measure. The customer perspective, Kaplan and Norton (1992) argues, involves the lead time before the customer can have the product but also the quality of the product delivered to them. The performance of the organisation and also the services provided is a part of the customer perspective. The last part of the customer perspective is cost (Kaplan & Norton, 1992).
The internal perspective of the BSC is the activities the organisation must excel at in order to excel at the previously mentioned customer perspective (Kaplan & Norton, 1992). The internal perspective measures the operations of the organisation and how it runs. Therefore, the organisation needs to identify KPIs that measures the core competencies and technical skills that are needed to achieve the organisation’s goals. Examples of these KPIs could be cycle time, productivity and quality (Kaplan & Norton, 1992).
In order for the organisation to adapt to a changing market and bring new products to a more discerning customer base, it is, according to Kaplan and Norton (1992), necessary to measure the performance of the organisation’s innovation and learning. This measurement could be done by using KPIs such as the number of sales of new products or the time to market for a new product.
The fourth perspective in the BSC model is the financial perspective. In the article where BSC is presented Kaplan and Norton (1992) criticises the use of financial KPIs arguing that they are short term and do not give a fair perspective on how the organisation is actually performing. However, Kaplan and Norton (1992) further argues that the financial perspective needs to be included into the BSC model as it is of equal importance as the other perspectives for the organisation. It is necessary to find financial KPIs that show relevance to the KPIs in the other perspectives of the BSC in order to be able to see how the changes made are changing the financial situation for the organisation (Kaplan & Norton, 1992; Kaplan & Norton, 1996). The BSC and its perspectives are presented in Figure 2 below.
16
Figure 2 The Balanced Scorecard (BSC) as developed by Kaplan and Norton (1992)
Since evaluating performance for non-profit organisations is different from evaluating for-profit organisations and the BSC is multi-dimensional, it is possible to adapt it for non-profit organisations. In 2001 Kaplan acknowledges that the BSC has successfully been used by non-profit organisations and support them by enhancing the BSC to incorporate non-profit organisations (Kaplan, 2001). Kaplan claims that by using BSC the non-profit organisations have been able to transfer their usually vague mission and strategy statements into functional day-to-day operations. "It has helped organizations avoid the illusion that they have a strategy because they are managing a diverse and noncumulative set of programs and initiatives." (Kaplan, 2001).
Lin, Yu and Zhang (2014) presents results of how BSC performed when used as a PMS for hospital administration in China. Positive impact and an increased effectiveness was found in the organisations using BSC and recommended an expansion of the trial runs (Lin et al. 2014). Grigoroudis, Orfanoudaki and Zopounidis (2011) adapted the BSM system for use in the Greek healthcare while using the UTASTAR algorithm for calculations in their BSM.
Zorloni (2012) adapted BSC for use in museums. In the article, it is clearly stated that it is necessary for the museums to have a clear mission to properly measure the performance against (Zorloni, 2012). From that mission, it will be possible to find the perspectives that are unique not only to the branch but also the organisation (Zorloni, 2012). From these perspectives, it is possible to acquire a few different Critical Success Factors (CSF) to measure. These CSF share many traits with KPI presented earlier and to minimise confusion this report will use the terminology KPI instead of CSF. In order to identify KPIs to measure, Zorloni (2012) conducted several interviews and presented a set of KPI areas which could be used and which covered the whole span of activities of a museum. Zorloni
17
(2012) further defines four perspectives to use in a balanced scorecard model for museums. These are:
• Intellectual: This perspective is about the stewardship of the collection, but also the scholarship and development of new knowledge. Whereas the stewardship can be viewed as an internal dimension and the scholarship and new knowledge can be viewed as an external perspective.
• Public: The public perspective relates to the museum’s relationship with the community it dwells within. It is also about the museum’s activities, such as lectures and visitor services which are aimed at the public.
• Governance and financial: All organizations need to be held accountable for its use of resources and museums are no different. In order to keep the public trust, the museum needs to use its resources toward its mission in an efficient matter.
• Learning and growth: In order to build an organisational culture that aligns with the mission it is necessary to adopt a perspective that focuses on organisational learning. Meaning that apart from providing equal opportunity it is accountable, transparent and agile.
2.3.4 Weighted Strategic Policy Matrix
Gilhespy (1999) presents an unnamed evaluation method and several KPIs to be used by museums. Due to the content of the method where policies are weighted against each other and placed in a matrix, the authors of this report have chosen to call it the Weighted Strategic Policy Matrix. The model is based on the organisation’s mission transformed into policy objectives (Gilhespy, 1999). The chosen policy objectives where:
• Access maximization: As many as possible should have access to the organisation, including disabled, elderly and young, but it also includes new users.
• Attendance maximization
• Diversity/Multiculturalism: Apart from the artistic activities it also includes content aimed at groups who are generally not heard within the community.
• Economy maximization
• Education: Apart from classes and workshop, conversation activities could be considered a part of this policy objective.
• Excellence/quality: This Policy objective should include artistic quality and be quantitatively measured by the management group. But it is necessary to devise an in a subjective method for how the measurement should be made.
• Innovation: This policy objective share similarities with Research and Development in for-profit organisations. Meaning that the output is hard to measure. But according to Gilhespy (1999), it is necessary for the management to devise a method of measurement.
• Revenue Maximization: Apart from funding from the governmental funders it should include other external funders like sponsors, but also internal funding like sales of service and merchandise should be included.
• Service Quality maximization: Like Excellence, the quality of service provided is hard to measure but still necessary.
• Social Cohesion: Gilhespy (1999) defines this policy objective as being part of the democratic society.
The core idea of the method is not only to measure the policy objectives but accepting that some of them are in opposition to each other (Gilhespy, 1999). Therefore, there is a need to weight them against each other based on the mission of the organisation. The weighting uses standard economic weighting based on the sum of all weighted policy objectives comes to 100 % or 1. By defining the measured score of the policy objective as y and the weighting as x the weighted sum of the policy objective will be xy. This weighting makes it possible to decide the importance of the different policy
18
objectives (Gilhespy, 1999). This, in turn, will make it possible to alter the organisation’s behaviour in the future.
2.3.5 Data Envelopment Analysis (DEA)
DEA is a method of evaluating the efficiency of an organisation by using linear programming. By finding a quantitative value for the organisation and comparing it against other organisations is it possible to find an efficiency frontier. All organisations that do not reach the efficiency frontier are defined as inefficient (Basso & Funari, 2004). In order to find the efficiency value in DEA it is necessary to set up a mathematical formula where as one of the easiest formulas is Farrell’s productivity efficacy, presented 1957 (Basso & Funari, 2004):
𝑃𝑟𝑜𝑑𝑢𝑐𝑡𝑖𝑣𝑖𝑡𝑦 = 𝑜𝑢𝑡𝑝𝑢𝑡/𝑖𝑛𝑝𝑢𝑡
This formula can later be adapted with more variables in order to cover more variance and give a broader picture.
Although the method had previously never been tried for measuring the efficiency of museums it has had extensive use for measuring the efficiency of public administration (Basso & Funari, 2004). In 2009, the method of DEA was for the first time tried out for measuring the efficiency of 76 museums in Spain. By using the variables: staff, size(rooms), size (m2), Equipment, winter opening hour, summer opening hour, admission, social impact, collection impact and visitors, it was possible to organise the museums in relativity similar clusters. By using the variables above the researchers calculated the museum’s function including for example staff and collection. From there the researchers could use the number of visitors as a part of the mathematical formula. By using the DEA method, the researchers concluded that it was possible to use the method to acquire a measurable efficiency ratio for museums and using these to calculate an efficiency frontier to measure against (Barrio et al. 2009).
19
3
Research Methods and Process
The purpose of this study was to find out how non-profit cultural organisations can evaluate their operations and measure performance and to suggest a model adapted for this type of organisation. The overarching topic in the frame of reference and the theoretical foundation in this report is Operations Management (OM) and the suggested model that is the practical outcome of the work is intended as an aid to improve operations and support management.
OM research is to a high degree focused on problem-solving that creates knowledge based on solutions to practical managerial problems (van Aken, Chandrasekaran, & Halman, 2016). There is an ongoing debate regarding research paradigms and their respective superiority for certain research (Burke & Onwegbuzie, 2004) where the two main research paradigms are positivism and social constructionism (Easterby-Smith et al. 2015). For this study, a third paradigm, Pragmatism, was chosen as the philosophical starting point of the research design. It was deemed an appropriate way to design a study where the key objective and outcome is to suggest a theoretical model with practical implications.
Pragmatism is a philosophical perspective where the emphasis is on the impact of the findings and generated theory rather than the ontological and epistemological debate. It is a philosophy that offers a practical and logical alternative where it attempts to combine insights from quantitative research as well as qualitative research. It offers researchers a method to use mixed methodology when designing a study. This allows researchers to gain insights and procedures both from quantitative and qualitative approaches (Burke & Onwegbuzie, 2004).
It is a commonly used approach in engineering research to go for a pragmatic or mixed methods approach, combining several different methods of data collection with the objective to design a solution to a problem (Hevner, March, Park, & Sudha, 2004). This is what is referred to as Design Science Research (DSR) and can be an appropriate approach also in OM research when the desired objective is to improve present operations and develop generic knowledge about organisational improvement by applying engineering research strategies.
3.1 Design Science Research (DSR)
DSR is not a specific research method, rather a strategy on how to combine and use other research methods to get the desired outcome and design a product intended to solve the problem for the actual study (van Aken et al. 2016). DSR is a fundamentally multidisciplinary research strategy with a pragmatic approach to solving a problem, commonly used by engineers. DSR researchers are interested in creating an artefact that by solving a practical problem also explains it and thus generates knowledge (Holmström & Ketokivi, 2009).
DSR is not the most commonly used strategy in social sciences research to which OM belongs but it is nevertheless an appropriate and relevant strategy than can be used when conducting research in the OM field. OM research is usually modelled after the natural sciences and the humanities but this research base has received criticism for lacking relevance for practice and being fragmented. DSR is made relevant for OM research by producing knowledge aimed at designing solutions for organisational problems (van Aken & Romme, 2009).
OM is a research discipline where generic knowledge is created by interacting with the real world and solving practical management problems (van Aken et al. 2016) and DSR is about finding and designing solutions to practical problems in a systematic manner (Holmström & Ketokivi, 2009). DSR can be viewed as a way to bridge theory to practice rather than the other way around (Holmström & Ketokivi, 2009). O’Keefe (2014) argues that DSR is a viable method within the field of OM research when the focus is on design.
There are examples of where a DSR approach have been successfully used for OM research. One of the most well-known cases is the systematic development of Activity Based Costing and the Balanced Scorecard Model by Robert Kaplan and his colleagues (Holmström & Ketokivi, 2009).
20
Hevner et al. (2004) present a conceptual framework for Information Systems (IS) research where they combine behavioural-science and design-science paradigms. This framework includes seven guidelines to follow when applying DSR. These guidelines are applicable for this study since the aim is to suggest a model for performance evaluation and that can be considered an artefact as discussed by Hevner et al. (2004). An essential aspect in DSR is that anything that embodies knowledge can be regarded as an artefact (O'Keefe, 2014).
Table 1 Design Science Research Guidelines
Guideline Description
Guideline 1: Design as an Artefact Design science research must produce a viable artefact in the form of a construct, a model, a method or an instantiation.
Guideline 2: Problem Relevance The objective of design science research is to develop technology-based solutions to important and relevant business problems.
Guideline 3: Design Evaluation The utility, quality and efficacy of a design artefact must be rigorously demonstrated via well-executed evaluation methods.
Guideline 4: Research Contributions Effective design science research must provide clear and verifiable contributions in the areas of the design artefact, design foundations, and/or design methodologies.
Guideline 5: Research Rigor Design science research relies upon the application of rigorous methods in both the construction and evaluation of the design artefact.
Guideline 6: Design as a search process The search for an effective artefact requires utilising available means to reach desired ends while satisfying laws in the problem environment.
Guideline 7: Communication of Research Design science research must be presented effectively both to technology-oriented as well as management-oriented audiences.
(Hevner et al. 2004)
The guidelines take into consideration both the environment the designed artefact is intended for as well as the existing knowledge base. Organisational needs are combined with applicable knowledge in the development phase. These guidelines were used for the research design and outlining the research process, how each guideline contributed to the process is illustrated in Table 1.
21
Table 2 Use of the DSR guidelines by Hevner et al. (2004) in the research process
Guideline How the guideline was used in this study
Guideline 1: Design as an Artefact The artefact designed in this study is the evaluation model presented in chapter 4.
Guideline 2: Problem Relevance The results from the survey and interviews served to prove relevance for the research and that there is a use-case for the proposed evaluation model.
Guideline 3: Design Evaluation The evaluation model was tested with input data from several museums as described in section 4.6. This was then compared to a fictional organisation with goals set on the base of the new museum law that is described in section 2.2.
Guideline 4: Research Contributions The literature review showed that there is little researched and written regarding performance evaluation for non-profit cultural organisations. This study contributes to that field.
Guideline 5: Research Rigor The research process was structured and methodical as described in Figure 3. Data collection and data analysis were conducted scientifically and with rigor. The response rate of the survey was high, see 4.2 and interviews were performed to triangulate and confirm initial model findings.
Guideline 6: Design as a search process The model was developed as a continuous process starting with theories taken from the literature review and adapting to context after input from results of the survey and the interviews. A combination of information from the different steps of data collection was used jointly to develop with the model presented in section 4.5.
Guideline 7: Communication of Research The practical and managerial implications of the study are described in section 5.5 of this report.
3.2 Research Design and Process
Guideline 6 describes the design process as an iterative process searching for the best or optimal design. A test cycle where the design is generated and tested and improved is described as a method to discover an effective solution to a problem (Hevner et al. 2004). This iterative way to design an artefact was part of the research design and a way to come up with the model. As a result of the initial literature review, the Balanced Scorecard was chosen as the base for the model. Input from the survey result and the interviews were then used to adapt the content of the model to the setting of Swedish museums.
Hevner et al. (2004) describe several methods that can be used when iterating the design and evaluating the model. Several of the mentioned methods can be used for OM research and this particular study in the design process.
22
• Descriptive evaluation method in form of Informed Argument. As mentioned, the literature review was used to create a knowledge base in order to build a convincing argument for the configuration and usability of the suggested model.
• Analytical evaluation method in form of Static Analysis, Optimisation and Dynamic Analysis. A survey was sent out to Swedish museums with the intent to find out how they currently evaluate performance and what factors and criteria are important to include in a model when designing it. The analytical evaluation of the model was done by using the responses from the survey for the first round of iteration of the model and its qualities and features. • Functional and structural testing of the model is part of the evaluation process in order to
ensure the design and the functionality.
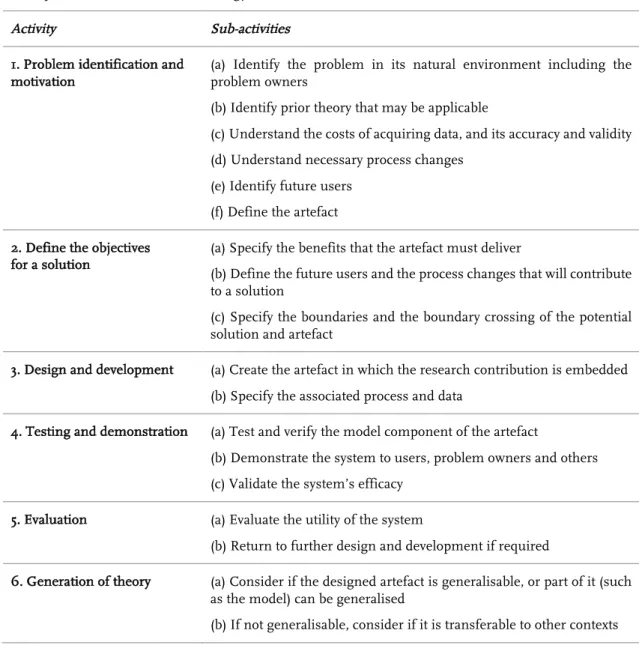
O’Keefe (2014) proposes, as illustrated in Table 3, a Design Science methodology for design-oriented Operational Research that served as the base for the research design of this study.
Table 3 O'Keefes DSR methodology
Activity Sub-activities
1. Problem identification and motivation
(a) Identify the problem in its natural environment including the problem owners
(b) Identify prior theory that may be applicable
(c) Understand the costs of acquiring data, and its accuracy and validity (d) Understand necessary process changes
(e) Identify future users (f) Define the artefact
2. Define the objectives for a solution
(a) Specify the benefits that the artefact must deliver
(b) Define the future users and the process changes that will contribute to a solution
(c) Specify the boundaries and the boundary crossing of the potential solution and artefact
3. Design and development (a) Create the artefact in which the research contribution is embedded (b) Specify the associated process and data
4. Testing and demonstration (a) Test and verify the model component of the artefact
(b) Demonstrate the system to users, problem owners and others (c) Validate the system’s efficacy
5. Evaluation (a) Evaluate the utility of the system
(b) Return to further design and development if required
6. Generation of theory (a) Consider if the designed artefact is generalisable, or part of it (such as the model) can be generalised
23
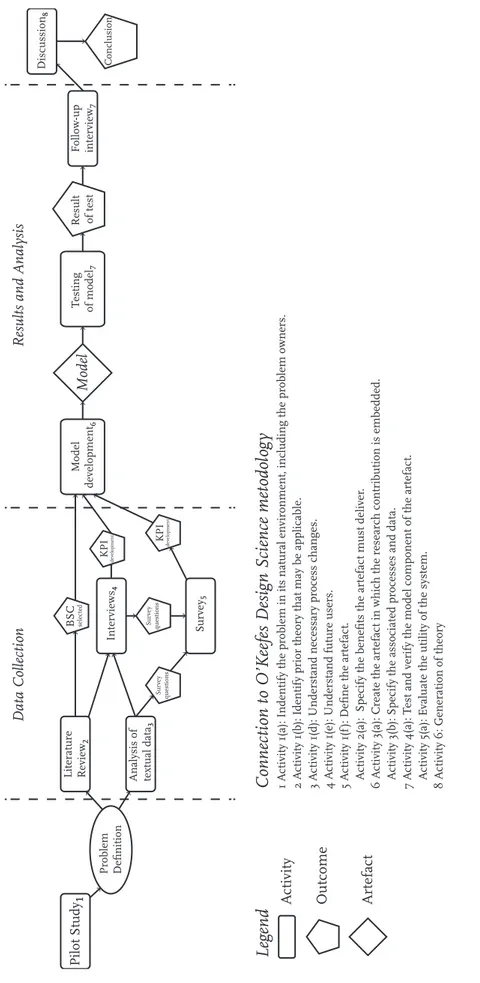
The research design was as previously stated of a mixed methods character where each method contributed with additional knowledge and aid towards reaching the goal of the study. The process is illustrated in Figure 3 and each element is described in further detail in the sections below1.
24
Figure 3 Research process design
Conclusion P ilot Study ₁ Lit erature Review ₂ Problem De fi nition
Analysis of textual data
₃ Int erviews ₄ Su rv ey ₅ Surve y questions BSC selec ted Surve y questions KPI development KPI development M odel development ₆ Model Testing of m od el ₇ Result of t est Follow-up int erview ₇ Discussion ₈
Results and Analysis
Data Collec tion Legend A ctivity Out come Art efac t C on ne ct io n t o O ’K ee fe s D es ig n S ci en ce m et od ol og y 1 A
ctivity 1(a): Indentify the problem in its natural en
vironment
, including the problem owners.
2 A ct iv it y 1 (b ): I de n ti fy p ri or th eo ry th at m ay b e a pp lic ab le . 3 A ct iv it y 1 (d ): U n de rs ta n d n ec es sa ry p ro ce ss c ha n ge s. 4 A
ctivity 1(e): Understand future users.
5 A ctivity 1(f ): De fi ne the art efac t. A ct iv it y 2 (a ): S pe ci fy th e b en efi ts th e a rt ef ac t m us t d el iv er . 6 A ct iv it y 3 (a ): C re at e t he a rt ef ac t i n w hi ch th e r es ea rc h c on tr ib ut io n is e m be dd ed . A ct iv it y 3 (b ): S pe ci fy th e a ss oc ia te d p ro ce ss es a n d d at a. 7 A ct iv it y 4 (a ): T es t a n d v er if y t he m od el c om po n en t o f t he a rt ef ac t. A ctivity 5(a): E valuat
e the utility of the syst
em.
8 A
ctivity 6: G
25
3.2.1 Analysis of Secondary Textual Data
Secondary textual data are written sources of information that may be of relevance for a research project even though the main purpose of writing them was not research. This type of data may include archival data, government reports, articles and books (Easterby-Smith et al. 2015).
Secondary textual data has been used in order to better understand the particular settings of a Swedish museum. Some of the material used to build this knowledge is:
• Referrals from the Swedish government to the council of legislation with suggested law concerning cultural heritage.
• Reports from the authority for cultural analysis. • Annual reports from Swedish museums
• Program declarations from Swedish Museums including vision and mission statements as well as organisational strategies.
The textual data was necessary as it provided essential information about Swedish museums which has a central role in this study.
3.2.2 Survey
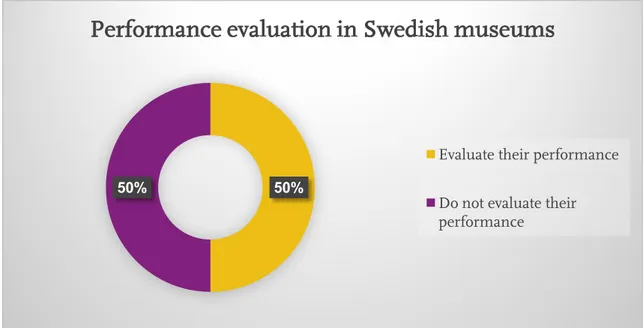
Surveys are often used for hypothesis testing (Easterby-Smith et al. 2015) but that was not the main purpose of the survey performed for this study. The preconceived thoughts regarding the lack of performance evaluation at Swedish museums can be considered a hypothesis that the survey did confirm. The motivation for using a survey for this study was to obtain as many answers as possible to the important questions for the study, obtaining this information from interviews would have been too time-consuming and not possible. The survey was used to determine if performance evaluation is important for Swedish museums, the level of standardisation of this measurement and whether a structured method was being used.
The survey used in this study served two purposes. First, it answered to what extent and how Swedish museums currently evaluate their performance from an organisational perspective. Secondly, it provided insights into what factors and criteria are important for their organisations and thus important to include in a suggested evaluation model.
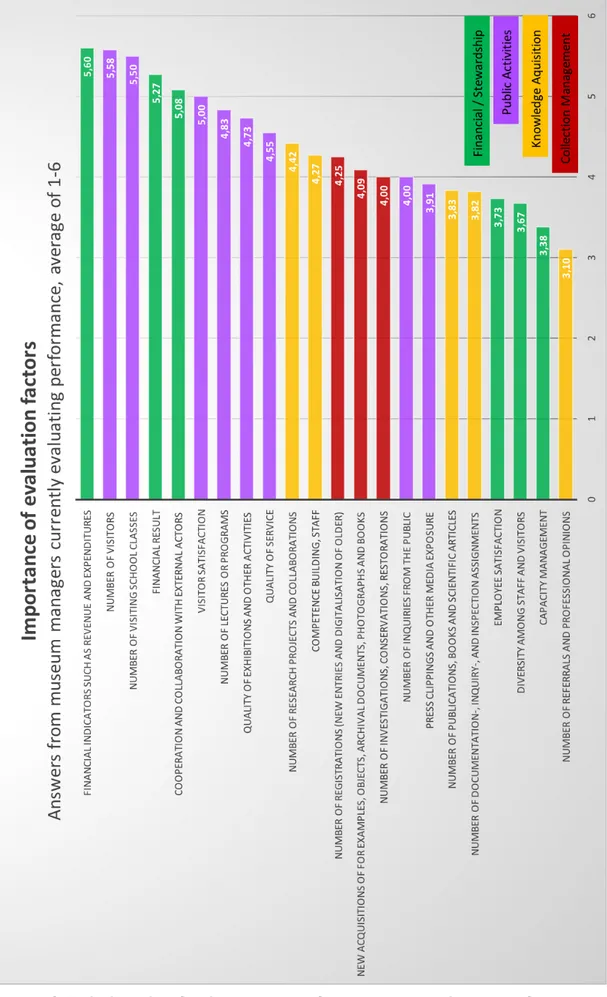
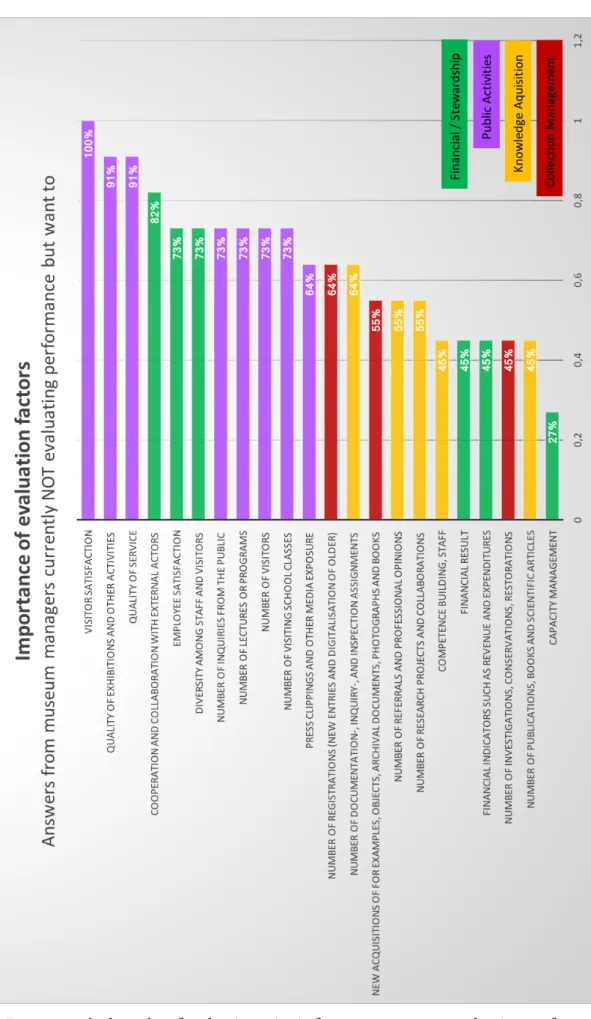
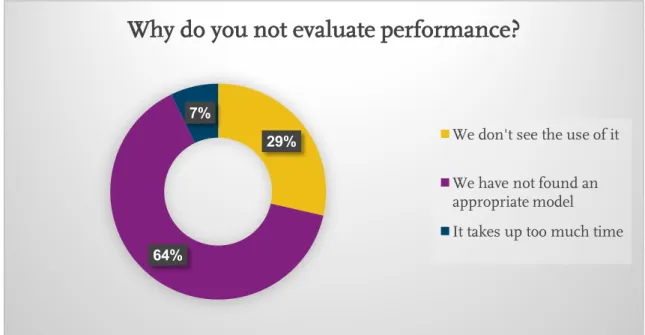
The survey was designed to fulfil these two purposes. First, respondents had to answer whether they do evaluate their organisational performance and if so, what type of method is being used. The group of respondents who answered that they do evaluate where further given follow-up questions on how they used the result of their evaluation and what factors and criteria are important to include when evaluating performance. The respondents currently not evaluating organisational performance by a specific method where asked why not, if they would like to start doing it and if so what factors and criteria they would want to have included in a model. For all questions, see Appendix 2.
With that purpose and the configuration of the survey, it can be classified as a descriptive survey according to Pickard (2013). A descriptive study is performed with the purpose to describe a situation and look for patterns within the group that is used as sample (Pickard, 2013). In a descriptive survey, the sample size has to be sufficient to represent the population of interest and the return rate ought to be more than 50% of the population under investigation (Dresch, Pacheco Lacerda, & Valle Antunes, 2015).
3.2.2.1 Choice of respondents
The respondents in the survey were selected from the museums listed by the authority for cultural analysis (Kulturanalys, 2016). These are all museums that receive governmental funding. The survey was sent to managers in the respective museum and the survey was limited to central and regional museums. As the total population and possible respondents for this survey were 51 persons it was