AUGMENTED REALITY FOR ENCOURAGING ENVIRONMENTALLY
SUSTAINABLE BEHAVIORS: A SURVEY
Taufik Akbar Sitompul
1,2Markus Wallmyr
1,2(1) School of Innovation, Design and Engineering, Mälardalen University, Västerås,
Sweden
(2) CrossControl AB, Västerås, Sweden
e-mail:
{taufik.akbar.sitompul; markus.wallmyr}@mdh.seKeywords (augmented reality, environmental sustainability, visualization, survey)
Can virtual information be used to deal with unsustainable behaviors? This paper reviews possible uses of augmented reality with the purpose to encourage users towards environmentally sustainable behaviors. We find that, although the amount of examples is still limited, augmented reality is both directly and indirectly usable to encourage users towards behaviors that are environmentally sustainable.
1. Introduction
Since the publication of a report called “Our Common Future” by the World Commission on Environment and Development in 1987, sustainable development has become a global trending topic and more attention is being given to the impacts of development projects on the environment
(SNEDDON; HOWARTH; NORGAARD, 2006). The report defines sustainable development as “development that meets the needs of the present world, without compromising the ability of future generation to meet their own needs” (WCED, 1987). The report serves as a warning signal since
unsustainable human activities pose risks for everyone at multiple scales (SNEDDON; HOWARTH; NORGAARD, 2006). One approach for achieving sustainable
development that has gained popularity is utilizing Information Technology (IT) (MANSELL; WEHN, 1998). As an example, the concept of Green IT is emerging, as it is seen as a potential solution to achieve sustainable development (FAUCHEUX; NICOLAÏ, 2011). However, it is important to note that IT can serve as a two-way street (MOLLA, 2009). On one way, it can accelerate the natural deterioration due to the increasing of power consumption and electronic waste. On the opposite way, it can be used to help us to address
environmental issues. As an example, IT can be used to monitor carbon footprints, which enables the users to measure the carbon footprints from their activities (PATERSON; STRIPPLE, 2010).
Hilty (2011) introduced three levels of
environmental effect caused by the usage of IT products. The primary effect is the environmental impact related to the physical existence of IT products, for instance, the increasing amount of electronic waste. The secondary effect refers to the indirect environmental impact due to the
transformation of human activities by using IT products, for example, higher efficiency in
manufacturing process. Lastly, the tertiary effect is the environmental impact that is caused by the users’ behavioral changes due to the availability of IT products. Depending on the way IT products are used, the impact on the environment can be good or bad.
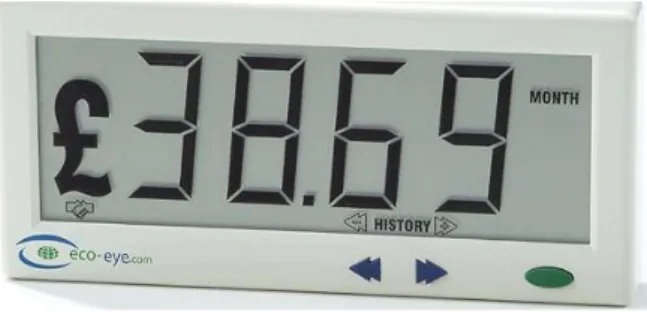
Speaking of the tertiary effect of IT, visualization is a technique that can be utilized to influence users’ behaviors (PANDEY et al., 2014). As an example, eco-visualization is a trending technology that can motivate sustainable behaviors, by revealing the energy consumption of the users (PIERCE; ODOM; BLEVIS, 2008). By making the users aware of the cost of their energy consumption, they are indirectly encouraged towards a more sustainable behavior (see Figure 1).
This paper attempts to find the potential of augmented reality (AR) related to environmental sustainability, as AR can also be considered as a visualization technique since it shows information that cannot be seen naturally with human senses. AR is also considered as a technology with much
Figure 1 – The Eco-Eye: displaying the price of current energy consumption in a household1
potential since it has been applied to various domains (KREVELEN; POELMAN, 2010; PAPAGIANNAKIS; SINGH; MAGNETAT-THALMANN, 2008; SZUCS; PAXIAN; LANYI, 2014). In this paper, we review the uses of AR that can be used for encouraging the users towards environmentally sustainable behaviors.
The rest of the paper is divided into six sections. Section 2 presents the debates among scholars regarding the aspects of sustainability and introduces the definition of environmental sustainability. Section 3 describes the state-of-the-art of AR. Section 4 presents the examples of AR applications that can both directly and indirectly encourage users towards environmentally sustainable behaviors. Section 5 and Section 6 respectively present the discussion and the conclusion of the study.
2. Sustainability
What does “being sustainable” or “sustainability” really mean? The term sustainability is widely used, we thus start with the definition from the dictionary. According to Oxford Dictionaries2 , sustainability means “the ability to be maintained at a certain rate or level”. However, this definition is broad and lacks of focus since the definition can be applied to anything. Moreover, there are also some debates among scholars on which aspects should be considered in terms of sustainability (HEINBERG, 2010; JOHNSTON et al., 2007; KUHLMAN; FARRINGTON, 2010).
Figure 2 shows four different diagrams that illustrate various aspects of sustainability that have been developed by several scholars. The top-left diagram illustrates sustainability as three concentric circles of economy, societly and ecology where ecology is the largest aspect of sustainability (GIBSON, 2001, 2006). The top-right diagram represents
1
www.eco-eye.com
2
en.oxforddictionaries.com/definition/sustainability
sustainability as three intersecting circles where ecology, society, and economy are equal aspects of sustainability (ELKINGTON, 1994). So far, the diagram of three aspects of sustainability is the most popular aspects of sustainability among scholars (BEBBINGTON; DILLARD, 2008; BONEVAC, 2010; GIBSON, 2001; KUHLMAN;
FARRINGTON, 2010). Other concepts also use different approaches to conceptualize sustainability. The bottom-left diagram is created by the
International Union for Conservation of Nature and Natural Resources (IUCN) and they emphasize around well-being. The diagram has two concentric circles and there are only two aspects of
sustainability where human well-being is the subset of ecosystem well-being (GUIJT; MOISEEV; PRESCOTT, 2001). The bottom-right diagram is created by the Canadian International Development Agency (CIDA) and it has five intersecting circles where ecology, society, economy, culture, and politics are equal aspects of sustainability (GIBSON, 2001, 2006).
Figure 2 – Diffent concepts of aspects of sustainability (GIBSON, 2006)
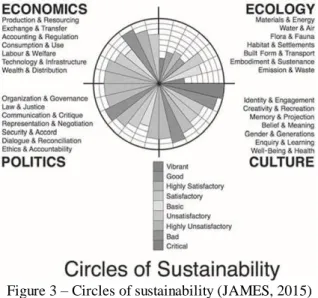
Although the diagrams in Figure 2 share common aspects, such as ecology, society and economy, they prioritize these aspects differently. The concentric circles indicate that some aspects of sustainability have higher priority over the others, while the intersecting circles indicate that all aspects of suistainability should be prioritized equally. The debates among scholars about aspects of sustainability do not end there. James (2015) introduced a new model with four-component sustainability circles and it is developed for the United Nations Global Compact Cities Programme (see Figure 3). This diagram is unique since it specifically emphasizes sustainability aspects in urban areas, instead of sustainability in the entire world. The circles look like a bridge between three-intersecting circles and five-three-intersecting circles of
sustainability. Unlike previous diagrams, the circles of sustainability clearly indicate smaller aspects of each component and how to rate them. In addition to that, Gibson (2001) also introduced his own aspects of sustainability where he divided sustainability into seven principles: integrity, sufficiency and
opportunity, equity, efficiency, democracy and civility, precaution, and immediate and long-term integration. Gibson considered the world as a big complex system where various domains are interconnected. It is also noticable that in Gibson’s seven aspects of sustainability, each aspect is not strictly tied to a specific domain.
Figure 3 – Circles of sustainability (JAMES, 2015)
Although there are some debates on what constitutes the aspects of sustainability, all scholars seem to agree that environment or ecology has to be included as one aspect of sustainability. As we can see, environment is the common theme in all diagrams that have been developed by various scholars. Then, what does environmental sustainability mean? The first definition of environmental sustainability was developed by Goodland (1995), which states that environmental sustainability “seeks to improve human welfare by protecting the sources of raw materials used for human needs and ensuring that the sinks for human wastes are not exceeded, in order to prevent harm to humans”. Goodland (1995) also defines few major activities that should be done in order to achieve environmental sustainability:
1. Renewable resources should be used within the regenerative capacitiy of the natural system that provides them.
2. The depletion rate of non-renewable resources should be set really low, thus giving humans enough time to create renewable substitutes. 3. The acceptable amount of waste emissions and
pollutants should be set within the assimilative capacity of the natural system, in order to prevent unacceptable damages to the natural system.
One way to use less resources and produce less waste is to be more aware of the consequences of our activities (BALLANTYNE; PACKER, 2005). To be aware of the amount of emission or resources we are using, we need a proper way to be informed and this moves us into the next section of the paper, which describes the state-of-the-art of augmented reality.
3. Augmented Reality
Augmented reality (AR) is a technology that overlays virtual objects into the physical
environment (CAUDELL; MIZELL, 1992). While virtual reality (VR) replaces the physical
environment with virtual environment, AR enhances the physical environment by adding virtual objects to it. Azuma (1997) has defined three basic requirements for a system to be qualified as an AR system:
1. Combine the real world and virtual objects. 2. Interactive in real time.
3. Registered in 3D.
The three basic requirements above are not only helpful in describing what makes a system an AR system, but also useful in describing the minimum technical requirements of an AR system
(BILLINGHURST; CLARK; LEE, 2015). An AR system should have at least following technologies, no matter which type of AR application that will be developed (BILLINGHURST; CLARK; LEE, 2015; CRAIG, 2013):
A display where the real world and virtual objects are combined.
A tracking system that locates the user’s position and viewpoint, and then determines where the virtual objects should be placed in the physical environment.
A computer system that generates virtual objects and processes the user’s input.
In addition to the technologies mentioned above, we also include processors and software as core
technologies of an AR system (BILLINGHURST; CLARK; LEE, 2015; CRAIG, 2013). The core technologies that enable an AR system are described in the following subsections.
An AR system needs a display in order to combine the computer-generated virtual objects with the real world. Currently, there are various types of displays available. These displays can be categorized based on the positioning and the approach used to combine the real world and virtual objects
(BILLINGHURST; CLARK; LEE, 2015; KREVELEN; POELMAN, 2010).
There are three types of AR displays based on the approach used to combine the real world and virtual objects: video-based displays, optical see-through displays, and projection-based displays
(BILLINGHURST; CLARK; LEE, 2015; KREVELEN; POELMAN, 2010). Video-based displays combine the real world and virtual objects through digital process. The view from the real world is captured using a video camera system, and then virtual objects are added into the captured view. Therefore, the user sees the combined view of both the real world and virtual objects on a screen. On the other hand, optical see-through displays present virtual objects on a transparent screen, while the user can see the real world directly. Optical see-through displays usually use beam splitters to project the virtual objects into a transparent screen where the images of virtual objects are reflected and can be seen by the user. The third type in this category is projection-based displays. Projection-based displays project virtual objects directly to the object of interest, such as walls, roads, or other physical objects. The projector is usually attached on a fixed position and the user can see the virtual objects without using any device.
AR displays can be further classified into three types, based on their positioning in relation to users: head-mounted displays, hand-held displays, and spatial displays (BILLINGHURST; CLARK; LEE, 2015; CRAIG, 2013; KREVELEN; POELMAN, 2010; ZHOU; BEEN-LIRN DUH;
BILLINGHURST, 2008). Head-mounted dipslays require users to wear a device on their head and the information is presented in line with users’ line of sight. Hand-held displays, as the name
implies, utilize devices that can be held by hands for displaying the virtual objects, such as smartphones and tablets. Spatial displays work in the same way as projection-based displays.
3.2. Tracking System
Generally, the tracking in an AR system consists of two phases (BILLINGHURST; CLARK; LEE,
2015). The first phase is locating the user’s position and viewpoint. The second phase is determining where the virtual objects will be displayed in the physical environment.
Currently, there are four types of tracking techniques that can be used: sensor-based tracking, vision-based tracking, global positioning system (GPS) tracking, and hybrid tracking (BILLINGHURST; CLARK; LEE, 2015; KREVELEN; POELMAN, 2010). The sensor-based tracking utilizes various types of sensors, such as magnetic, acoustical, optical, etc., to perform the tracking. The vision-based tracking performs the tracking based on the image processing of the environment surrounding the user. This technique requires a camera to see the physical environment and cues that serve as the landmark for determining the camera’s position and viewpoint. The GPS tracking relies on geographical positioning data obtained from satellites to determine the user’s position. The hybrid tracking employs several tracking techniques mentioned above
simultaneously. The hybrid tracking generally provides a more robust tracking system, which also resulting in a more stable and immersive experience. 3.3. Input and Interaction
In its essence, an AR system should be interactive (AZUMA, 1997). Therefore, an AR system should allow the user to give inputs for manipulating the given information. To accommodate this
requirement, there are five types of user interfaces that are commonly used in AR applications: 2D interfaces, 3D interfaces, tangible interfaces, natural interfaces, and multimodal interfaces
(BILLINGHURST; CLARK; LEE, 2015; BILLINGHURST; GRASSET; LOOSER, 2005; CRAIG, 2013; KREVELEN; POELMAN, 2010). 2D interfaces are the basic interface in AR applications and the user can make inputs mainly through a screen. 3D interfaces utilize 3D interaction techniques to manipulate the virtual objects. In order to do so, input devices that allow the user to perform six degrees of freedom (6DoF) are required.
Tangible interfaces use physical objects, which related to the context of the AR applications, in order to manipulate the virtual objects. Natural interfaces refer to using natural body motion, such as hand gestures, as the input of an AR system. Multimodal interfaces employ multiple types of interfaces in order to provide richer interaction. 3.4. Processors and Software
Processors are the brain in an AR system since they perform all computational works. In early AR applications, the processors were bulky and had limited processing capability (SUTHERLAND, 1968). Due to the advancement of technology, even small devices, such as smartphones and tablets, already have the processing capability to run an AR system (BILLINGHURST; CLARK; LEE, 2015; CRAIG, 2013). If more processing capability is required, the processing capability can be increased by sharing the computational workloads to a server via wireless connection (CRAIG, 2013).
Regardless of which type of hardware used in an AR system, the software is responsible for informing the hardware what, when, and how the operation is executed (BILLINGHURST; CLARK; LEE, 2015; CRAIG, 2013). There are four components of software technologies used in an AR system: environmental acquisition, sensor integration, application engine, and rendering software (CRAIG, 2013). The environmental acquisition software instructs the sensors to collect information from the real world. The sensor integration software
combines the information that has been collected in meaningful ways. The application engine is the core software that gathers the information that has been combined, processes the user’s inputs, and generates information for the rendering software. Lastly, the rendering software converts information from the application engine to graphics that will be shown in the displays.
4. The use of AR applications for
encouraging environmentally sustainable
behaviors
To identify applicable papers that describe the use of AR applications related to environmental
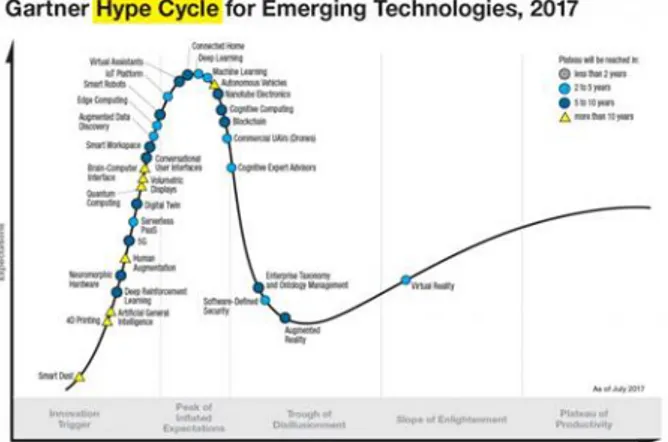
sustainability, we used Google Scholars and applied the criteria that the papers should contain following keywords: augmented reality, sustainable or sustainability, and environment or environmental. After that, a manual classification was done to determine whether the collected papers are suitable. Despite the growing popularity of AR, there is still a limited number of AR applications with a purpose to, directly or indirectly, encourage the users towards environmentally sustainable behaviors in the academic literature. This situation is not surprising since the technology itself is still maturing. In July 2017, Gartner3 predicted that it still takes 5 to 10 years for AR to reach the “plateau
of productivity”, where the true benefits of AR will be discovered (see Figure 4). Nonetheless, we still found seventeen AR applications that can be used to encourage environmentally sustainable behaviors. The AR applications are further categorized into three categories: environmental simulation, edutainment, and ambient awareness.
Figure 4 – Gartner’s Hype Cycle for Emerging Technologies 20173
4.1. Environmental Simulation
In general, all simulations can be considered as a tool that encourages sustainability (WIDOK; WOHLGEMUTH, 2011). By showing the possible effects of choosing certain conditions or courses of action, the simulation can aid people in making more environmental and productive decisions. However, the identified applications in this category are specifically designed to allow the users to predict the impacts of their actions in terms of
environmental sustainability. The applications in this category are mainly used for planning and decision making. There are five applications that belong to this category. Due to the functional similarities among the applications, this category can be further divided into two subcategories: building simulation and landscape simulation.
4.1.1. Building Simulation
The main use of the applications in this subcategory is for exploring alternatives when designing new buildings and examining existing buildings. Sheng et al. (2011) developed a simulation called Virtual Heliodon with the purpose to help architecture students in exploring alternative architectural designs that contribute sustainable characteristics of
3
www.gartner.com/smarterwithgartner/top-trends-in-the-gartner-hype-cycle-for-emerging-technologies-2017/
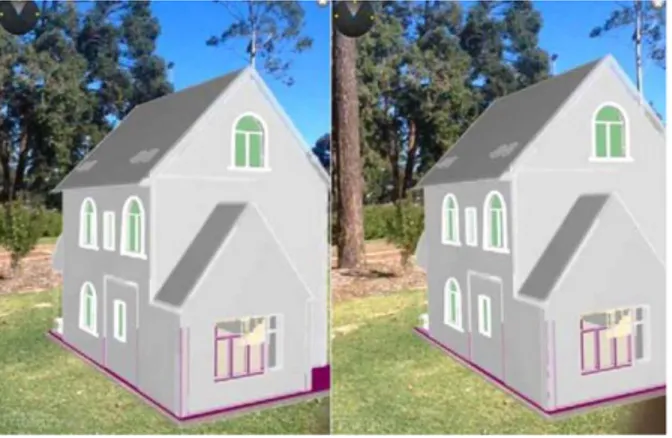
the buildings, for instance, utilizing natural light to reduce energy consumption. Virtual Heliodon is a projection-based AR application and users can manipulate the simulation by moving the markers that represent walls and windows. Wang et al. (2014) developed a simulation called BAAVS to help building planners to visualize the conceptual design of buildings on the physical environment (see Figure 5), thus they can make better decisions on certains aspects, for example, the harmony between the building and the landscape. BAAVS is a video-based AR application that can be installed in mobile devices, such as smartphones, and the visualization is displayed based on where the marker is placed.
Figure 5 – Visualizing the architectural design of a house in the physical environment (WANG et al., 2014)
Figure 6 – The comparison between the height of a physical building and the height of a virtual building
(YABUKI; MIYASHITA; FUKUDA, 2011)
Different from the previous applications, Yabuki, Miyashita, and Fukuda (2011) developed a simulation to evaluate the height of existing high-rise buildings. The purpose of the application is to assist in regulating the height of high rise buildings for maintaining good natural landscape. The
simulation is a video-based AR application and both large-size markers and head-mounted displays are required to see the visualization. The visualization
compares the height of physical buildings and the permittedheight, which is represented by virtual buildings (see Figure 6).
If the previous applications are used to simulate the whole building, the video-based AR application developed by Fukuda et al. (2018) is specifically to simulate the presence of plants in an indoor
environment and its impact on the thermal condition (see Figure 7). Placing plants in an indoor
environment is a common method for adjusting the thermal condition and this application can be used to help building owners or architects to decide where the plants should be placed to achieve better energy saving, especially during summer and winter. The visualization is shown where the markers are placed and users are required to wear a head-mounted display to see the visualization.
Figure 7 – The virtual objects on the ceiling represent the plants and the color gradient represents the temperature
difference (FUKUDA et al., 2018) 4.1.2. Landscape Simulation
Figure 8 – Projecting the spread of blackberries in different years to the physical environment
(GHADIRIAN; BISHOP, 2008)
This subcategory refers to AR applications that simulate the changes of landscape in order to enable better decision making. The only application in this
category is developed by Ghadirian and Bishop (2008) for visualizing the changes of the physical environment due to the spread of blackberry bushes over the time (see Figure 8). The panoramic videos are captured using multiple cameras in non real-time manner. The geographic information system (GIS) is then used to locate where the blackberry bushes will appear in the panoramic videos during different periods of time. As a projection-based AR application, this application uses a projector to project the panoramic videos into a wide-screen theatre.
4.2. Edutainment
In general, the use of AR in education is also related to entertainment since the main focus is not only educating the users, but also entertaining them (BILLINGHURST, 2002; PAPAGIANNAKIS; SINGH; MAGNETAT-THALMANN, 2008; WU et al., 2013). We therefore combined the applications in these two domains into one category called edutainment. The applications in this category promote environmental sustainability by educating users about environmental science and
environmentally sustainable behaviors. In addition, this category is also the most common use of AR for encouraging environmentally sustainable behaviors since it represents eight out of seventeen
applications that we found. Depending on the objective of the applications, edutainment as a category can be further divided into two
subcategories: general edutainment and persuasive edutainment.
4.2.1. General Edutainment
The applications in this subcategory are used to educate users on environmental science. Ryokai and Agogino (2013) developed a video-based AR application called GreenHat that is designed for undergraduate students. GreenHat can be used to help students not only in learning about biodiversity, but also environmental issues around them.
Greenhat utilizes geographical position information as the markers for displaying virtual objects, thus virtual objects are presented on the smartphone’s screen when the students are in predefined locations (See Figure 9). Kamarainen et al. (2013) also developed a video-based AR application called EcoMOBILE that helps middle school students to learn about environmental science during a field trip. There are two main functions of EcoMOBILE: displaying object-specific information on the
smartphone’s screen when students are in predefined
locations and enabling students to measure the quality of the water using a probeware. Similar to EcoMOBILE, Kamarainen et al. (2016) developed another video-based AR application called Atom Tracker. Atom Tracker is designed to help middle school students to understand the lifecycle of ecosystem, such as what happens to oxygens during respiration or photosynthesis processes. Although Atom Tracker is a location-based AR application, the visualization is triggered when the smartphone’s camera is facing to the labels that have been set up in the environment.
Figure 9 – The information is displayed to the students when they are in a specific location (RYOKAI;
AGOGINO, 2013)
If the previous applications in this subcategory are using mobile devices, following is a projection-based AR application called AR Sandbox that has been developed by some scholars at the University of California, Davis (UC Davis). AR Sandbox is originally designed to help students to understand geoscience processes, for example, how water streams can reshape the soil (REED et al., 2016). AR Sandbox uses a computer projected to impose the visualization on the sand and students can manipulate the visualization directly by moving the sand using their hands (see Figure 10). Due to its popularity, AR Sandbox has been adopted in more than 150 institutions around the world.
Figure 10 – Users use AR Sandbox at CHO, Leahy Center for Lake Champlain, US (REED et al., 2016).
4.2.2. Persuasive Edutainment
The applications in this subcategory are more persuasive in terms of encouraging environmentally sustainable behaviors since the goals are not only to educate users, but also to encourage them to take actions. Klopfer and Squire (2008) developed a video-based AR game called Environmetal Detectives, which is specifically designed for high school and college students. In the game, students can act as environmental scientists where they should investigate environmental issues around their campus by addressing the possible causes and the solutions of the issues. Environmental Detectives is a location-based game that can be played using pocket PCs. Similar to Environmental Detectives, Manning, Powers, and Pedisich (2012) also developed a video-based AR game called ChronoOps, where players act as agents from the future. Students should collect and analyze pieces of green technologies that are scattered in certain locations around the campus in order to save the future, while also trying to avoid enemy forces. ChronoOps is a location-based game that relies on GPS data from Google Maps and can be played using smartphones. Ayer, Messner, and Anumba (2013) developed a video-based AR application called ecoCampus, which aims to enable architecture students to explore and compare building materials in their designs in term of sustainability. ecoCampus is designed to be a game that can be installed in tablet computers and the visualization is triggered when the tablet’s camera is facing to the markers that are attached on the wall. In addition to receiving scores, students also get automatically-generated feedback on how they could improve their scores.
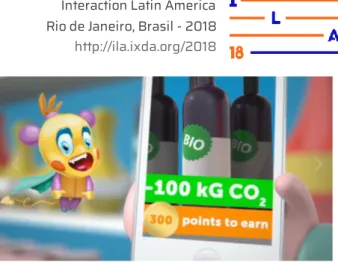
If the previous applications are designed for students, the following application is designed for general audience. An Austria-based company called Polycular developed an AR version of Tamagotchi called EcoGotchi4 , or ÖkoGotschi in German. Unlike Tamagotchi, EcoGotchi feeds on the reduced CO2 emission as the result of choosing
environmentally sustainable behaviors in daily life (see Figure 11). The higher amount of reduced CO2 emission means happier EcoGotchi. EcoGotchi is a video-based AR application that can be played using mobile devices, such as smartphones or tablets. 4.3. Ambient Awareness
4
www.ecogotchi.org
Figure 11 – A screenshot from the EcoGotchi’s promotional video that shows the reduced emmission of
CO2 by choosing ecological products5
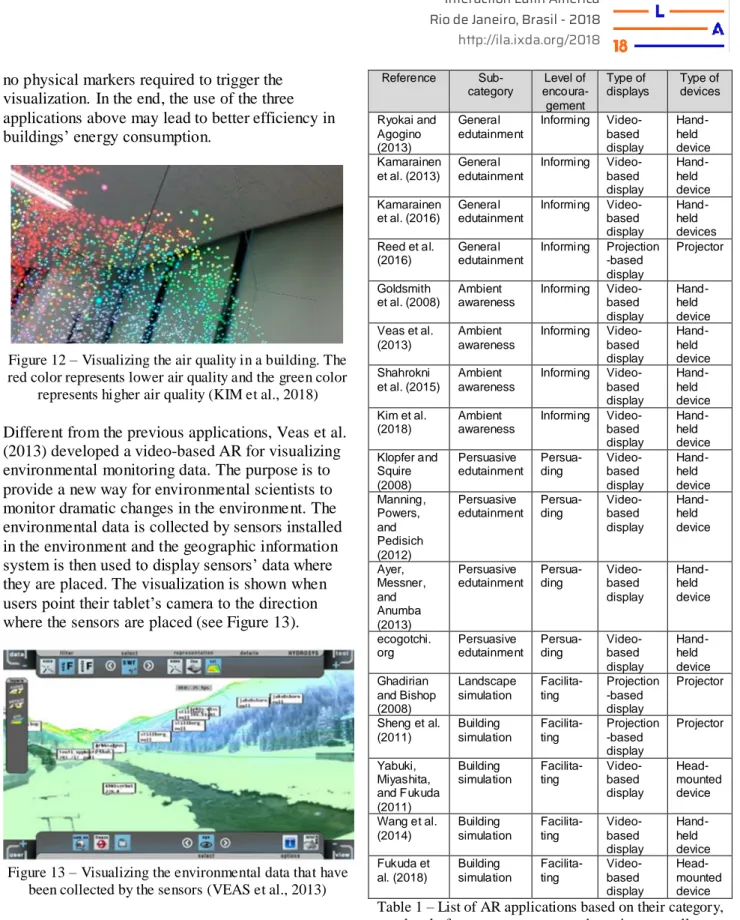
Unlike the previous two categories, the applications in this category do not encourage environmentally sustainable behaviors in a direct approach. Instead, the applications are designed to make the users aware of the results of their actions. However, it still completely depends on users whether they want to maintain or change their actions. In addition, with only four out of seventeen examples, this category has the least number of examples where AR is used to encourage environmentally sustainable behaviors. Goldsmith et al. (2008) developed a video-based AR application called SensAR. SensAR can be used to monitor the temperature and noise of an
environment. The data is collected through sensors in the environment, and then users can access the information using an ultra-mobile PC to scan markers that have been attached in the environment. Although the type of information that is collected is still limited, based on the displayed information, SensAR is still useful in helping users to decide whether it is appropriate to turn on the air conditioning system. Shahrokni et al. (2015) developed a video-based AR application called Smart Urban Metabolism (SUM), which can be used to visualize building performance indices, such as electric consumption, CO2 emission, and
consumption of renewable energy, of buildings in the Stockholm Royal Port. The visualization can be seen when users point their smartphone’s camera to the buildings. Kim et al. (2018) developed a video-based AR application to visualize the air quality and the movement in a building. Maintaining good quality of air is essential for human’s well-being, thus this application is useful since it can indicate the right situation for using the air purifier and visualize the effect of using the air purifier on the air quality (see Figure 12). The visualization can be seen with any mobile devices that have cameras and
5
no physical markers required to trigger the visualization. In the end, the use of the three applications above may lead to better efficiency in buildings’ energy consumption.
Figure 12 – Visualizing the air quality in a building. The red color represents lower air quality and the green color
represents higher air quality (KIM et al., 2018)
Different from the previous applications, Veas et al. (2013) developed a video-based AR for visualizing environmental monitoring data. The purpose is to provide a new way for environmental scientists to monitor dramatic changes in the environment. The environmental data is collected by sensors installed in the environment and the geographic information system is then used to display sensors’ data where they are placed. The visualization is shown when users point their tablet’s camera to the direction where the sensors are placed (see Figure 13).
Figure 13 – Visualizing the environmental data that have been collected by the sensors (VEAS et al., 2013)
5. Discussion
The presented categories of AR applications in the previous section can be ranked based on their level of encouragement towards behaviors that are environmentally sustainable (see Table 1). The first level is informing, which means the applications are used for informing users about the environmental status only, thus no concrete actions are required from them. The applications in the category of
Reference Sub-category Level of encoura- gement Type of displays Type of devices Ryokai and Agogino (2013) General edutainment Informing Video-based display Hand-held device Kamarainen et al. (2013) General edutainment Informing Video-based display Hand-held device Kamarainen et al. (2016) General edutainment Informing Video-based display Hand-held devices Reed et al. (2016) General edutainment Informing Projection -based display Projector Goldsmith et al. (2008) Ambient awareness Informing Video-based display Hand-held device Veas et al. (2013) Ambient awareness Informing Video-based display Hand-held device Shahrokni et al. (2015) Ambient awareness Informing Video-based display Hand-held device Kim et al. (2018) Ambient awareness Informing Video-based display Hand-held device Klopfer and Squire (2008) Persuasive edutainment Persua-ding Video-based display Hand-held device Manning, Powers, and Pedisich (2012) Persuasive edutainment Persua-ding Video-based display Hand-held device Ayer, Messner, and Anumba (2013) Persuasive edutainment Persua-ding Video-based display Hand-held device ecogotchi. org Persuasive edutainment Persua-ding Video-based display Hand-held device Ghadirian and Bishop (2008) Landscape simulation Facilita-ting Projection -based display Projector Sheng et al. (2011) Building simulation Facilita-ting Projection -based display Projector Yabuki, Miyashita, and Fukuda (2011) Building simulation Facilita-ting Video-based display Head-mounted device Wang et al. (2014) Building simulation Facilita-ting Video-based display Hand-held device Fukuda et al. (2018) Building simulation Facilita-ting Video-based display Head-mounted device
Table 1 – List of AR applications based on their category, level of encouragement towards environmentally sustainable behaviors, as well as type of displays and
devices
ambient awareness and the sub-category of general edutainment are in the first level. The second level is persuading, which means the applications are not only informing users, but also persuading them to take actions that may lead to more environmentally friendly behaviors. All applications in the sub-category of persuasive edutainment belong to the
second level. Moreover, the element of gamification in the persuasive edutainment can be utilized to shape a new perception that maintaining
environmentally sustainable behaviors can also be fun. Lastly, the third level is facilitating, which means the applications facilitate users to achieve better sustainability. The applications in both subcategories of simulation are in the third level. Usually, the users of a simulation already have some sustainable objectives in mind before using the simulation, and the simulation is facilitating them to determine which actions may lead to better
sustainability.
Regarding the technologies that are used, the combination of video-based displays and hand-held devices is the most common choice for AR
applications, since twelve out of seventeen AR applications utilize this combination (see Table 1). This situation is quite understandable since modern hand-held devices are powerful enough to run AR applications and hand-held devices are generally designed as video-based displays
(BILLINGHURST; CLARK; LEE, 2015).
Additionally, hand-held devices also provide good mobility and many people already own them, thus no new equipment is required. There are two AR applications that use the combination of video-based displays and head-mounted devices. Although users might not feel comfortable when wearing head- mounted devices, they allow the visualization to be displayed near users’ line of sight. Lastly, there are three projection-based AR applications. Projection-based AR applications do not provide mobility, but they provide much larger view since the
visualization is done using projectors.
6. Conclusion
There is a good indication that AR can be used to encourage users towards environmentally
sustainable behaviors, although the number of AR applications that fits the criteria is still limited. The examples also demonstrate that IT products can also be used to deal with unsustainable behaviors. Since AR is still an emerging technology and
environmental sustainability is still an important topic that needs to be addressed, we expect that there will be more AR applications that can encourage environmentally sustainable behaviors in the future. Additionally, since the technology itself is not mature yet, the possibilities where AR can be used to sustain our environment are still widely open for exploration.
7. References
AYER, S. K.; MESSNER, J. I.; ANUMBA, C. J. ecoCampus: A new approach to sustainable design education. International Conference on Construction Applications of Virtual Reality. London: 2013.
AZUMA, R. T. A Survey of Augmented Reality. In Presence: Teleoperators and Virtual
Environments, v. 4, n. August, p. 355–385, 1997. BALLANTYNE, R.; PACKER, J. Promoting environmentally sustainable attitudes and behaviour through free‐choice learning experiences: what is the state of the game? Environmental Education Research, v. 11, n. 3, p. 281–295, 2005. BEBBINGTON, J.; DILLARD, J. Social
Sustainability: An Organizational-Level Analysis. In: Understanding the Social Dimension of Sustainability. New York: Routledge, 2008. p. 157– 175.
BILLINGHURST, M. Augmented Reality and Education. New Horizons for Learning, p. 21(3) 195-209, 2002.
BILLINGHURST, M.; CLARK, A.; LEE, G. A Survey of Augmented Reality. Foundations and Trends® in Human-Computer Interaction, v. 8, n. 2, p. 73–272, 2015.
BILLINGHURST, M.; GRASSET, R.; LOOSER, J. Designing Augmented Reality Interfaces. ACM SIGGRAPH Computer Graphics - Learning through computer-generated visualization, v. 39, n. 1, p. 17–22, 2005.
BONEVAC, D. Is Sustainability Sustainable? Academic Questions, v. 23, n. 1, p. 84–101, 2010.
CAUDELL, T. P.; MIZELL, D. W. Augmented reality: An application of heads-up display technology to manual manufacturing processes. Proceedings of the 25th Hawaii International Conference on System Sciences. IEEE, 1992. CRAIG, A. B. Understanding Augmented Reality: Concepts and Appllications. San Francisco: Morgan Kaufmann Publishers Inc., 2013. ELKINGTON, J. Towards the Sustainable
Corporation: Win-Win-Win Business Strategies for Sustainable Development. California Management
Review, v. 36, n. 2, p. 90–100, 1994.
FAUCHEUX, S.; NICOLAÏ, I. IT for green and green IT: A proposed typology of eco-innovation. Ecological Economics, v. 70, n. 11, p. 2020–2027, 2011.
FUKUDA, T. et al. An indoor thermal environment design system for renovation using augmented reality. Journal of Computational Design and Engineering, 2018.
GHADIRIAN, P.; BISHOP, I. D. Integration of augmented reality and GIS: A new approach to realistic landscape visualisation. Landscape and Urban Planning, v. 86, n. 3–4, p. 226–232, 2008. GIBSON, R. Specification of Sustainability-based Environmental Assessment Decision Criteria and Implications for Determining “Significance” in Environmental Assessment. Ottawa: [s.n.]. GIBSON, R. Sustainability-Based Assessment Criteria and Associated Frameworks for
Evaluations and Decisions: Theory, Practice and Implications for the Mackenzie Gas Project Review. Waterloo: [s.n.].
GOLDSMITH, D. et al. Augmented Reality Environmental Monitoring Using Wireless Sensor Networks. 12th International Conference Information Visualisation. 2008.
GOODLAND, R. The Concept of Environmental Sustainability. Annual Review of Ecology and Systematics, v. 26, p. 1–24, 1995.
GUIJT, I.; MOISEEV, A.; PRESCOTT, A. IUCN Resource Kit for Sustainability Assessment. Gland: International Union for Conservation of Nature, 2001.
HEINBERG, R. What Is Sustainability? The Post Carbon Reader: Managing the 21st Century’s Sustainability Crises, p. 1–9, 2010.
HILTY, L. M. Information technology and
sustainability: Essays on the relationship between ICT and sustainable development. [s.l.] BoD - Books on Demand, 2011.
JAMES, P. Urban Sustainability. Abingdon: Routledge, 2015.
JOHNSTON, P. et al. Reclaiming the definition of
sustainability. Environmental Science and Pollution Research, v. 14, n. 1, p. 60–66, 2007. KAMARAINEN, A. et al. Atom Tracker: Designing a Mobile Augmented Reality Experience To Support Instruction About Cycles and Conservation of Matter in Outdoor Learning Environments.
International Journal of Designs for Learning, v. 7, n. 2, p. 111–130, 2016.
KAMARAINEN, A. M. et al. EcoMOBILE: Integrating augmented reality and probeware with environmental education field trips. Computers and Education, v. 68, p. 545–556, 2013.
KIM, M. et al. Augmented-reality visualization of aerodynamics simulation in sustainable cloud computing. Sustainability, v. 10, n. 5, 2018. KLOPFER, E.; SQUIRE, K. Environmental
detectives - the development of an augmented reality platform for enviromental simulations. Educational Technology Research and Development, v. 56, n. 2, p. 203–228, 2008.
KREVELEN, D. W. F. VAN; POELMAN, R. A Survey of Augmented Reality Technologies, Applications and Limitations. The International Journal of Virtual Reality, v. 9, n. 2, p. 1–20, 2010.
KUHLMAN, T.; FARRINGTON, J. What is sustainability? Sustainability, v. 2, n. 11, p. 3436– 3448, 2010.
MANNING, A.; POWERS, R.; PEDISICH, X. Better Learning Though Augmented Reality: AR in the Classroom. Anthós, v. 4, n. 2, 2012.
MANSELL, R.; WEHN, U. Knowledge societies: Information technology for sustainable
development. Oxford: Oxford University Press, 1998.
MOLLA, A. Organizational Motivations for Green IT: Exploring Green IT Matrix and Motivation Models. Proceedings of the Pacific Asia Conference on Information Systems (PACIS) 2009. Hyderabad: Association for Information Systems, 2009.
PANDEY, A. V et al. The Persuasive Power of Data Visualization. Visualization and Computer
Graphics, IEEE Transactions on, v. 20, n. 12, p. 2211–2220, 2014.
PAPAGIANNAKIS, G.; SINGH, G.; MAGNETAT-THALMANN, N. A survey of mobile and wireless technologies for augmented reality systems. Computer Animation and Virtual Worlds, v. 19, n. 1, p. 3–22, 2008.
PATERSON, M.; STRIPPLE, J. My space: Governing individuals’ carbon emissions.
Environment and Planning D: Society and Space, v. 28, n. 2, p. 341–362, 2010.
PIERCE, J.; ODOM, W.; BLEVIS, E. Energy aware dwelling. Proceedings of the 20th Australasian Conference on Computer-Human Interaction Designing for Habitus and Habitat - OZCHI ’08. Cairns: ACM, 2008.
REED, S. et al. Augmented Reality Turns a Sandbox into a Geoscience Lesson. Eos, 2016.
RYOKAI, K.; AGOGINO, A. Off the paved paths: Exploring nature with a mobile augmented reality learning tool. International Journal of Mobile Human Computer Interaction, n. 2, p. 21–49, 2013.
SHAHROKNI, H. et al. Implementing smart urban metabolism in the Stockholm Royal Seaport: Smart city SRS. Journal of Industrial Ecology, v. 19, n. 5, p. 917–929, 2015.
SHENG, Y. et al. A spatially augmented reality sketching interface for architectural daylighting design. IEEE Transactions on Visualization and Computer Graphics, v. 17, n. 1, p. 38–50, 2011. SNEDDON, C.; HOWARTH, R. B.; NORGAARD, R. B. Sustainable development in a post-Brundtland world. Ecological Economics, v. 57, n. 2, p. 253– 268, 2006.
SUTHERLAND, I. E. A head-mounted three dimensional display. Proceedings of the December 9-11, 1968, fall joint computer conference, part I on - AFIPS ’68 (Fall, part I). San Francisco: ACM, 1968.
SZUCS, V.; PAXIAN, S.; LANYI, C. S. Augmented Reality – Where it Started from and Where It’s Going. In: The Thousand Faces of Virtual Reality. London: Intech Open, 2014. p. 37–63.
VEAS, E. et al. Mobile augmented reality for environmental monitoring. Personal and
Ubiquitous Computing, v. 17, n. 7, p. 1515–1531,
2013.
WANG, J. et al. Integrating BIM and augmented reality for interactive architectural visualisation. Construction Innovation, v. 14, n. 4, p. 453–476, 2014.
WCED. Our Common Future. [s.l: s.n.]. WIDOK, A. H.; WOHLGEMUTH, V. Simulation and Sustainability. The Third International Conference on Advances in System Simulation Simulation, v. 18, n. 1, p. 182–187, 2011. WU, H. K. et al. Current status, opportunities and challenges of augmented reality in education. Computers and Education, v. 62, p. 41–49, 2013.
YABUKI, N.; MIYASHITA, K.; FUKUDA, T. An invisible height evaluation system for building height regulation to preserve good landscapes using augmented reality. Automation in Construction, v. 20, n. 3, p. 228–235, 2011.
ZHOU, F.; BEEN-LIRN DUH, H.;
BILLINGHURST, M. Trends in AR Tracking, Interaction and Display: A Review of Ten Years of ISMAR. IEEE International Symposium on Mixed and Augmented Reality. Anais...Washington: IEEE, 2008.
8. Acknowledgements
This research has received funding from the European Union’s Horizon 2020 research and innovation programme under the Marie