I
Utilization of Cancer-Specific
Genome-Scale Metabolic Models in Pancreatic
Ductal
Adenocarcinomas
for
Biomarkers Discovery and Patient
Stratification
Master Degree Project in Systems Biology A2E
60 credits/ECTS
Spring term 2019
Mohamed Al Shobky
a15mohel@student.his.se
Supervisor: Adil Mardinoglu, Professor of Systems Biology King’s College London, UK
adil.mardinoglu@kcl.ac.uk
Examiner: Andreas Tilevik,
Senior Lecturer in Bioscience
School of Bioscience, Skovde university
andreas.tilevik@his.seII
Abstract
Pancreatic Ductal Adenocarcinomas initiates in the exocrine part of the pancreatic tissue and represents over 90% of all the pancreatic cancers. Pancreatic Ductal Adenocarcinomas are extremely aggressive and are one of the most lethal malignant neoplasms. The five-year relative survival is currently less than 8% of the patients. The main reason behind such a low survival rate is that most of the cases are diagnosed at a very late stage. Although substantial advancement in pancreatic cancer research has been done, there has not been any remarkable significance in the mortality to incidence ratio. This is mainly a result of the scarce of early diagnostic characteristic symptoms and reliable biomarkers besides the unresponsiveness to the treatments. In this study, transcriptomics and proteomics data were used for the construction of a genome-scale metabolic model that was used in the detection of altered metabolic pathways, genes and metabolites using gene set analysis and reporter metabolites analysis. As a result, altered metabolic pathways in PDAC tumours were detected including the lipid metabolism-related pathways as well as carbohydrate metabolism, in addition to nucleotide metabolism, which are considered as potential candidates for diagnostic biomarkers. Moreover, classification of the filtered DIRAC tightly regulated network genes, based on their prognostic values from the pathology atlas, detected two groups of PDAC patients that have a significantly different survival outcome. The differential expression analysis of the two groups showed that six of the eight genes used in clustering were showing significantly altered expression, which suggests their importance in PDAC patient stratification. As a conclusion, this study shows the valuable outcome of the GEM reconstructions and other systems-level analyses for elucidating the underlying altered metabolic mechanisms of PDAC. Such analyses results should provide more insights into the biomarker discovery and developing of potential treatments.
III
Popular scientific abstract
Cancer is a collective term for a large group of diseases that target any organ in the body. A well-known feature of cancer is its ability to create abnormal cells rapidly and grow outside their normal boundaries, which can then invade adjacent body parts and spread to distant organs. These abnormalities occur due to the interactions between the individual’s genetic factors and external agents, including physical, chemical, and biological carcinogens. To give indications on cancer hazardousness, it is the second leading cause of death worldwide, with an estimated 9.6 million deaths in 2018, according to the world health organisation (WHO). Furthermore, the most common cancer types include the lung, breast, colorectal, prostate, skin, and stomach cancers and the lung, colorectal, stomach, liver and breast cancers are the most associated with cancer deaths. The cancer cell metabolism was found to be reprogrammed in order to support their rapid proliferation. That is why the metabolic rewiring, also referred to as metabolic alteration, is now considered as one of the cancer hallmarks that initially included the traits of evading growth suppressors, activating invasion and metastasis, limitless replicative potential, resisting cell death and sustained angiogenesis.
The pancreas is an organ located within the abdomen and is about 15.24 cm long, flat and oblong, with an essential rule in digestion and blood sugar regulation. The pancreas as a gland has both exocrine and endocrine functions. The exocrine activity is shown in the production of enzymes called pancreatic juice that digest fats, proteins and carbohydrates in the intestine. Those digestive fluids travel through the pancreatic duct to the bile duct that takes the fluids to the gallbladder and mixes with bile acid to help in the digestion process. The endocrine activity is the represented in its secretion to the insulin that decreases the concentration of blood glucose and glucagon raises the blood glucose levels, and the combination of the two hormones maintain a normal level of blood sugar in the human body. There are three primary diseases associated with the pancreas malfunction, and they are pancreatitis, diabetes and pancreatic cancer. The pancreatic ductal adenocarcinoma is a highly lethal cancer associated with a very poor survival rate as the five-year relative survival is currently less than 8% of the patients. The cytotoxic chemotherapies that are now being used in the treatment regimen, unfortunately, are accompanied by significant side effects with a minimal therapeutic outcome. The FDA approved drugs that are used rely on the DNA metabolism and DNA integrity as their primary target, and for that reason, researchers thought of finding alternative metabolic targets that might allow for a higher efficacy and tumour eradication rate. Pancreatic ductal adenocarcinomas are capable of living in a harsh microenvironment with hypoxia and nutrient deprivation, which means that they attain biochemical flexibility, allowing them to adapt in such conditions. For that reason, a full understanding of the metabolic nature can ravel metabolic vulnerabilities that could be targeted as biomarkers for diagnoses or prognosis and as a novel drug target for developing an effective treatment. In this study, different systems biology methods including genome-scale metabolic modelling, differential expression analysis, gene set enrichment analysis, survival analysis and more were used to detect genetic and metabolic alterations specific to pancreatic cancer. The results revealed that pancreatic tumours possess altered metabolism in the lipid metabolism, carbohydrate metabolism as well as nucleotide metabolism pathways that can be targeted as potential candidates of diagnostic biomarkers. In addition, the analysis managed to detect a list of 6 genes that have altered expression between patient groups suggesting their importance in pancreatic patient stratification which can help in determining the cancer stage and the subsequent adequate and effective treatment.
IV
List of abbreviation
AADAC Arylacetamide deacetylase
ALDH3A1 Aldehyde dehydrogenase 3 family member A1 CHI3L1 Chitinase-3-like protein 1
DEGs Differentially expressed genes DIRAC Differential Rank Conservation
ENTPD8 Ectonucleoside Triphosphate diphosphohydrolase 8
FPKM Fragments Per Kilobase of transcript per Million mapped reads GDC Genomic Data Commons
GEM Genome-scale metabolic model
GFPT1 Glutamine--fructose-6-phosphate aminotransferase GSA Gene set analysis
HK3 Hexokinase-3
HMR2 Human Metabolic Reaction database 2 HPA The Human Protein Atlas
LDHA L-lactate dehydrogenase A chain MANSC 1 MANSC domain-containing protein 1 MOGAT2 Monoacylglycerol O-acyltransferase 2 MOGAT3 Monoacylglycerol O-acyltransferase 3 NAGK N-acetyl-D-glucosamine kinase PDAC Pancreatic Ductal Adenocarcinoma. PLA2G10 Phospholipase A2 Group IVF PLA2G4F phospholipase A2 group X TCGA The Cancer Genome Atlas
V
Table of contents
Abstract ... II Popular scientific abstract ... III List of abbreviation ... IV Table of contents ... V
Introduction ... 1
Aim ... 4
Materials and Methods... 6
2.1 DATA ... 6
2.1.1 Proteomics ... 6
2.1.2 Transcriptomics ... 6
2.1.3 Generic human model, Human Metabolic Reaction database 2 (HMR2) ... 6
2.2 The RAVEN Toolbox ... 6
2.3 PDAC-specific GEM Reconstruction ... 6
2.4 The Differential Rank Conservation (DIRAC) analysis ... 7
2.5 Unsupervised clustering ... 7
2.6 Survival analysis ... 7
2.7 Differential Gene expression analysis and gene set analysis (GSA) ... 8
2.8 Reporter metabolites ... 8
Results ... 9
3.1 Integrated proteomics and transcriptomics data for a refined protein abundance scores ... 9
3.2 Reconstructed PDAC-specific GEM constitutes individual transcriptome and tissue-specific proteome data ... 10
3.3 RNA-seq and Network-based analyses of PDAC metabolism ... 11
3.3 Implementation of DIRAC analysis and unsupervised clustering towards the stratification of PDAC patients ... 16
Discussion ... 18
Conclusion and Future perspectives ... 21
Ethical aspects and impact of the research on society ... 22
Acknowledgements ... 22
References ... 23
Page | 1
Introduction
As the fundamental building unit of the human body, cells are capable of both extracting and providing energy to carry out various vital processes and synthesising new organic materials that are essential for performing activates such as movement, growth, development, and reproduction. Metabolism is a crucial process for the utilisation of nutrients and preserving the balance between energy consumption and production by a collection of a set of biochemical reactions which in turn are maintaining the healthy living state of the cells and the body as a whole (Lazar and Birnbaum, 2012). With the mutual impact between the metabolism and every other cellular process; there is a piece of apparent evidence showing the fundamental role of the metabolic pathways collection that influences every single cellular function and extends to whole-body level (McKnight, 2010). To this end, along with a more profound medically-oriented research in metabolism, it became more evident that the abnormal metabolic states considered as the primary cause or outcome of a myriad of human disorders including diabetes, liver and renal disorders, and cancer (DeBerardinis and Thompson, 2012).
Cancer is a remarkably heterogeneous and sophisticated collection of diseases and considered as an outstanding example of human disorder with hereditarily-derived pathological metabolic perturbations (Greaves and Maley, 2012). Hanahan and Weinberg (Hanahan and Weinberg, 2000) managed to set six major cancer hallmarks in an attempt to organise the cancer discrepancy in its underlying biology that represents the physiological alteration in a cell which eventually drives the growth and development of the malignancy. Those hallmarks are represented in the tumour ability to generate its own growth signals, showing a noticeable reduction in its dependence on the exogenous growth stimulation from the surrounding normal tissue microenvironment. Another acquired trait by the tumour cells is the insensitivity to the antigrowth signals, which is mainly caused by the disruption of the retinoblastoma protein (pRb) and its two relatives, p107 and p130 that release E2F transcription factors that allow the cell proliferation. One more critical mechanism is the ability of the tumour cells to evade apoptosis that has a very prominent influence on the expansion of the tumour cell population that works side by side with its ability to increase the rate of cell proliferation by acquiring insensitivity to the antigrowth signals. Independent from the cell-to-cell signalling disruption in favour of tumour growth to be isolated from the surrounding environment, the deregulation of the intrinsic, cell-autonomous program that operates independently from the cell-to-cell signalling pathways, are crucial to ensure the uncontrolled expansion of the tumour growth. The availability of the oxygen and nutrients by the blood vessels to the tumour cells is also crucial to keep the tumour expansion and increase in size. For that particular reason, the tumour develops a sustained angiogenic ability that guarantees a constant supply from oxygen and nutrients. The last hallmark they introduced was the ability of the cancer cells to invade adjacent tissues and move to remote sites to start new colonies to escape from the limited supplies in the primary tumours.
Later an updated review by the same authors (Hanahan and Weinberg, 2011) added to the list two more emerging hallmarks based on observations from the significant advancement in cancer research and that included the of energy metabolism reprogramming and evading immune destruction. Metabolic reprogramming as a cancer hallmark has the capability to promote the malignant cell
Page | 2 proliferation, survival, and metastasis by altering metabolic pathways and mainly those related to energy metabolism, aiming for maintaining the cell growth and division. That was first observed by Warburg where cancer cells showed an abnormal behaviour from healthy cells in terms of energy metabolism (Warburg, 1956, Warburg et al., 1927). In other words, within aerobic conditions, the abnormal cells alter the metabolism of glucose where the energy metabolism is shifted mainly towards glycolysis in what so-called “aerobic glycolysis” (Warburg, 1956, Warburg et al., 1927). While that was such an outstanding discovery, but the idea of the total impairment of the oxidative phosphorylation process in cancer cells respiration was controversial (Weinhouse, 1956). That was supported by carrying out an isotope-tracing experiment that showed results of the ability of cancer cells to oxidise oxygen and generate CO2 with the same rate as a normal cell. The only exception was during tumour growth where the core cells of a tumour become hypoxic, and that would decrease the oxidative phosphorylation rate in comparison to glycolysis (Weinhouse, 1951, Weinhouse, 1972).
Recently, the tumour associated metabolic rewiring was intensely reviewed and showed its profound advantage to initiate the tumour growth and development as well as maintaining its survival. In addition to that, it became more evident that this metabolic reprogramming could be a result of genetic mutations or could even induce posttranscriptional modifications (DeBerardinis and Chandel, 2016, Cairns and Mak, 2016). In an attempt to organise these metabolic alterations, Pavlova and Thompson managed to group them into six hallmarks (Pavlova and Thompson, 2016). The list included the deregulation of the glucose and amino acids, increased nitrogen demand,the tumour utilisation for the opportunistic modes of nutrient acquisition and the ability to interact with its surrounding microenvironment metabolically. Moreover, the utilisation of the intermediates of the glycolysis\TCA cycle for the biosynthesis and NADPH production and alterations in metabolite-driven gene regulation that acts as active influencers on tumorigenesis were among those hallmarks (Pavlova and Thompson, 2016).
In general, pancreatic cancers can be divided into two subtypes as endocrine or exocrine tumours. Pancreatic Ductal Adenocarcinomas (PDAC) initiates in the exocrine part of the pancreatic tissue and represents over 90% of all the pancreatic cancers. The most typical non-invasive neoplastic precourse to PDAC is pancreatic intraepithelial neoplasias (PanIN). Those lesions harbour genetic and epigenetic alterations that are considered as primary drivers of the invasive adenocarcinoma of the pancreatic tissue (Vincent et al., 2011). PDACs are extremely aggressive, and one of the most lethal malignant neoplasms with five-year relative survival is currently less than 8% of the patients. The main reason behind such a low survival rate is that most of the cases are diagnosed at a very late stage, where the five-year rate of survival reaches 2% (Siegel et al., 2016). Based on GLOBOCAN 2012 worldwide estimates, the pancreatic cancer was responsible for the death of 330391 patients per year, accounting for 4.0% of all cancer deaths, and also 337872 per year estimated incidence which is accounting for 2.4% of all new cancer cases (Ferlay et al., 2015). With the fact that the PDAC considered the seventh most common cause of cancer mortality with an inferior prognosis, it is predicted that this cancer-related mortality rate is going to even more increase reaching to be ranked as second in the next decade if no actions will be taken against such deadly cancer (Rahib et al., 2014). Although the substantial advancement in pancreatic cancer research there has not been any remarkable significance in the mortality to incidence ratio. That is mainly a result of the scarce of early diagnostic characteristic symptoms and reliable biomarkers besides the unresponsiveness to the
Page | 3 treatments due to the tumour heterogeneity, plasticity and the aggressive metastasis that presents in more than 50% of the diagnosed patients (Adamska et al., 2017). Previously, several studies pointed out the most prominent genetic features of the PDAC such as oncogenic activation of K-RAS that is a standard feature in more than 90% of the patients and with the early onset mutation of that gene, it is considered as a critical driver of PDAC initiation and progression (Lohr et al., 2005). Along with the oncogenic activation, inactivating mutations of the tumour suppressor gene CDKN2A/2B are also observed in more than 80% of the early stage lesions, while later stages of cancer exhibit inactivating mutations and deletions of tumour suppressor genes most prominently include TP53and SMAD4 (Bardeesy and DePinho, 2002). Moreover, another feature that reflects the PDAC aggressiveness and chemoresistance is the desmoplastic reactions induced by immune cells, stromal cells, neural cells and extracellular matrix that forms the tumour mass bulk. Altogether, with the tumour hypo vascularisation, the delivery of the needed oxygen and nutrients is diminished due to the vascular network deficiency. In such hypoxic and acidic microenvironment in addition to the nutrient deficiency, a direct impact on the drug delivery mechanisms is common, and more importantly, the tumour microenvironment maintains its survival and growth by altering its metabolism (Sousa and Kimmelman, 2014, Liang et al., 2016). The downstream events of metabolic reprogramming are considered as prominent hallmarks of PDAC. Therefore tackling this aggressive cancer through establishing a clear understanding regarding its metabolism has been a dominant challenge to the scientific and medical communities (Perera and Bardeesy, 2015). Recent studies have shown the crucial role of both glucose and glutamine metabolism in the progression of the PDAC tumours that are regulated by the K-RAS oncogene to maintain the tumour growth (Le et al., 2010, Ying et al., 2012, Son et al., 2013). Inducible oncogenic K-RAS mouse model of PDAC showed in addition to being a key driver of PDAC initiation that it plays a central role in rewiring the tumour glucose metabolism by stimulating the glucose uptake and drives glycolysis intermediates towards non-oxidative pentose phosphate pathways (PPP) (Ying et al., 2012). Another study reported that the PDAC cells maintain the tumour growth by relying on the distinct pathway of glutamine metabolism and that this reprogramming is mediated by the oncogenic K-RAS (Son et al., 2013).
One of the fundamental purposes of the human systems biology studies is to accomplish an explicit knowledge about human metabolism and its relation to various diseases. With the frequently arising challenges regarding cancer diagnosis and treatment - mainly due to its complex pathogenic landscape and cellular heterogeneity - the systems biology holistic view allowed for having a global understanding of the disease mechanism and gain more insight towards biomarkers and drug target discovery (Westerhoff and Palsson, 2004, Tian et al., 2012). Metabolic network reconstructions became an essential tool for exploring the systems biology of metabolism and the generation of genome-scale metabolic models (GEMs). These models along with the massive advancement in high-throughput omics data production has significantly contributed to metabolism studying on a genome-scale by providing a computational platform for integrating and analysing this data as well as investigating more thoroughly into these networks by simulations (Thiele and Palsson, 2010, Bordbar and Palsson, 2012, Fondi and Lio, 2015).
GEMs are a mathematical representation of the current knowledge of metabolism where biochemical and physiological data on protein-encoding genes and their interactions with other bioactive compounds and associated reactions are integrated. These metabolic reconstructions harbour a set of annotated stoichiometric chemical reactions as well as enzymes associated with those reactions in
Page | 4 a particular cell or tissue (Mardinoglu and Nielsen, 2012, Mardinoglu et al., 2013, Mardinoglu and Nielsen, 2015). In the past, two literature based GEMs of human metabolism were constructed, which were built to be generic. The reconstruction based on an extensive evaluation of genomic and bibliomic data, which are known as Recon1 (Duarte et al., 2007) and the Edinburg Human Metabolic Network (EHMN) (Ma et al., 2007), which showed a great significance in revealing the gaps in understanding the human metabolism. With the aim of extending the knowledge, included within such reconstructions, these generic networks were integrated with the human metabolism-related reactions in the Kyoto Encyclopaedia of Genes and Genomics (KEGG) (Kanehisa and Goto, 2000) for the creation of the Human Metabolic Reaction (HMR) database (Agren et al., 2012). This was followed by updating the contents of the HMR to HMR2 database (Mardinoglu et al., 2013) by integrating lipids and lipoprotein metabolomics from the Reactome database (Croft et al., 2011) and a manually constructed Hepatocytes GEM, HepatoNet 1 (Gille et al., 2010). Also, the lipid metabolism was more extensively curated using the lipidomics Gateway (Sud et al., 2007) and HumanCyc database (Romero et al., 2005). Those generic GEMs lack information related to the cell or disease-specific metabolic states. For that reason, many algorithms have been published that can reconstruct a cell or disease-specific GEM by reducing the generic ones using cell or diseases disease-specific omics data (Schmidt et al., 2013).
By the time the Genome-Scale Metabolic network was reconstructed, it was ready to be paired with various constraint-based modelling approaches for its transformation to mathematical models for the analysis of the cell or tissue-specific genotype-phenotype relationships. Concerning the current network knowledge, the constraint-based modelling constrains its predications allowing for phenotype simulations (Price et al., 2004). The constraint-based modelling, in contrast to the traditional kinetic modelling techniques, does not need detailed information on kinetic constants or the associated metabolites and enzyme. Instead, it counts on a set of constraints including thermodynamic constraints, mass-balance constraints and enzyme capacity constraints that applied for analysing Genome-scale metabolic models by transforming it into a mathematical model (Lewis et al., 2012). For the purpose of genome-scale metabolism simulations, Flux Balance Analysis (FBA) considered as the primary and most common method of the constraint-based modelling, allows for in
silico prediction of flux that is optimised to a defined set of objectives despite the need for
experimental measurements (Orth et al., 2010). Cancer-related applications of the reconstructed GEMs includes networks comparison between healthy and diseased cells; physiological analysis including essentiality and lethality analysis and growth simulation; integrative analysis of omics data, in which the GEM is used as a scaffold for identifying reporter pathways and reporter metabolites (Yizhak et al., 2015, Nilsson and Nielsen, 2017, Ghaffari et al., 2015).
Aim
With the high heterogeneity, aggressiveness and low survival rates of pancreatic adenocarcinomas; early diagnosis along with appropriate personalised treatment protocols are crucial for tackling such lethal tumours. For that reason, this project aims to integrate the pancreatic cancer-specific proteomics and transcriptomics data with Genome-scale metabolic modelling in a systematic manner. Moreover, the aim is to perform transcriptomic and network-based analyses, as illustrated in figure 1, to discover potential biomarker candidates and stratify PDAC patients that eventually will be significant for the diagnosis and development of effective treatment strategies.
Page | 5 Figure 1. Illustration of the workflow of the thesis project. TCGA mRNA-seq data and HPA proteomics data were integrated and introduced to the tINIT algorithm along with 57 metabolic tasks and HMR2 as a template model for the reconstruction of PDAC-specific GEM. For the diagnostic biomarkers discovery, differential expression (DE) analysis was performed, and the results were used to perform gene set analysis (GSA) and reporter metabolites analysis using the network topology of the reconstructed GEM. For the PDAC patients’ stratification, Differential Rank Conservation (DIRAC) analysis followed by consensus clustering analysis and survival analysis was performed. DE analysis was then performed between the two groups.
Page | 6
Materials and Methods
2.1 DATA
2.1.1 ProteomicsStaining profiles for proteins in pancreatic ductal adenocarcinomas tissue based on immunohistochemistry using tissue microarrays were retrieved from the Human Protein Atlas (HPA) version 16.1 (Uhlén et al., 2015) (http://www.proteinatlas.org). The proteomics data were used as the bases for the Genome-scale metabolic model reconstruction.
2.1.2 Transcriptomics
The mRNA-Seq profiles and clinical metadata of 181 samples composed of 177 primary pancreatic ductal adenocarcinomas and four matched tumour-adjacent normal tissues were used for the GEM reconstruction and mRNA expression, DIRAC, clustering and survival analyses. The harmonised data were retrieved from The Cancer Genome Atlas (TCGA) project within the Genomic Data Commons (GDC) Data Portal Version 9.0 (https://portal.gdc.cancer.gov/) (Grossman et al., 2016), using the TCGAbiolinks 2.5.7 R/Bioconductor package (Colaprico et al., 2016). The retrieved harmonised mRNA-Seq gene expression was in the form of raw HT-mRNA-Seq Read Counts data, and Fragments per Kilobase of transcript per Million mapped reads (FPKM) data.
2.1.3 Generic human model, Human Metabolic Reaction database 2 (HMR2)
The reference human GEM HMR2 (Uhlen et al., 2017) is a genome-scale metabolic model that represents the generic human cell. It contains 2892 genes associated with 7762 reactions 5566 metabolites. The generic GEM was used as the reference model for the tINIT algorithm during the process of PDAC-specific GEM reconstruction.
2.2 The RAVEN Toolbox
RAVEN (Reconstruction, Analysis, and Visualization of Metabolic Networks) is a toolbox that runs within MATLAB and presents a complete environment to perform GEMs reconstruction, with the ability to analyse, simulate and visualise those reconstructed models. It is capable of integrating different omics data for automated reconstruction of the GEMs. The reconstruction was followed by an analysis of the networks and simulation results, also visualising the GEMs based on another published network maps (Agren et al., 2013).
2.3 PDAC-specific GEM Reconstruction
A functional PDAC-specific GEM was reconstructed based on both proteomic and transcriptomic data, using HMR2 as a reference model and a list of 57 predefined metabolic tasks (Agren et al., 2014) as an input to the tINIT (Task‐driven Integrative Network Inference for Tissues) algorithm (Agren et al., 2014) and Mosek solver version 8 within the RAVEN Toolbox Version 1.9 in MATLAB R2016b. Scoring for evidence of a reaction to be occurring was based on HPA protein profiles integrated with mRNAseq FPKM data. mRNA-seq data were filtered using the criterion of median expression value ≥1 FPKM to be added to HPA protein abundance score file with the Level “Low”. Such reconstruction method was
Page | 7 performed in many projects; for example, one group integrated myocyte-specific RNA seq data with proteomic data for the reconstruction of a comprehensive myocyte-specific GEM (Varemo et al., 2015). The maximisation of biomass production was considered as an objective function for PDAC-specific GEM to assess model feasibility. In brief, the tINIT algorithm is a developed version from the older INIT (Agren et al., 2012) that allows for direct automated and semi-automated reconstruction of functional GEMs based on proteomics and transcriptomics evidence and a novel task‐driven reconstruction approach. The INIT algorithm was also used for generating a cell or cancer-specific GEMs that were lacking the functionality to allow performing the simulations. On the other hand, tINIT takes as an input, in addition to the integrated proteomics and transcriptomics evidence score and a Generic model, a list of predefined metabolic tasks including biomass growth for cancer cells as an additional metabolic task. These tasks should be performed by the reconstructed model to be functional as they are applying constraints on the reconstruction functionality and representing metabolic functions that are common in all cell types (Agren et al., 2014).
2.4 The Differential Rank Conservation (DIRAC) analysis
DIRAC is a network-based approach and was implemented within MATLAB for analysing gene order within the pathways of the reconstructed model along with another gene sets. The central concept of the algorithm is mainly based on the relative expression ranks of the participating genes. The results should show a quantitative measurement of how pathway rankings differ both within and between phenotypes (Eddy et al., 2010). Pathways of the reconstructed GEM, as well as KEGG pathways, were used as gene set input to the algorithm with minimum genes set size was set to 3 and FPKMs were filtered by removing genes that had a row median less than one.
2.5 Unsupervised clustering
To find hidden patterns in the transcriptomics data that could be used for the PDAC stratification, unsupervised class discovery using the R/Bioconductor package "ConsensusClusterPlus" has proven its efficacy in revealing those groups that share common biological characteristics (Wilkerson and Hayes, 2010).First, the transcriptomics data in the form of FPKMs were filtered based on median FPKM > one will be included. Then, the list of 152 unique genes from the four tightly regulated pathways was further filtered based on their significance as prognostic genes from the pathology atlas dataset of pancreatic cancer prognostic genes (Uhlen et al., 2017). The FPKMs were median centred, and the following parameters were used: 80% item resampling (pItem), and 80% gene resampling (pFeature), a maximum evaluated k of 12 and 1000 resampling, agglomerative hierarchical clustering algorithm (clustering) upon 1- spearman correlation distances (distance) and ward.D2 as the linkage method.
2.6 Survival analysis
Based on the clinical data from the TCGA of the two PDAC groups defined by the unsupervised consensus clustering, the survival analysis was performed, and the log-rank test was calculated. Kaplan-Meier curves were derived according to the survival of the patients, and the days occurred until death after diagnosis. The Survival R package (Therneau and Lumley, 2018) was used for this analysis.
Page | 8
2.7 Differential Gene expression analysis and gene set analysis (GSA)
The mRNA-seq raw count data were analysed for the detection of differentially expressed genes (DEGs) and obtain a quantitative and statistical inference to the changes between the two conditions as well as between the generated cancer subgroups from clustering. The R/Bioconductor package DESeq2 version 1.18.1 (Love et al., 2014) was used for that purpose. Benjamini and Hochberg false discovery rate (FDR) was conducted for multiple hypothesis correction. The FDR adjusted p-value < 0.05 and Fold-change cut-off of >1 or <-1 was applied to determine up- and down-regulated genes.
Gene set analysis using R/Bioconductor package “Piano” (Varemo et al., 2013), was performed to gain a better understanding to the results of the differential expression analysis, and its underlying biological processes. In this study, three gene set collections including the constructed PDAC specific GEM, the Gene Ontology biological processes (BP) “GOTERM_BP_5” and KEGG metabolic pathways (both were retrieved from MSigDB (Liberzon et al., 2015) were used. The statistical GSA method used was: Reporter features, Theoretical null distribution as the Significance method, FDR as the Multiple hypothesis correction method <0.05 and 1000 permutations to use for gene sampling
2.8 Reporter metabolites
By using the network topology of the reconstructed model, the reporter metabolite algorithm impeded inside the RAVEN toolbox was employed to allow for identifying the network metabolites that are significantly enriched based on its association with the gene expression changes. Those metabolites can be then used for identifying central parts of the metabolic network that has significant perturbation between the examined conditions (Patil and Nielsen, 2005). The network topology of the reconstructed PDAC-specific GEM in addition to the log2 fold changes and p-values from the differential expression analysis were imported to the reporter metabolites function in the RAVEN toolbox and a p-value < 0.005 was determed as the significance level.
Page | 9
Results
3.1 Integrated proteomics and transcriptomics data for a refined protein
abundance scores
The concept behind integrating both of the proteomics and transcriptomics data is to complement the proteomics data and get a piece of refined and more robust information that could overcome the heterogeneous nature of pancreatic cancer tumours. The protein level data serves as the main source of protein evidence, while the mRNA expression profiles purpose is to fill in the gaps and reduce the probability of having potential false negatives.
The retrieved PDAC proteomics data from the HPA project v16.1 was trimmed down to show the protein abundance levels (high, medium, low or not detected) of 15297 protein-encoding genes that are associated with the highest patients count. As a result, the data unveiled that 1566 (10.2%) genes had high staining level, 1835 (12%) genes had low staining level, 5368 (35.1%) genes had medium staining level, while 6528 (42.7%) genes were not detected on the protein level (Figure 2A).
The TCGA transcriptomics data for 177 PDAC patients and four matched tumour-adjacent normal tissues in the form of FPKMs were filtered to comprise only protein-encoding genes, and that yielded in total 19363 putative protein-coding genes. Based on various studies of the correlation between transcriptome and proteome, the low abundance transcripts of the mRNA expression with median FPKM values less than one was interpreted as not being translated to the corresponding proteins (Fagerberg et al., 2014, Varemo et al., 2015). By applying a cut-off of median FPKM equal to or above one as the protein detection level, a total of 12134 (62.7%) were identified as detected, while 7229 ( 37.3%) of the putative protein-coding genes were not being translated to their corresponding protein (Figure 2B).
Besides, comparing the two datasets revealed that a total of 6890 (49.2% of all protein-coding genes) genes were consistently present in PDAC tumours at both the proteomic and transcriptomic levels (Figure 2C). Moreover, a total of 5244 (37.4%) protein-coding genes were unique to the transcriptomic data, while 1879 (13.4%) protein-coding genes were only present in the proteomics data (Figure 2C). With that being concluded, the integrated data represented all the protein-coding genes (14013 genes) that are evaluated as present on the protein level in PDAC tumours. Based on this, 3557 genes from the HPA data with non-detected protein abundance level but had an FPKM level more than or equal to one were reassigned as detected with low level. In addition, 1687 genes were absent from the HPA data and found to have an FPKM level more than or equal to one. These genes were also added to the final updated protein abundance scores with the level defined as low.
Page | 10 Figure 2: Coverage of gene expression in transcriptomic and proteomic analysis of the PDAC data. (A) The pie chart shows the coverage of protein-coding genes in the Human Protein Atlas (HPA). (B) The pie chart shows the coverage of protein-coding genes in the TCGA FPKM data after applying the median cutoff FPKM <1. (C) All protein-coding genes that are evaluated as present in PDAC based on TCGA transcriptomics data (Red) and HPA proteomics data (Green), which were used during the reconstruction of the PDAC GEM. (D) The overall distribution of Genes in PDAC GEM are included in the model based on the high-quality proteome, transcriptome, as well as the connectivity.
3.2 Reconstructed PDAC-specific GEM constitutes individual transcriptome
and tissue-specific proteome data
The high heterogeneity is a prominent trait of the pancreatic ductal adenocarcinoma tumours that obstruct the process of detecting individual variations within the tumours and the global biological differences between cancerous and non-cancerous pancreatic tissues. In this context, a population-based PDAC-specific GEM was reconstructed that comprise the individual variations among the PDAC
Page | 11 tumours and can be further employed for analysing high throughput omics data and simulating the metabolic differences between cancer and healthy patients.
The reconstruction process mainly relied on the updated protein abundance levels that were generated from the integration of both the proteomics and transcriptomics data (Figure 2C) and used to score the HMR2 reactions to be included in the reconstruction if at least one of its associated genes was detected as present in PDAC tumours. The model functionality was determined based on the 57 metabolic tasks and the objective function (see methods), and as a result, 459 reactions associated with 492 genes were essential for performing the introduced biological tasks. In addition, the final gap-filling step added eleven reactions that allow the final model to perform the rest of the tasks. The resulting PDAC- specific GEM is a functional model including 5750 reactions associated with 2242 genes and 4415 metabolites within eight different subcellular compartments. By inspecting the gene content of the reconstructed model and its correlation with the introduced proteomics and transcriptomics data, it showed that the majority of model gene content (1189 genes) were derived from both of the –omics data, while a considerable number (846 genes) of genes were specific to the transcriptomics data and only 169 genes were unique to the HPA proteomics data. In addition, a few numbers of genes (38 genes) were found to be included in the model from the HMR2 database for enhancing the model connectivity (Table Appendix .1). The source of evidence for the GEM gene content is shown in Figure 2D.
3.3 RNA-seq and Network-based analyses of PDAC metabolism
In order to uncover the underlying biological differences between PDAC tumours and noncancerous pancreatic tissues, transcriptomics data were analysed for the identification of the differentially expressed genes (DEGs) using the DEseq 2 R package (Love et al., 2014). As a result, a total of 540 genes were found to be differentially expressed (FDR adj. p-value < 0.05) in primary tumours in comparison to non-cancerous pancreatic tissue, of which 305 genes were upregulated, and 235 genes were downregulated. A complete list of all the 540 genes that were differentially expressed is shown in table Appendix 2.
The results of the differential expression analysis (more specifically the log-fold changes along with the p-values) for the protein-coding genes were used to perform gene set analysis (GSA) for Gene Ontology biological processes (BP) “GOTERM_BP_5”, KEGG metabolic pathways and the network structure of the PDAC-specific GEM using the Piano R/Bioconductor package (Varemo et al., 2013). The results for the GO biological processes gene set analysis showed that 584 biological processes were associated with upregulated genes in PDAC while 379 were associated with downregulated genes in PDAC. Among the significantly upregulated processes are mitotic cell cycle, cell cycle process, cell division, DNA replication, DNA repair, DNA metabolic process, cellular respiration, cytoplasmic translation and cell development. Also several metabolic processes including oxidative phosphorylation, one carbon metabolic process, carbohydrate metabolic and biosynthetic processes, amino acid metabolic processes including aspartate and glutamate metabolism, extensive lipid metabolic and biosynthetic processes like arachidonic acid, fatty acid, fatty acid derivatives, steroids and ether metabolic processes. Whereas immune-related biological processes, such as activation of immune response, inflammatory response, alpha and beta T-cell activation and differentiation, macrophage activation and cellular defence response, were associated with significantly downregulated genes in PDAC.
Page | 12 In the same manner, results of gene set analysis for both KEGG pathways and PDAC-specific GEM subsystems showed similar significance levels (FDR adj.pval<0.05) for the perturbed gene sets. The former resulted in 27 pathways showing patterns of downregulation due to its association to downregulated genes while 40 pathways were enriched by upregulated genes; the later showed that 35 subsystems were associated with upregulated genes and none of the rest subsystems found to be significantly enriched with downregulated genes. Noticeably, pathways including type 1 diabetes mellitus, primary immunodeficiency, natural killer cell mediated cytotoxicity, T cell receptor signalling, B cell receptor signalling, chemokine signalling, jak stat signalling, neurotrophin signalling autoimmune thyroid disease and acute myeloid leukaemia were among the highly significantly KEGG pathways enriched with downregulated genes. Moreover, the results showed that among the highly enriched metabolic pathways with upregulated genes are the lipid metabolism pathways including arachidonic acid, acylglycerides, glycerophospholipid, steroid, ether, glycosphingolipid metabolisms and bile acid biosynthesis and recycling. In addition, it comes in the same category as the amino acid metabolism pathways such as alanine, aspartate and glutamate metabolism, glycine, serine and threonine metabolism, cysteine and methionine metabolism, and arginine and proline metabolism. Along with that energy metabolism related pathways such as oxidative phosphorylation as well as carbohydrate, nucleotide and cofactors and vitamins metabolism pathways were also among the highly enriched with upregulated genes. Those pathways are shown in details in table 1, along with the associated differentially expressed genes for each pathway. Noticeably, although most of the genes were showing upregulated expression in PDAC tumours, a small amount of them was found to be downregulated, which did not affect the overall outcome.
Table1: Common significant Pathways (padj<0.05) identified through DE and “PIANO” GSA analyses (based on KEGG and/or PDAC GEM), as well as significantly changed genes in each pathway. The genes of each pathway are arranged by the degree of significance of differential expression within each pathway. The gene symbol, the log2 fold change, LFC standard error, p-values, and FDR adj. p-values are presented for each gene. Genes in (Red) are downregulated genes in PDAC.
Metabolic Pathway Gene
symbol
log2Fold Change
lfcSE p-value padj Lipid Metabolism
Arachidonic acid metabolism PLA2G10 2.967035 0.8093 0.00024 0.0238
SLC27A2 2.242737 0.6604 0.00068 0.0402
ALOXE3 2.499564 0.7524 0.00089 0.0456 Acylglycerides metabolism AADAC 3.701064 0.9176 0.00005 0.0104
MOGAT3 4.445076 1.1197 0.00007 0.0119
MOGAT2 4.313961 1.0967 0.00008 0.0129 Glycerophospholipid metabolism PLA2G4F 2.894178 0.7679 0.00016 0.0187 (Dysregulated) PLA2G10 2.967035 0.8093 0.00024 0.0238
CDS1 1.388428 0.3925 0.0004 0.0309
GPCPD1 -0.96369 0.2875 0.0008 0.0443 Steroid metabolism FABP6 4.422514 1.0898 0.00004 0.0102
UGT1A1 5.423705 1.3737 0.00007 0.0124 LIPA -1.31671 0.3399 0.0001 0.0147 SLCO1B3 5.378489 1.3883 0.0001 0.0147 CYP3A4 4.066282 1.0721 0.00014 0.0177 AKR1C4 3.64445 0.9716 0.00017 0.0196 CETP -2.29904 0.6137 0.00017 0.0199 SLC27A2 2.242737 0.6604 0.00068 0.0402 APOA4 7.120314 2.1282 0.00082 0.0447 CLN8 -0.80028 0.2413 0.00091 0.0459
Page | 13 Bile acid biosynthesis and recycling SLCO1B3 5.378489 1.3883 0.0001 0.0147
CYP3A4 4.066282 1.0721 0.00014 0.0177
AKR1C4 3.64445 0.9716 0.00017 0.0196
SDR16C5 2.777176 0.8121 0.00062 0.0385
SLC27A2 2.242737 0.6604 0.00068 0.0402 Ehter lipid metabolism PLA2G4F 2.894178 0.7679 0.00016 0.0187
PLA2G10 2.967035 0.8093 0.00024 0.0238 Glycosphingolipid metabolism B3GNT3 2.636525 0.5695 0.000003 0.0023 ALG1L 3.187208 0.7907 0.00005 0.0104 FUT2 1.923234 0.5739 0.0008 0.0443 UGT8 1.594161 0.4832 0.00096 0.0478 ABO 2.275606 0.6935 0.00103 0.0492 Energy metabolism
Oxydative phosphorylation ENTPD8 3.229628 0.8303 0.0001 0.0143 Nitrogren metabolism CA9 3.593014 1.0369 0.00053 0.0355
CA13 1.457664 0.434 0.00078 0.0437 Carbohydrate metabolism
Glycolysis / gluconeogenesis ALDH3A1 3.900533 0.9499 0.00004 0.009
HK3 -2.33905 0.6521 0.000335 0.02827 Tricarboxylic acid cycle and
glyoxylate/dicarboxylate metabolism
ALDH3A1 3.900533 0.9499 0.00004 0.009
Fructose and mannose metabolism HK3 -2.33905 0.6521 0.00033 0.0282 Ascorbate and aldarate metabolism UGT1A1 5.423705 1.3737 0.00007 0.0124 Nucleotide metabolism NQO1 2.306245 0.5791 0.00006 0.0117
ENTPD8 3.229628 0.8304 0.0001 0.0143
PDE2A -1.94998 0.5045 0.00011 0.0149 PDE7A -1.37634 0.4019 0.00061 0.0384 Amino acid metabolism
Alanine aspartate and glutamate metabolism GFPT1 1.028761 0.3017 0.00065 0.0391
IL4I1 -2.04549 0.6086 0.00077 0.0434 Glycine, serine and threonine metabolism CKMT1A 2.587723 0.6042 0.00001 0.0054
CKMT1B 2.533683 0.6274 0.00005 0.0103 Arginine and proline metabolism CKMT1A 2.587723 0.6042 0.00001 0.0054
CKMT1B 2.533683 0.6274 0.00005 0.0103 Histidine metabolism DDC 3.974158 0.8558 0.00003 0.0023 ALDH3A1 3.900533 0.9499 0.00004 0.009 ELOVL6 1.335621 0.4073 0.00104 0.0492 Tyrosine metabolism DDC 3.974158 0.8558 0.000003 0.0023 ALDH3A1 3.900533 0.9499 0.00004 0.009 IL4I1 -2.04549 0.6086 0.00077 0.0434 Amino sugar and nucleotide sugar metabolism
(dysregulation) NAGK -0.77096 0.1904 0.000051 0.01028 MANSC1 1.292456 0.3528 0.000249 0.02402 HK3 -2.33904 0.6521 0.000334 0.02826 CHI3L1 -2.62272 0.7549 0.000512 0.03467 GFPT1 1.028760 0.3017 0.000650 0.03919 Cofactors and vitamins metabolism
Porphyrin and chlorophyll metabolism HMOX1 -1.88894 0.4378 0.00001 0.0051
Page | 14 Retinol metabolism AADAC 3.701064 0.9176 0.00005 0.0104
UGT1A1 5.423705 1.3737 0.00007 0.0124
CYP3A4 4.066282 1.0721 0.00014 0.0177
SDR16C5 2.777176 0.8121 0.00062 0.0385 Alternatively, the reporter metabolite algorithm (Patil and Nielsen, 2005) within the raven toolbox was used to uncover the metabolic alterations accompanied by the PDAC tumours. The algorithm benefits from the network topology provided by the reconstructed PDAC-specific GEM to recognise metabolic hotspots (Reporter Metabolites) associated with upregulated or downregulated genes in PDAC tumours. As a result, the algorithm detected 76 upregulated reporter metabolites and 35 downregulated reporter metabolites (P<0.005) regardless of their compartmentalisation.
Among the upregulated reporter metabolites were metabolites of the lipid metabolism such as arachidonic acid and its products like 19(S)-HETE, 16(R)-HETE, which takes part in the arachidonic acid metabolism. Also, the cytosolic acyl-CoA-LD-TG3 pool, fatty acid-LD-PC pool and fatty acid-LD-PE pool metabolites of the acyl glyceride metabolism were associated with upregulated genes. In the ether lipid metabolism, the O-1-alk-1-enyl-2-acyl-sn-glycero-3-phosphoethanolamine, 1-Organyl-2-lyso-sn-glycero-3-phosphocholine and 1-(1-alkenyl)-sn-glycero-3-phosphoethanolamine metabolites also demonstrated a significant association with upregulated genes. Reporter metabolites were also found in the amino acid metabolism as mitochondrial creatine and creatine-phosphate were also associated with upregulation of gene expression.
On the other hand, metabolites related to the carbohydrate metabolism showed association to gene expression downregulation. As an example, metabolites of the glycolysis and gluconeogenesis, which are beta D-glucose-6-phosphate and beta-D-glucose and metabolites of amino sugar and nucleotide sugar metabolism, and N-acetylglucosamine and N-acetylglucosamine-6-phosphate, respectively. Moreover, metabolites of the nucleotide metabolism showed different behaviour as the extracellular metabolites like UMP, IDP, IMP and UDP demonstrated an association to upregulated genes, while the metabolites like GMP, AMP,cyclic-AMP and cyclic-GMP showed their depletion in the nuclease and golgi apparatus.
Page | 15 Figure 3: Reporter metabolites results. Reporter metabolites with its associated subsystems in PDAC GEM for PDAC tumours n= 177 compared to noncancerous pancreas samples n=4. P-values for each reporter metabolite were calculated for up- and downregulated genes (student's t-test p-val <0.005), and the negative logarithm of the p-values are represented.
Page | 16
3.3 Implementation of DIRAC analysis and unsupervised clustering towards
the stratification of PDAC patients
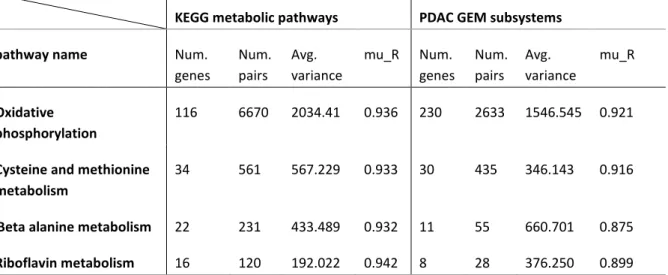
In order to find tightly regulated parts of the metabolism in PDAC, the DIRAC was used to analyse the normalised FPKM gene expression data using both of KEGG pathways and the PDAC-specific GEM subsystems. The population-level analysis was applied to find the rank conservation index for each network in the tumour phenotype which is a representative value for the degree of conservation in the rankings of the genes of the network expression value that is averaged over the phenotype samples. As a result, four pathways showed close levels of tight regulation in both of the used gene sets and those were oxidative phosphorylation, Cysteine and methionine metabolism, Beta-alanine metabolism and Riboflavin metabolism(table 2).
Table 2: Results from the DIRAC analysis. Four shared pathways between KEGG and PDAC GEM showed a close degree of tight regulation. The table shows the number of genes, gene pairs, average variance and the rank conservation index (mu_R) for each pathway across the used gene set collections.
KEGG metabolic pathways PDAC GEM subsystems
pathway name Num.
genes Num. pairs Avg. variance mu_R Num. genes Num. pairs Avg. variance mu_R Oxidative phosphorylation 116 6670 2034.41 0.936 230 2633 1546.545 0.921
Cysteine and methionine metabolism
34 561 567.229 0.933 30 435 346.143 0.916
Beta alanine metabolism 22 231 433.489 0.932 11 55 660.701 0.875
Riboflavin metabolism 16 120 192.022 0.942 8 28 376.250 0.899
By extracting the four tightly regulated pathway gene content out of KEGG gene sets, a list of 152 unique genes was generated. Using the information about prognostic genes of pancreatic cancer from the pathology atlas of human cancer (Uhlen et al., 2017), the pathways genes were filtered based on their prognostic capability and out of the 152 genes, 14 genes were prognostic. Furthermore, using the top eight significantly prognostic genes in the consensus clustering of the 177 PDAC tumour samples applying the parameters mentioned in material and methods was accompanied by the best clustering consensus. The genes were: LDHA, ATP6VOD1, COX6B2, DNMT3A, UQCR11, ATP6VOA1, ATP6VOB and MTMR2. The analysis revealed that the best clustering of samples is into two groups, the first group (PDAC 1) consists of 88 patients and the second group (PDAC 2) consists of 89 patients with clustering consensus values 0.8774 and 0.8452 respectively (Appendix figure 1).
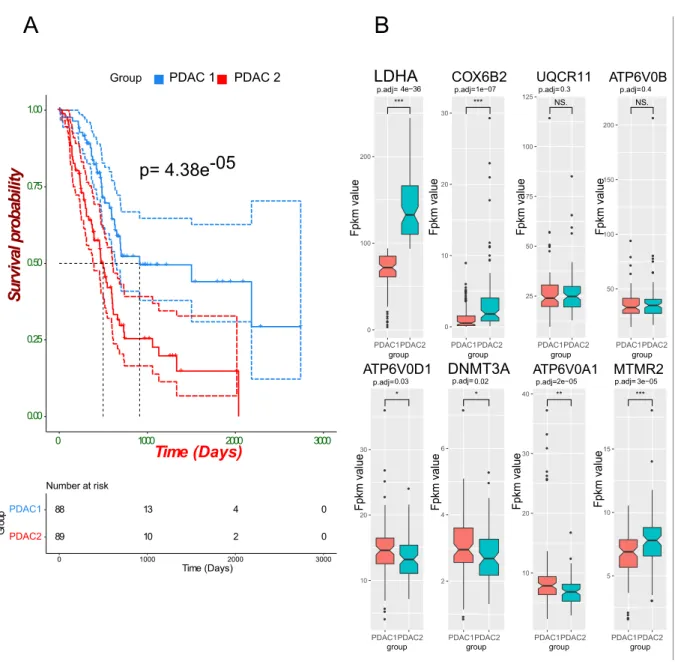
Next, survival analysis was performed on the two groups of the clustering analysis using clinical data of the 177 PDAC samples. The clinical data displayed information about the samples such as that the vital status of the patients was 85 alive and 92 dead until the last time the clinical data has been taken, and 21 samples were in the 1st stage, 146 in the 2nd stage, 3 in the 3rd stage, 4 in the 4th stage, while 3 were not reported. As a result, of the survival analysis, the p-value for the log-rank test between the two clusters was significant (p-val<0.001). The PDAC 1 group showed a significantly longer median survival time (913 days) in comparison to the PDAC 2 group (498 days) (figure 4A).
Page | 17 In order to gain more insight about the genetic alteration between the two cancer groups, differential expression analysis was performed using raw count data of the two groups as an input to the DEseq 2 R package. As a result, the analysis revealed that 1461 genes were expressed differentially (FDR adj. p-value < 0.05, log fold change cutoff > 1 or <-1). 330 of the DEGs were downregulated, and 1131 DEGs were upregulated based on their log fold change. By comparing those DEGs to the list of the prognostic genes from the pathology atlas, it was found that both data sets shared 139 genes. Finally, by looking into the differentially expressed genes within the list of eight genes used in the consensus clustering, six out of the eight were found to be DE, which included LDHA, ATP6VOD1, COX6B2, DNMT3A, ATP6VOA1, and MTMR2 (figure 4B).
Figure 4: PDAC stratification analyses results. A) Overall survival analysis for the two PDAC groups resulted from the consensus clustering analysis. Kaplan-Meier plot showing the overall survival rate for patients of two cancer groups PDAC 1 (n=88) and PDAC 2 (N=89). The plot showed a significant difference in the median survival time (log-rank p-value=4.38e-05) (solid line) with 95% confidence intervals (dashed lines for upper and lower bounds).
B) Box plots for the distribution of FPKM values of the 8 genes used in the clustering analysis between the two PDAC groups n=88 and 89, respectively. Statistical significance determined by Wilcoxon test followed by FDR adjustment. * p<0.05.
Page | 18
Discussion
Genome-scale metabolic models are a mathematical representation of the current knowledge of metabolism where biochemical and physiological data on protein-encoding genes and their interactions with other bioactive compounds and associated reactions are integrated. These metabolic reconstructions were extensively used to study cancer metabolism and the underlying genetic alterations (Mardinoglu et al., 2018). The Availability of GEMs and its integration with a high-throughput omics data and methods of data analysis may enable increased understanding of the altered metabolism in cancer. In addition, the implementation of differential expression analysis, gene set analysis and differential rank conservation (DIRAC) analysis provides different information from gene expression data that can complement each other.
In line with the observed acylglycerides metabolism enrichment associated to the upregulation of Monoacylglycerol O-acyltransferase 2 and 3 (MOGAT2, MOGAT3) and Arylacetamide deacetylase (AADAC) in the pathway analysis (table1), the reporter metabolite results (figure 3) showed a significantly upregulated uptake of the cytosolic acyl-CoA-LD-TG3 pool and increased production of fatty acid-LD-PC pool and fatty acid-LD-PE pool. These are metabolites of the acylglecrides subsystem in the PDAC-specific reconstructed GEM. Both MOGAT2 and MOGAT3 genes are encoding for enzymes that catalyse the terminal step of the synthesis of triacylglycerol by using fatty acyl-CoA (cytosolic acyl-CoA-LD-TG3 pool) and diacylglycerol as substrates (Cheng et al., 2003, Brandt et al., 2016), which explains the increased uptake behaviour of the metabolite acyl-CoA-LD-TG3 pool (figure 3) in PDAC tumours. Moreover, the upregulated AADAC gene that encodes for a triacylglycerol lipase, an enzyme that catalyses the hydrolysis of the tri and diacylglycerols to increase the level of intracellular fatty acids (Nourbakhsh et al., 2013), suggests the reason behind the increased production levels of the fatty acid-LD-PC pool and fatty acid-LD-PE pool metabolites.
Another lipid metabolism-related pathway that was found to be associated with upregulated genes is the ether lipid metabolism (table1). The phospholipase A2 group X, Phospholipase A2 Group IVF (PLA2G4F, PLA2G10) are genes encoding for the enzyme phospholipase A2 that hydrolyse the glycerophospholipids in the sn-2 position and produce free fatty acids and lysophospholipids (Cupillard et al., 1997). Noticeably, this increase in the phospholipase A2 enzyme activity was clearly showing its effect at the metabolite level in the form of highly upregulated reporter metabolites that were associated with the ether lipid metabolism as shown in figure 3. Those reporter metabolites were O-1-alk-1-enyl-2-acyl-sn-glycero-3-phosphoethanolamine and 1-(1-alkenyl)-sn-glycero-3-phosphoethanolamine. These are the reactants that responded to the increased enzyme activity by increasing their levels and that lead to an increase in the fatty acid-LD-TG2 pool and 1-Organyl-2-lyso-sn-glycero-3-phosphocholine the products of the corresponding reactions. In a similar manner, the upregulated PLA2G10 demonstrated its powerful ability in the releasing of the arachidonic acid from the process of hydrolysing of phosphatidylcholine (Cupillard et al., 1997). That ability was shown by its relative increase in level from the results of the reporter metabolites along with other substrates of the metabolism of the arachidonic acid like 19(S)-HETE 16(R)-HETE were also found to be upregulated (figure 3).
Some of the analysed pathways did not show a clear association to upregulated or down genes, and those were considered as significantly dysregulated pathways within the gene set analysis. Amino sugar and nucleotide sugar metabolism, a part of the carbohydrate metabolism pathway, is an
Page | 19 example of the dysregulated pathways (table1), where genes like MANSC domain-containing protein 1 and Glutamine--fructose-6-phosphate aminotransferase [isomerising] 1 (MANSC1, GFPT1) were significantly upregulated. Contrarily, amino sugar and nucleotide sugar metabolism also had significantly downregulated genes. Among those genes was the N-acetyl-D-glucosamine kinase (NAGK) gene encoding the enzyme that degrades the N-acetylglucosamine to N-acetylglucosamine-6-phosphate (Bergfeld et al., 2012). Another gene was the Hexokinase-3 (HK3) glucose-phosphorylating isoenzyme that catalyses the phosphorylation of glucosamine to glucosamine-6-phosphate (Griffin et al., 1991). Also Chitinase-3-like protein 1 (CHI3L1) that encodes the enzyme which catalyses the hydrolysis of the β-1,4-acetyl-D-glucosamine linkages in chitin polymers and produces N-acetylglucosamine (Flach et al., 1992). This dysregulation was translated at the metabolite level by the decrease in the level of both N-acetylglucosamine and N-acetylglucosamine-6-phosphate in PDAC during the amino sugar and nucleotide sugar metabolism as presented by the reporter metabolite analysis (figure 3).
Glycolysis and Gluconeogenesis metabolism was one of the significantly altered pathways from the gene set analysis in PDAC that takes a part of the carbohydrate metabolism, and it showed an overall association to upregulated genes. Noticeably, only two genes were significantly differentially expressed in PDAC tumours as a result of the DE analysis, and they showed opposite levels of expression (table1). The first is aldehyde dehydrogenase 3 family member A1 (ALDH3A1), a gene that encodes for the aldehyde dehydrogenase [NAD(P)+] enzyme that catalyses the conversion between the acetate and acetaldehyde (Khanna et al., 2011), which was significantly upregulated in PDAC tumours. While the second gene is the previously mentioned Hexokinase-3 (HK3) glucose-phosphorylating isoenzyme and its role in this pathway is catalysing the phosphorylation of glucose to glucose-6-phosphate (Griffin et al., 1991). This gene was significantly downregulated in PDAC tumours. The significant downregulation of Hexokinase-3 can explain the appearance of both beta-D-glucose-6-phosphate and beta-D-glucose as a downregulated reporter metabolite. Noticeably, the upregulation of ALDH3A1 did not show a significant alteration on the metabolite level, which can partially be explained by it being affecting a peripheral reaction in this pathway.
A previous study of the altered metabolism of PDAC investigated the gene-metabolite interactions by utilising both transcriptomics and metabolomics to detect the tumour potential biomarkers and altered metabolic pathways (An et al., 2018). The study revealed pyrimidine metabolism as the most significant pathway and that Ectonucleoside Triphosphate diphosphohydrolase 8 (ENTPD8) is differentially downregulated in PDAC. ENTPD8 encodes the enzyme that catalyses the hydrolysis of gamma- and beta-phosphate residues of nucleotides, playing a central role in the concentration of extracellular nucleotides (Knowles and Li, 2006). Interestingly, in terms of pyrimidine metabolism significance and its association with ENTPD8, it matched the results of the GSA showed in our study. However, it did not match in terms of downregulation of the ENTPD8 (table1) as the DE analysis result here showed a significant upregulation of the gene. Notably, the survival analysis performed within the human pathology atlas study (Uhlen et al., 2017) based on the ENTPD8 expression showed a trend (not significant) towards that a shorter overall survival rate accompanies the increased gene expression. Concluding that the pathology atlas results supports the idea of overexpression of ENTPD8 is a pancreatic cancer trait, as shown in our study. In addition, the altered expression of the ENTPD8 can partially explain the accumulation of metabolites of the nucleotide metabolism like extracellular UMP, IDP, IMP and UDP and depletion in GMP, AMP,cyclic-AMP and cyclic-GMP in the nuclease and Golgi apparatus, that was demonstrated in the reporter metabolite analysis (figure2).
Page | 20 In order to detect PDAC metabolic networks that have significant alterations which maintain the cancer growth and spread, DIRAC analysis was performed. The algorithm can take into account the combinatorial differences in the tumour gene expression, which might have a critical impact on cellular behaviour. Briefly, for a specific gene set, the algorithm calculates the gene expression order and build a rank template based on the average ordering in each phenotype. Subsequently, it calculates the matching degree of each sample to the rank template that is termed the rank matching score and averaging this score across all samples yields the rank conservation index that measures the degree of entropy in a gene set. The network with low entropy is said to be tightly regulated while the one with high entropy is said to be loosely regulated (Eddy et al., 2010).
This algorithm has been used in several studies in order to find an underlying metabolic alteration in cancer. One study used the Dirac analysis and GEM reconstruction to find metabolic process required for the Hepatocellular carcinoma cell proliferation and showed a tight regulation of the fatty acid biosynthesis and deregulation of fatty acid oxidation (Bjornson et al., 2015). Another study applied the algorithm to study the metabolic alteration that is accompanied by prostate cancer. That study revealed significant metabolic alterations in the lipid metabolism including glycosphingolipid biosynthesis, ether lipid metabolism and steroid biosynthesis and pointed out changes in the metabolism of the pentose phosphate pathway as well as riboflavin metabolism (Turanli et al., 2019). In this project, the Algorithm used the network construction of the reconstructed PDAC-specific GEM in addition to the KEGG pathways and revealed the close results in the tight regulation of four metabolic pathways namely, oxidative phosphorylation, Cysteine and methionine metabolism, Beta-alanine metabolism and Riboflavin metabolism (table 2). Subsequently, the gene content of the four pathways was extracted and filtered based on its prognostic effect. Such information was derived from the results of the pathology atlas of the human cancer transcriptome, where the effect of the gene expression in the patient's survival rates was provided (Uhlen et al., 2017).
To find hidden patterns in the transcriptomics data that could be used for the PDAC stratification, the unsupervised class discovery has proven its efficacy in revealing PDAC groups that share common biological characteristics. The analysis was performed based on the top eight prognostic genes in the tightly regulated pathways as it detected two groups that showed genetic alterations between them (appendix figure 1). Moreover, to assess the results of the clustering, a survival analysis was performed using the clinical data for the 177 patients, which showed a significant difference in the survival outcome between the two groups of PDAC patients where the group PDAC1 had a significantly longer survival time compared to the PDAC2 group (figure 4A). Consequently, differential expression analysis was performed to detect the underlying genetic differences between the two PDAC groups. The analysis successfully detected 1461 genes that have possessed significantly altered expression with 1131 of them demonstrated an upregulated state while 330 were downregulated.
Interestingly, 139 of the differentially expressed genes between the PDAC groups were defined as prognostic genes in the pathology atlas. In addition, six out of the eight genes used in the classification process were differentially expressed, and they are LDHA, ATP6VOD1, COX6B2, DNMT3A, ATP6VOA1, and MTMR2. The L-lactate dehydrogenase A chain (LDHA) is a gene that encodes an enzyme that catalyses the reaction responsible for the production of the pyruvate and NADH from L-lactate and NAD (Adams et al., 1973). A previous study demonstrated the overexpression of the LDHA in pancreatic cancer and its ability to induce pancreatic cancer cell growth (Rong et al., 2013). In addition, knocking down the LDHA in the pancreatic cancer cells significantly inhibited the cell growth revealing
Page | 21 the oncogenic trait of LDHA and its association with poor prognosis (Rong et al., 2013). That was in parallel with the results introduced here where LDHA was significantly upregulated in the PDAC group with the poor survival rate. Another recent study evaluated the expression of LDHA by immunohistochemistry and correlated the results with clinicopathological characteristics and patient survival. Also, LDHA expression was assessed in 10 human pancreatic cancer cells and detected the significant overexpression of the gene and its association with the poor survival outcome (Mohammad et al., 2016). Those genes could be the basis for a potential gene signature that could be used for PDAC patients’ stratification.
Conclusion and Future perspectives
In conclusion, this study has shed light on the undeniable value of using GEMs in deciphering the genetic and metabolic nature of cancer and overcome the heterogenic nature of some of the tumours. Here, the integration of both the transcriptomics and proteomics data represented a great added value as it allowed to include more information about PDAC and prevented potential false negatives that could be included during the GEM reconstruction. This significant value of integration was shown by the added 5244 genes from the TCGA data to the HPA data. The reconstructed PDAC specific GEM showed its ability to define metabolic alterations that were found in PDAC and provided consistent results with other gene sets like KEGG and GO biological processes during the GSA. The differentially expressed genes and reporter metabolites associated with the altered metabolic pathways in PDAC tumours including the lipid metabolism-related pathways (Ether lipid metabolism, Arachidonic acid metabolism, Acylglycerides metabolism) as well as carbohydrate metabolism (Ascorbate and aldarate metabolism, Glycolysis / Gluconeogenesis) in addition to Nucleotide metabolism are considered potential candidates as diagnostic biomarkers. Classification of the filtered DIRAC tightly regulated network genes based on their prognostic values from the pathology atlas managed to detect two groups of PDAC patients. The detected groups had a significantly different survival outcome, and the differential expression analysis showed that six of the eight genes used in clustering were showing significantly altered expression and suggesting their high value in PDAC patient stratification. One major wekanes of the study was the highly unbalanced data. For the future perspective, generating a more sufficient and balanced data is greatly desirable and with the fact that GEM is a great platform for data integration, starting to use more types of data is of great significance. Such data could be metabolomics that can provide a new aspect to the investigation, but it comes with the limitation that the prediction of the level of the metabolites intracellularly requires previous knowledge of thermodynamics and kinetics which is not clearly defined (Yizhak et al., 2010). Lastly, the systems-level analysis results allow for elucidating the undelaying altered metabolic mechanisms of PDAC that could provide more insights for the biomarker discovery and developing potential treatments.