African dust impacts on mixed-phase and warm stratiform clouds observed from
CALIPSO and CloudSat measurements
Damao Zhang, Zhien Wang, Andrew Heymsfield, and Tao Luo
Citation: AIP Conference Proceedings 1527, 887 (2013); doi: 10.1063/1.4803413
View online: http://dx.doi.org/10.1063/1.4803413
View Table of Contents: http://scitation.aip.org/content/aip/proceeding/aipcp/1527?ver=pdfcov Published by the AIP Publishing
Articles you may be interested in
Global cloud distribution revealed by combined use of CloudSat/CALIPSO: Comparison using CALIPSO versions 2 and 3 data
AIP Conf. Proc. 1531, 456 (2013); 10.1063/1.4804805
Cirrus cloud properties from combined IIR and lidar observations of CALIPSO AIP Conf. Proc. 1531, 408 (2013); 10.1063/1.4804793
Retrieval of ice cloud microphysics by synergy use of CloudSat and CALIPSO data AIP Conf. Proc. 1100, 412 (2009); 10.1063/1.3117007
Synergy Use of MODIS, CloudSat and CALIPSO for Improved Retrieval of Liquid Water Cloud Microphysical Properties
AIP Conf. Proc. 1100, 259 (2009); 10.1063/1.3116964
Auger spectroscopic observation of Si–Au mixed‐phase formation at low temperatures Appl. Phys. Lett. 21, 272 (1972); 10.1063/1.1654374
African Dust Impacts on Mixed-phase and
Warm Stratiform Clouds Observed from
CALIPSO and CloudSat Measurements
Damao Zhang
∗, Zhien Wang
∗, Andrew Heymsfield
†and Tao Luo
∗,∗∗∗Department of Atmospheric Science, University of Wyoming, Laramie, Wyoming, 82070, USA
†National Center for Atmospheric Research, Boulder, Colorado, USA
∗∗School of Earth and Space Sciences, University of Science and Technology of China, Hefei, 230026
Abstract. Impacts of African dust particles on mixed-phase and warm stratiform clouds are inves-tigated using four years of collocated CALIPSO and CloudSat measurements. The results show that dust could enhance ice particle concentrations in stratiform mixed-phase clouds by a factor of 2 to 6 at temperatures colder than -12oC. Obvious drizzle suppression in dusty warm stratiform clouds
is also observed. The study suggests that the presence of African dust affect both mixed-phase and warm cloud microphysical properties and processes.
Keywords: Dust particle, ice concentration, stratiform clouds, remote sensing PACS: 92.60.Mt; 92.60.Nv; 82.60.Nh
INTRODUCTION
Previous studies recognized dust particles as efficient IN, which are able to initiate ice nucleation at relatively warmer temperatures and lower supersaturation [1, 2]. However, quantitative estimations of dust impacts on ice particle concentration in mixed-phase clouds are still sparse. In addition, large size dust particles coated with soluble materials when transposing in atmosphere are also efficient cloud condensation nuclei (CCN)[3]. Dust induced increase of CCN concentration leads to smaller cloud droplets and there-fore suppress the drizzle formation [4]. However, more observations are required to un-derstand this mechanism [5].
Stratiform clouds represent an ideal target for studying the dust impacts on micro-physical properties of clouds due to their relatively simple dynamical environments [6]. Collocated CALIPSO lidar and CloudSat radar measurements provide unique datasets for studying dust impacts on stratiform clouds. CALIPSO lidar is capable of detecting cloud tops and dense dust layers, while CloudSat radar observations are used to detect the appearance of large size particles (such as ice crystals and drizzle drops). In this study, four years of collocated CALIPSO and CloudSat measurements (from June 2006 to May 2010) over African and northern Atlantic regions are used study dust impacts on these clouds.
METHODOLOGY
Zhang et al. [7] developed algorithms to identify stratiform clouds from collocated CALIPSO and CloudSat measurements. CALIPSO lidar depolarization measurements are used to detect dense dust layer for cloud free regions [8]. Dusty stratiform clouds are defined as stratiform clouds with dust layers closely on one or both sides. Due to daytime noise in lidar measurements, we only consider nighttime measurements and single layer cloud cases. African dusty stratiform clouds located within the region of latitudes between 0N and 45N and longitudes between 60W and 30 E were investigated. We also include stratiform clouds with the same longitude and latitude ranges in the Southern Hemisphere for comparison, and refers it to ‘South Regions’.
Maximum radar reflectivity (Ze_max) within 500m of the top of mixed-phase strat-iform clouds from CloudSat radar was used to quantitatively study ice generation in these clouds, as presented in Zhang et al. [9]. As a further study, Zhang et al. [10] devel-oped algorithms to retrieve the ice concentrations in stratiform mixed-phase clouds using
Ze_max and a 1-D ice growth model. These algorithms are applied to dusty, non-dusty and ‘South Regions’ mixed-phase stratiform clouds to estimate their ice concentrations. While for warm stratiform clouds, -18 dBZ of Ze_max is used as a threshold to detect the occurrence of drizzle [11].
RESULTS AND DISCUSSIONS
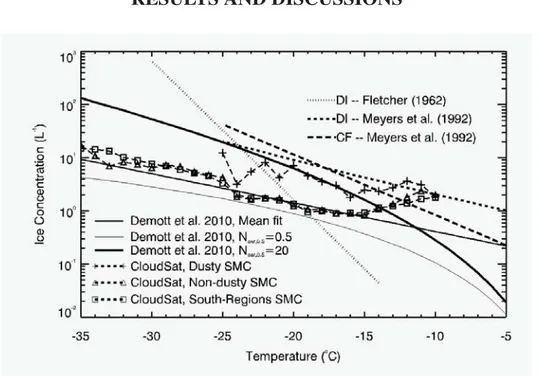
FIGURE 1. Retrieved ice concentrations from Ze_max at each CTT for: dusty, non-dusty, and ‘South
Regions’ SMCs. IN concentrations predicted from previous parameterizations [12, 13, 14] are also plotted. DI means deposition nucleation and immersion freezing and CF means contact freezing.
The retrieved ice concentrations for dusty, non-dusty and ‘South Regions’ cases and predicted IN concentrations from previous parameterizations at given cloud top tempera-tures (CTT) are shown in Figure 1. Strong temperature-dependence of ice concentrations is observed. In general, dusty stratiform mixed-phase clouds have 2 to 6 times of higher ice concentrations, but the differences between dusty and non-dusty, dusty and ‘South Regions’ cases decrease as temperature decreases. Compared with previous IN parame-terizations, DeMott’s mean fit and parameterization with Naero,05= 0.5cm−3capture the ice concentrations in ‘South Regions’ and non-dusty cases, but underestimate the dusty cases. While the DeMott’s parameterization with Naero,05 = 20cm−3 overestimates the ice concentrations for non-dusty and ‘South Regions’ cases, but represents the dusty cases well.
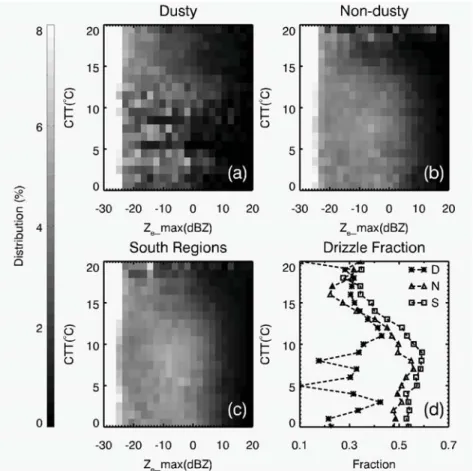
FIGURE 2. Warm stratiform cloud occurrences in terms of CTT and Ze_max within lidar backscattering
range of 0.18-0.36 (sr−1km−1) for: (a) dusty; (b) non-dusty; (c) ‘South Regions’ cases; (d) mean drizzle fractions for dusty (D), non-dusty (N) and ‘South Regions’ (S) warm stratiform clouds.
Figure 2 shows the warm stratiform clouds distributions as a function of CTT and
Ze_max for dusty, non-dusty and ‘South Regions’ cases. Obviously, dusty warm strat-iform clouds have less portion of large Ze_max . Figure 2 (d) shows that dusty warm stratiform clouds have approximately 20% lower drizzle fraction at CTTs between 0 and -10oC, compared with non-dusty and ‘South Regions’ cases.
SUMMARY
The large dataset in this study provides robust evidence that dust particles are effi-cient IN at CTT colder than -10oC. We show that dusty stratiform mixed-phase clouds
contain up to 2 to 6 times of higher ice concentrations, compared with similar clouds in background aerosol conditions. In addition, dust particles also act as efficient CCN, lead-ing to approximately 20% reduction of drizzle occurrence in warm stratiform clouds. The results suggest that the strong impacts of dust on mixed-phase and warm strati-form clouds need to be reliably simulated in models in order to capture aerosol-cloud-radiation-dynamics feedbacks.
ACKNOWLEDGMENTS
This research was funded by NASA grant NNX10AN18G, and also partially sup-ported by DOE DE-SC0006974 as part of the ASR program. We thank CALIPSO PI Dave Winker, CloudSat PI Graeme Stephens and the CALIPSO and CloudSat data group. Many thanks to J.P.Chen (National Taiwan University) and K.J. Sulia (Penn State University) for providing ice growth model data.
REFERENCES
1. C. Hoose and O. Möhler, Atmospheric Chemistry and Physics Discussions12, 12531 (2012). 2. B.J. Murray, D. O’Sullivan, J.D. Atkinson, and M.E. Webb, Chem. Soc. Rev.41, 6519 (2012). 3. C.H. Twohy, S.M. Kreidenweis, T. Eidhammer, E.V. Browell, A.J. Heymsfield, A.R. Bansemer,
B.E. Anderson, G. Chen, S. Ismail, P.J. DeMott, and S.C. Van Den Heever, Geophys. Res. Lett.36, L01807 (2009).
4. B.A. Albrecht, Science,245, 1227 (1989).
5. D. Rosenfeld, Y. Rudich, and R. Lahav, PNAS,98, 5975 (2001).
6. R.P. Fleishauer, V.E. Larson, and T.H.V. Haar, Journal of the Atmospheric Sciences,59, (2002). 7. D. Zhang, Z. Wang, and D. Liu, J. Geophys. Res.115, D00H13 (2010).
8. D. Liu, Z. Wang, Z. Liu, D. Winker, and C. Trepte, J. Geophys. Res.,113, D16214 (2008). 9. D. Zhang, Z. Wang, A. Heymsfield, J. Fan, D. Liu, and M. Zhao, Geophys. Res. Lett.39, L18805
(2012).
10. D. Zhang, Ph.D Thesis (2012).
11. D.C. Leon, Z. Wang, and D. Liu, J Geophys Res,113,(2008).
12. N. Fletcher, P. Squires, and E. Bowen, University Press Cambridge (1962).
13. M. Meyers, P. DeMott, and W. COTTON, Journal of Applied Meteorology,31, (1992).
14. P.J. DeMott, A.J. Prenni, X. Liu, S.M. Kreidenweis, M.D. Petters, C.H. Twohy, M.S. Richardson, T. Eidhammer, and D.C. Rogers, PNAS,107,(2010).