Institutionen för datavetenskap
Department of Computer and Information Science
Final Thesis
Correlational Analysis of Drivers Personality traits and
Styles in a Distributed Simulated Driving Environment
By
Muhammad Hassan Abbas
Mati-ur-Rehman Khan
Thesis No: LiTH-IDA-EX-07/052-SE
Linköping University
Department of Computer and Information Science
Final Thesis
Correlational Analysis of Drivers Personality traits and
Styles in a Distributed Simulated Driving Environment
By
Muhammad Hassan Abbas
Mati-ur-Rehman Khan
Thesis No: LiTH-IDA-EX-07/052-SE
2007-10-10
Examiner: Prof. Dr. Arne Jönsson
Supervisor: Dr. Rego Granlund
Department of Computer and Information Sciences (IDA)
Linköping University, Sweden 2007
Dedication
In the name of Allah, the Most Gracious, the Most Merciful
Team Involved
Dr. Rego Granlund
Mati-ur-Rehman Khan
Abstract
In this thesis report we conducted research study on driver‟s behavior in T-Intersections using simulated environment. This report describes and discusses correlation analysis of driver‟s personality traits and style while driving at T-Intersections.
The experiments were performed on multi user driving simulator under controlled settings, at Linköping University. A total of forty-eight people participated in the study and were divided into groups of four, all driving in the same simulated world.
During the experiments participants were asked to fill a series of well-known self-report questionnaires. W e evaluated questionnaires to get the insight in driver‟s personality traits and driving style. The self-report questionnaires consist of Schwartz‟s configural model of 10 values types and NEO-five factor inventory. Also driver‟s behavior was studied with the help of questionnaires based on driver‟s behavior, style, conflict avoidance, time horizon and tolerance of uncertainty. Then these 10 Schwartz‟s values are correlated with the other questionnaires to give the detail insight of the driving habits and personality traits of the drivers.
Keywords:
Driver behavior, Driver style, T-Intersections, Self-report measures, Schwartz Value survey, NEO-FFI, Personality TraitsACKNOWLEDGEMENTS
We are deeply beholden to my supervisor Professor Dr. Arne Jönsson for his support and guidance to perform such a valuable research work.
We are highly grateful to Mr. Rego Granlund for his continuous and valuable assistance supervision and guidance, especially for the provision of all kinds of facilities throughout my thesis work. We are grateful to Mrs. Helena Granlund for her valuable assistance, supervision and support to perform such a valuable research work. We would like to express our gratitude to Mr. Kip Smith for his continuous assistance, inspiration, patience and valuable implications and comments to improve the dissertation.
We are highly thankful to all of our teachers who had been guiding us throughout our course work and increased our knowledge. Their knowledge, guidance and training enabled us to carry out this research work.
We would like to offer our thanks to all of our colleagues in Linköping University,Sweden who have some input or influence over the course of our studies, their support and encouragement for higher education. We are thankful to all seniors for useful discussions and guidance
We would like to offer appreciation to our parents for their vision and dedication to make us learn from our childhood, and other family members for their encouragement and support.
We are also thankful to our friends who encouraged us for higher education, especially, Adeel Jameel and Ansar-ul-Haque Yasar who continued their moral support throughout our coursework.
Table of Contents
1. Introduction... 1
1.1. Objective... 2
2. Literature Study ... 3
2.1. Simulator Research ... 3
2.1.1. Types of Simulated Environments ... 3
2.1.1.1. Moving Based Simulated Environment ... 3
2.1.1.2. Fixed-Based Simulated Environment ... 3
2.2. Factors influencing safety ... 4
2.2.1. Effect of Stress on driving behavior... 5
2.2.2. Variations and traffic velocity ... 5
2.2.3. Violation of expectations ... 6
2.3. Conflict Indicating Variables ... 7
2.3.1. Time to Collision (TTC) ... 8
2.3.2. Extended Time to Collision (TET, TIT) ... 9
2.3.3. Time to Accident (TA) ... 9
2.3.4. Post-Encroachment Time (PET) ... 9
2.3.5. Gap Time ... 10
2.4. Self-report measures ... 10
2.4.1. Schwartz’s Configural Model ... 10
2.4.2. NEO Five Factor Inventory (Neo-FFI) ... 13
2.4.3. Questionnaires on conflict avoidance, time horizon and tolerance of uncertainty... 14
3. Research Questions ... 17
4. Method ... 18
4.1. Participants ... 18
4.2. Simulated scenario design study ... 18
4.2.1. Apparatus ... 18
4.2.2. The Simulator ... 19
4.2.3. The Simulated Environment... 20
4.3. Tasks ... 24 4.4. Questionnaires ... 25 4.5. Procedure ... 26 4.5.1. The Cycles ... 26 4.5.2. Pilot Study ... 27 4.6. Data Collection ... 27
5. Analysis and Discussion ... 28
5.1. Correlation between Schwartz’s Value Surveys and Questionnaires ... 28
5.1.1. Correlations between Schwartz’s value and Conflict Avoidance ... 30
5.1.2. Correlations between Schwartz’s value and Impatient Value ... 31
5.1.3. Correlations between Schwartz’s value and Hostile Value... 32
5.1.4. Correlations between Schwartz’s value and Open to suggestions ... 33
5.1.5. Correlations between Schwartz’s value and Cautious Value ... 34
5.1.6. Correlations between Schwartz’s value and tolerance of Uncertainty ... 35
5.1.7. Correlations between Schwartz’s value and Frequency of behavior ... 36
5.1.8. Correlations between Schwartz’s value and Obedient ... 37
5.2.1. Results... 38 6. Conclusion ... 38 6.1. Future Work ... 40 7. References ... 41 8. Appendix ... 43 8.1. Appendix A... 44 8.2. Appendix B ... 46 8.3. Appendix C ... 47 8.4. Appendix D ... 90
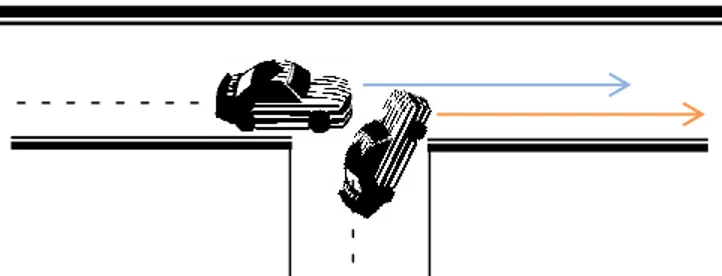
Figure 1: Crossing Path Collision ... 1
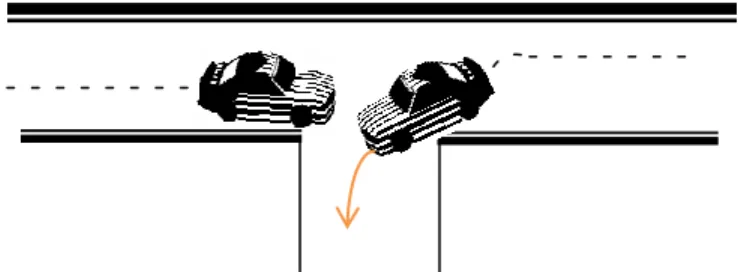
Figure 2: Turning Path Collision ... 2
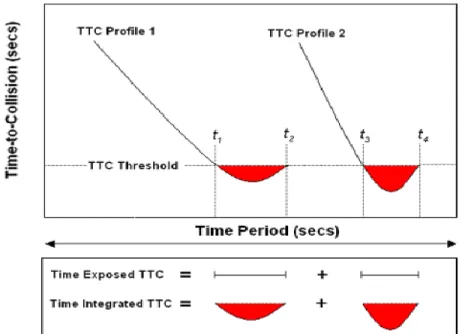
Figure 3: The Time Exposed and Time Integrated TTC proximal safety indicator measures proposed by Minderhoud and Bovy (2001) ... 9
Figure 4: Grading scale used in the Schwartz value survey ... 12
Figure 5: Relational Value Model ... 12
Figure 6: The driving simulator at LiU/IDA. ... 19
Figure 7: One of the driving simulator stations. ... 19
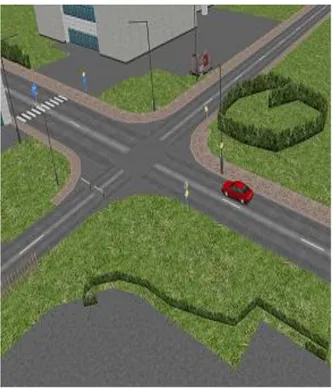
Figure 8: The Sävenäs intersection ... 21
Figure 9: Grid view of the world used ... 22
Figure 10: Simulated World for experimentation... 23
Figure 11: STControl for displaying the environment information ... 23
Figure 12: One of the signs ... 25
Figure 13: Correlation between Schwartz‟s Value Survey and Conflict Avoidance Value ... 30
Figure 14: Correlation between Schwartz‟s Value Survey and Impatient Value ... 31
Figure 15: Correlation between Schwartz’s Value Survey and Hostile Value ... 32
Figure 16: Correlation between Schwartz‟s Value Survey and Open to suggestion ... 33
Figure 17: Correlation between Schwartz’s Value Survey and Cautious Value ... 34
Figure 18: Correlation between Schwartz‟s Value Survey and Tolerance for Uncertainty ... 35
Figure 19: Correlation between Schwartz‟s Value Survey and frequency of behavior ... 36
Figure 20: Correlation between Schwartz‟s Value Survey and Obedient value ... 37
List of Tables
Table 1: Value types and descriptions of the Schwartz value survey ... 11
Table 2: Neo-FFI description ... 13
Table 3: Scale for Neo-FFI questionnaire... 13
Table 4: the driver behavior questionnaire Scale ... 15
Table 5: The mean and standard deviation of participants‟ age ... 18
Table 6: Summary of Scenarios used for experimentation ... 22
Table 7: The order of scenarios ... 24
Table 8: The sentences ... 25
Table 9: The fixed order of questionnaires ... 26
GPS Global Positioning System
ANOVA Analysis of Variance
IVSS Intelligent Vehicle Safety Systems
SIKA Statens institut för kommunikations analys
LiU Linkoping University
IDA Department of Computer and Information Sciences
PET Post Encroachment Time
TTC Time to Collision
TET Extended Time to Collision
TA Time to Accident
GT Gap Time
DTI Distance to Intersection NEO-FFI NEO-Five Factor Inventory
DSQ Driver Style Questionnaire DBQ Driver Behavior Questionnaire
DRP Driver Risk Perception Questionnaire
OTS On The Simulator Questionnaire
Introduction
1. Introduction
The world population according to the U.S Census Bureau (http://www.census.gov/ipc/www/worldpop.html) is 6,605,046,992 and at the end of 2015 world population will be approximately 7,229,967,861. Due to this population increase the number of vehicles on the road is also growing in numbers, which leads to more traffic density and hence greater risk of accidents. Safety of the people is becoming more important and therefore more research and development is required in developing intelligent vehicle safety systems. These intelligent vehicle safety systems should be constructed on analyzed data, observations and statistics. So the study of driver‟s behavior on roads is an important step in understanding the causes of the accidents.
Statistics have shown that in 2005 a total of 1098 severe traffic accidents occurred in Sweden (SIKA 2006) and about half of them happened in intersections, so intersections are important in discovering the mistakes made by drivers and what countermeasures must be taken so that drivers avoid such mistakes. Hence study of driver‟s interaction with other drivers on intersection is very crucial in understanding the behavior of drivers in intersection and this study mainly focuses on the driver‟s interaction in intersection. The intersection accidents are most commonly divided in to two categories that are cross path collisions and turning collisions. Cross path collisions are those collisions when two vehicles have been traveling on different roads and with crossing paths. These collisions made up 27% of all the accidents that occurs on the road. Whereas Turing collisions are those collisions when two vehicles have originally been traveling on the same road, in the opposite or same direction, and one or both vehicles have begun executing a turn. These collisions correspond to approximately 16% of all the traffic road accidents. And when these two categories are combined together they made up of 43% of all the road traffic accidents in Sweden.
Figure 2: Turning Path Collision
From the statistical analysis of UK accident data it is found that 61% of all personal injury accidents occurred on intersections. In United States, the percentage of intersection accidents is 44% in reported accidents. Another study by Ragland and Zabyshny, 2003; Autoliv 2007 states that 50% of all pedestrian deaths and injuries are caused by intersections.
The study of statistical data and reports shows a large number of accidents are occurred on intersections, which drives us to perform experiments and make systems and methods to reduce or prevent the intersections accidents problems.
1.1. Objective
The main idea is to study the behavior of drivers and how they behave when they come across intersections in real life. This study is performed by using a multi-user distributed driving simulator. In a simulated environment, we can observe the traffic safety rules easily and control the driver‟s environment without any risk of personal injuries and accidents. This study will perform a series of experiments by using drivers as subjects in the simulated driving environment. Each experiment consists of particular tasks and rules that should be followed by the drivers during the experiment. In between each experiment drivers were asked to fill out well-prepared and researched series of questionnaires, for providing information about the driver‟s behavior in daily life. A correlation analysis is performed with the gathered information from the questionnaires and drivers driving data. A statistical result will be prepared on the basis of correlation analysis to deduce some driving safety tips for intersection accidents.
Literature Study
2.
Literature Study
2.1. Simulator Research
A traffic simulator can provide valuable information about driver behavior response in accident events that are simply too dangerous for any person to be exposed to. (Wedlin, 2004)
2.1.1. Types of Simulated Environments
There are two types of simulated environments, first one is moving based simulated environment and second one is fixed-based simulated environment. (Reed and Green, 1999)
2.1.1.1. Moving Based Simulated Environment
A moving based simulator gives feedback from the steering wheel and the chair about how the car is moving in the simulated world.
2.1.1.2. Fixed-Based Simulated Environment
This simulated environment gives no feedback from the steering wheel and the chair. A validity study made by Reed and Green on fixed-based simulator and comparison with real world cars shows that fixed-based simulators has been found to be less precise than that of actual vehicles or moving-based simulators mainly due to the lack of motion queues.
Sideway steering precision was worse in the simulator as compared to a real car. However in Reed and Green study showed that participants were better at keeping a constant speed in the simulator as compared to real car. They claimed that it is most likely a result of the absence of wind and uneven roads.
The degree of importance of the simulator‟s validity can vary depending on the nature of study and ecological validity of the simulator. Advanced and expensive simulators may seem to be the best option but depending on the research question and the goal of study. One may be able to use a simpler simulator with less ecological validity and still get good results. More advance simulators should be used in those cases where the main focus is to get the realistic feeling of driving and that the ecological validity must be high. Whereas if the main focus is on the behaviors in a driving environment, then a less advance simulator might me suffice (Santos et al., 2005).
speed control but shows an overall low absolute validity. At the same time they show a high relative validity on the driving accuracy. A fixed-based simulator has generally low absolute validity and high relative validity.
Santos‟ et al. (2005) study on driving behavior using a simulator compared and evaluated a standardized visual performance test in three different environment‟s laboratory, simulator and instrumented vehicle. The goal of study was to assess the suitability for each test environment for testing the effects of In-Vehicle-Information-System on driving performance.
Simulator results couldn‟t be applied to the real world whereas they gave an enormous strength to the experimental design. A comparison between simulator and the instrumented vehicle with self report data indicated that the level of seriousness, of potential effect with respect to traffic safety, was lower in the simulator compared to the instrumented vehicle. Despite this the study provided a good first insight to the vehicle development industry for the improvement of assessing and designing for example safety systems.
A study made by Hancock and de Ridder (2003) on accident avoidance behavior in a controlled simulated environment, focus on the final seconds and milliseconds before a collision. There simulated environment was constructed so that drivers could be seated in two full vehicle simulators and interact within the same simulated world. That setup meant that they could create simulated situations that could evoke responses paralleling those observed in real world situations. In the experiment, a total of 45 participants were tested within the virtual world. Two ambiguous traffic situations were created for the driving participants, who crossed path with each other in the simulated world. Those situations were an intersection and a hill. In the intersections the two drivers met by approaching each other from an angle of 135 degrees. Objects blocked their views to keep both drivers from detecting each other early in the scenario, where as the hill scenario represented a wrong way conflict. Qualitative results were obtained through post experience questionnaires about the participant driving habits, simulated experience and their response to specific experimental events. Their study shows that situations with realistic avoidance response behavior can be created and replicated in a simulation environment. Hancock and de Ridder (2003) methodology is used in our research.
2.2. Factors influencing safety
People‟s behavior and performance is affected by several factors of daily life. In particular case of traffic safety, it is prohibited to drive a car after taking alcohol or other drugs. Jeffery Archer (2005) explains internal and external factors like stress, fatigue, social psychological factors such as attitudes, social cognition, biases and norms and
Literature Study
personality factors of daily life which can affect a person‟s behavior during driving. Swedish Road Authority (SRA, 1996) has also identified human functions that are critical for safe driving. SRA points out that stress, strain, tiredness, alcohol, medication as factors which can have a serious negative effect on driver performance. They also identified that inexperienced and incorrect attitudes of drivers can be potential problem areas with regard to safety. The factor‟s which can be important from research point of view and can be studied during simulated research involves drivers attitude and stress about the task and effect of this on the driving parameters.
2.2.1. Effect of Stress on driving behavior
According to Hennessy and Wiesenthal (1999) many traffic accidents occur due to stress or aggression in the driver‟s behavior. The reason of person‟s in stress may be due to the problems of job or home or time pressure. A stress condition during driving can make the person behavior aggressive on the road, as a result can be a cause of accident. Hennessy‟s and Wiesenthal (1999) research examine the difference between the stress and aggression state of driver‟s in high and low congestion conditions. The results of the study shows a high level of stress and aggression in the driver‟s in high congestion conditions. It is noticeable that time factor was main cause of stress in high and low congestion conditions, and aggression was the cause of stressful behavior in high congestion conditions.
Howard and Joint (1994) discuss the relation between stress and fatigue in driving. They say that long distance driving becomes the cause of fatigue for drivers whose minds are busy in thinking something else while they are driving. Those drivers are driving without awareness. This fatigue can cause stress in drivers, which is a result of concentration of mind in other things during driving. It is seen that when you are concentrating on other things during driving, distraction can occur easily. This distraction during the driving can be dangerous and hinders the driver‟s concentration during driving and cause accidents.
This study proves that stressful conditions can affect a persons driving behavior, yet this research is not opted to create stress less behavior.
2.2.2. Variations and traffic velocity
A connection between the variability of the vehicles speed and road safety is discussed by Solomon (1964). There is a deep connection between speed of the vehicles and traffic safety. Speed reduction helps to improve safety on roads. Solomon in his paper discusses relationship between crash risks and variability in speed i.e. sub-optimal
Solomon study shows research of 10,000 crash reports in 35 sections of rural highways between 1955 and 1958. He shows that pre-crash speed of vehicle was determined by police, the driver himself or the witnesses of the crash sites. Solomon study involves the calculation of 290,000 vehicles speeds on each of the 35 sections of rural highways. He than calculated the mean speed for each of the 35 sections. While doing the comparison of the speed of the vehicle during the crash with means speed of particular road section Solomon found that crash-involvement rate was higher when vehicle drove faster or slower than the mean speed of the particular section. And the crash-involvement rate was rather low where mean speed is clos e to the vehicle speed.
The accidents occurring at mean speeds below average could be because of numbers of intersections and driveways on the crashes spots stated by Frith and Patterson (2001). Those points may be the reason for congestion on the roads. Solomon also states the same consideration, with reference to other places which also share the same point that intersections and other access points are reason for large number of accidents. So it is not correct to conclude that only high or low speed on highways can be a factor for accidents occurrence, also low speeds at intersection may also cause accidents to occur.
In the Solomon‟s study results 46% of the totals are low-speed crashed, 51% were rear-end crashes and 38% were angle crashes. The accidents occurring at intersections and congestion conditions at rear-end. Driving with high speed are cause accidents to occur more frequently.
“The smaller the variation within the stream, the smoother and safer the traffic flow will be.” (p. 6) said by Frith and Patterson (2001). A study about New Zealand in Frith and Patterson (2001) tells us that if the mean speed is lowered the variation in the traffic is decreased. This takes us to the conclusion that the reduction in speed variation takes us to the traffic safety. For decreasing the variability in the traffic velocity, we can make the slow moving drivers drive fast or fast moving drivers drive slow. Later case is the best option, as fast driving can lead to more accidents, so it is better to reduce there speed.
This shows that traffic velocity has significant role in the traffic safety. In simulated environment traffic velocity can be enforced easily with the help of simulation experiments, which is the reason of including range of traffic velocity in our experiments. 2.2.3. Violation of expectations
Anticipated behavior of other people is expectation. During communication it can be generalized or person specified. Expectancy violation theory can be used to examine effects of expectations. According to this theory, other people expect the communication
Literature Study
process that results in either a positive or negative evaluation of the perceived outcome. Following are the factors that affect the outcome, according to the expectation violation theory: target characteristics, relationship characteristics and context features.
Theory of expectancy and Theory of expectancy violation provides support to study the behavior changes occur due to the changes in perceived and expected behavior. In order to study changes in behavior, differences in expectations are created by e.g. manipulation of instructions. Expectancy violation theory according to Bonito et al. (1999) “…is concerned with the degree to which expectations frame behavior and the
consequences of such framing on interaction and task outcomes” (p. 231).
Interpretation and evaluation of violation of expectations is a very important issue of expectancy violation theory. Positive or negative valence is assigned during the characterization of violations. Positive violation are socially valued behavior that exceeds the quality of anticipated actions, while on the other hand negative violations are relatively undesirable acts that fall short of expectations.
In 1976 Burgoon introduced the theory of expectation violation. It was at that time used at theory of non-verbal behavior. This theory is specific towards theory discourse and interaction and also considered as theory of communication processes. Burgoon and Le Poire, (1993) presented their study “Affect of communication expectancies, actual
communications, and expectancy disconfirmation on evaluations of communicator and their communication behavior” and Bonito et al. (1999) presented “The role of expectations in human-computer interaction” both uses those theories in their studies.
The study by burgoon and Le Poire shows changes in expectations due to different factors. Bonito et al. (1999) study shows support of expectancy violations theory‟s premises and predictions. The study by Bonito et al. (1999) shows the decision making tasks difference when people are interacting with the human partners or compute agents. Influence and perceptions of partners are affected by expectations and evaluations which are shown by correlation analysis of five different computer conditions.
In our experiments, drivers expectation are analyzed by providing them different instruction sets to see if it would create deviations of expectations, so to view a change in the driving behavior of the drivers.
2.3. Conflict Indicating Variables
A traffic conflict may result in a collision if the traffic participant would have continued with the same speed and direction. It is always desired to be able to predict the probable accident or collision by finding different factors involving the collision. Conflict
variables have lot of importance in order to draw useful outcomes. It is possible to get these details from the simulated environment with respect to the each participant and analyze his behavior. Conflict indicator‟s classification depends on its handling in a specific safety situation.
Conflict variables can be calculated using two types of method. Objective Methods
These methods feature time distance and speed to calculate the severity of the safety situation.
Subjective Methods
These methods are dependent on human observation, who records the perceived risk at the moment of conflict. It is also possible to use a video observation from a fixed camera
To be able to get better result the combination of the mentioned methods may be used (Lu et al., 2001). The merging of these methods results an appropriate risk value. The usefulness of these variables can be classified by evaluating the following three criteria (Svensson 1998):
1. Indicators should complement accident data and be more frequent than accidents
2. Indicators have a statistical and causal relationship to accidents
3. Indicators have the characteristics of ‘near-accidents’ in a hierarchical scale that describes all severity levels of driver interaction with accidents at the highest level and very safe passages with a minimum of interaction at the lowest level.
Some of the variables which are relevant for the current study are described as under. 2.3.1. Time to Collision (TTC)
In studies related to Traffic Conflicts Techniques, Time-To-Collision (TTC) has been considered to be a valuable measure for rating of traffic conflicts‟ severity and to differentiate between critical and normal behavior.
Hayward (1972) defined TTC as: "The time required for two vehicles to collide if they
continue at their present speed and on the same path". TTC continue to be decrease if
there is no change in speed and path. Disadvantages of TTC according to Archer are that it does not clarify the sternness of a traffic situation and not a good measure for comparison.
Literature Study
2.3.2. Extended Time to Collision (TET, TIT)
Two alternative to proximal safety indicators have been proposed by Dutch researchers Minderhood and Bovy (2001) on the basis of general principles of the Time-to-Collision concept. These are Time Exposed TTC (TET) and Time Integrated TTC (TIT).For the period where TTC-event remains a chosen TTC-threshold TET is used to calculate the time of that period. On the other hand TIT referred to as Time Integrated TTC (TIT), is similar to the TET but it represents a measure of the integral of the TTC-profile during the time it is below the threshold.
Figure 3: The Time Exposed and Time Integrated TTC proximal safety indicator measures proposed by Minderhoud and Bovy (2001)
2.3.3. Time to Accident (TA)
Time to Accident is a Safety indicator measure which based on a subjective estimation of speed and distance for conflicting road-users at a common conflict point. The Time-to-Accident measure is recorded only once at the time when evasive action is first taken by a conflicting road-user. TA-values are used in determination of the scale of conflict seriousness accordance with a threshold function (Archer 2005).
2.3.4. Post-Encroachment Time (PET)
The main difference between PETs and TTCs is the absence of the collision course criterion i.e. even if no collision occur PET value can be calculated. PET‟s can be easily extracted using photometric analysis, video or simulated environment, than TTC as with TTC relative speed and distance data is required. It represents time difference between the passage of the “offended” and “conflicted” road-users over the area where collision may occur. This makes PET a useful objective and less resource-demanding in contrast of TTC‟s data extraction process. It is so as PET does not involve recalculations at each time-step during a conflict zone or safety warning zone (Archer 2005).
On the other hand the PET-concept is only useful in the case of transversal (i.e. crossing) trajectories in safety critical events. TTC- concept suits for events with similar trajectories. PET-measurement are done on a fixed projected point of collision, rather than one that changes with the dynamics of the safety critical events.
Small PET values indicate that two vehicles have a short distance to one another, whilst zero PET values indicate a collision between two vehicles. Thus PET is a measure of how nearly a collision has been avoided. These considerations led us to adopt PET as our measure of when an incident has or may have occurred, and thus we can draw conclusions about driving behavior in intersections.
2.3.5. Gap Time
If the road user continues with the same velocity and trajectory then the time lapse between the completion of an approaching by a turning road-user and the arrival time of a crossing road-user is known as Gap Time (GT).
The „Gap Time‟ concept estimates the time of arrival at the potential point of conflict in spite of the actual time difference. It relies on a measure at the point when evasive action is first taken. While this accounts for the effect of braking by a secondary vehicle the elementary nature of the original PET concept is lost as resource demanding measures of both speed and distance are required during data extraction process (Archer 2005).
2.4. Self-report measures
2.4.1. Schwartz’s Configural ModelDifferent questionnaires were obtained to gather information about the behavior, personality, religious beliefs of the participants. One of the most authentic and reliable questionnaire was of Schwartz value survey. It was used for correlation of the Schwartz value survey with other questionnaire values such as NEO Five Factor Inventory.
Literature Study
insight on the basis of empirical cross-cultural studies (Schwartz, 1992; Schwartz & Bilsky, 1987, 1990). Values were defined as desirable transsituational goals, varying in importance, that serve as guiding principles in the life of a person or social entity (Schwartz, 1994, p. 21) (Schwartz Value Survey).
Three universal requirements were thought to be at the root of values: needs of individuals as biological organisms, requisites of coordinating social inter action, and requirements for the functioning of society and the survival of groups. From these three basic goals, 10 motivational value types were derived; they are described in the table 1.
Value type Symbol Description
Self Direction SD Independent thoughts and actions; autonomy and independence.
Stimulation ST The organismic need for variety, excitement, novelty, and challenge.
Hedonism HE Pleasure or sensuous gratification for oneself.
Achievement AC Demonstrating competence to obtain social approval; the focus is social esteem.
Power PO Attainment of social status and prestige, and control or dominance over people and resources; the focus is social esteem.
Security SE Safety, harmony, and stability of society, of relationships, and of self.
Conformity CO Self-restraint in everyday interaction; restraint of actions, inclinations, and impulses likely to upset or harm others and violate social expectations or norms.
Tradition TR Respect, commitment, and acceptance of the customs and ideas that one‟s culture or religion imposes on the individual.
Benevolence BE Concern for the welfare of close others.
Universalism UN Understanding, appreciation, tolerance and protection of the welfare of all people and for nature.
In total there were 57 questions which are graded using a nine-point scale by rating each one according to the importance of the values as the guiding principle of the participant life. The “-1” rating stands for a value which highly oppose the beliefs and “7” as the most or of supreme important principle of life.
Figure 4: Grading scale used in the Schwartz value survey
Schwartz also identified the dynamic relations among them. For that purpose he analyzed data using Smallest Space Analysis that represents values as point in a multidimensional space where the distance shows their empirical relations. Figure 3 shows the generated model. Circular shape represents that boundaries are more seen as continuous than discrete and values which are more close to each other are compatible where as values opposite of one another are most in conflict.
Literature Study
2.4.2. NEO Five Factor Inventory (Neo-FFI)
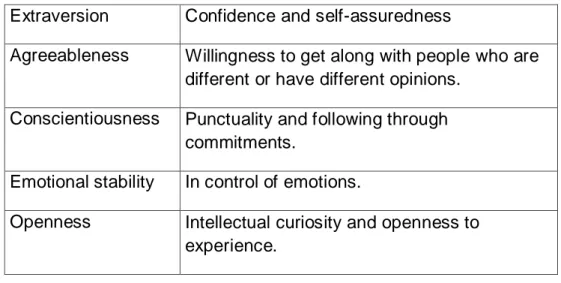
NEO Five Factor Inventory is used to measure the personality traits. There are said to be Big Five model, these big five are the five domains of the adult personality. These are Extraversion, Agreeableness, Conscientiousness, Emotional stability and Openness (Costa and McCrae, 1992). This model is widely used to get the better understanding of the differences between the different subjects or individuals. NEO Five Factor Inventory is described in the table below.
Extraversion Confidence and self-assuredness
Agreeableness Willingness to get along with people who are different or have different opinions.
Conscientiousness Punctuality and following through commitments.
Emotional stability In control of emotions.
Openness Intellectual curiosity and openness to experience.
Table 2: Neo-FFI description
In our questionnaire there are total of 60 questions, which are graded by the scale shown below in the table.
1. Strongly disagree 2. Disagree 3. Neither disagree nor agree 4. Agree 5. Strongly agree
Table 3: Scale for Neo-FFI questionnaire
2.4.3. Questionnaires on conflict avoidance, time horizon and tolerance of uncertainty
In Smith‟s et al (2007) study several questionnaires were used to see the involved cooperation and decision making in micro worlds and cultural differences. These questionnaires are on conflict avoidance, time horizon and tolerance of uncertainty. These questionnaires used the same scale mentioned above in Table 2.
In conflict avoidance there are 23 questions in total, these questions assessed the person‟s ability to react to conflict. The tolerance of uncertainty instrument consists of 24 items that assessed the degree of comfort in decision making situation with incomplete information or in an unfamiliar situation. In time horizon there are 18 questions, these question assessed how far people plan in advance, the time frame of their goals, and how far ahead they look to justify their actions.
2.4.4. Questionnaire on Locus of control
Rotter (1966) developed Locus of control questionnaire, it consists of 13 questions. It measures locus of control of the participants or people that it is either internal or external. People with internal locus of control have a strong belief that their own actions determine their success in life where as on the other hand people with external locus of control believe that there is a hand of nature that control the larger degree of their actions and that their own behavior does not matter as much.
In locus of control there were two statements and participant has to select one of the two statements which he or she feels correct.
2.4.5. Driver Behavior Questionnaire (DBQ)
Driver Behavior Questionnaire was first developed at the University of Manchester, in United Kingdom. This questionnaire gives a detail insight of the driving habits of the driver during driving. There are three main types of driving behaviors, and all the questions in the questionnaire belong these three categories.
Lapses – absentminded behaviors with consequences for the perpetrator while not threatening to other road users.
Errors – Typically misjudgments and failures of observation that may be dangerous.
Violations – Deliberate actions that break against norms and rules in traffic.
Literature Study
In Driver Behavior Questionnaire there were total of 24 questions and participants were required to indicate on a 5 point-scale (shown in Table 4) how often they indulged in the proposed behavior.
Hardly
ever Occasionally Quite often Frequently
Nearly all the time
Table 4: the driver behavior questionnaire Scale
2.4.6. Driver Style Questionnaire (DSQ)
Driver Style Questionnaire was also first designed in United Kingdom as a tool to judge the drivers style of driving. The questions in DSQ can relate to six different factors of driver style, these are described as under:
Focus – The ability to drive cautiously and ignore distractions.
Calmness – The ability to stay calm in dangerous and quick-paced situations.
Social resistance – The driver‟s preference for being given advice about driving abilities.
Speed – Whether the driver drives fast and/or over the posted limit.
Deviance – Whether the driver‟s behavior are inconsiderate and dangerous.
Planning – Whether the driver tend to plan ahead before setting out for a trip.
These questionnaires was created in such a way that it includes questions about behavior related to accidents, decision-making styles and reactions to advice that other gives them.
2.5. Data Analyzer Study
The simulator was configured so that it collected the relevant data for this project. During the session all four simulator did record all real time data that was defined in the configuration.
To analyze the data we constructed a Java based analyzer program. The analyzer was based on the analyzer being developed by the previous group (Sanna, Natalia, Fredrik
Research Question
3. Research Questions
In this simulated research, we have tried to foresee the behavior of drivers while driving in a simulated environment. Behavioral analysis was based on pre-research questionnaires by Schwartz and Other researchers. We have chosen three hypotheses in relation to the aims and goals of this research.
The research question is the diversity in the drivers‟ behavior on the basis of their personal traits.
H0: Drivers with more desire of power and achievement has more aggressive and impatient nature while driving.
H1: Drivers with helping and caring traits are more focus towards smooth and careful driving to avoid accidents.
H2: Drivers which have high tolerance for uncertainty tends to have more self-control in uncertain situations.
To assess whether these hypotheses fit into one‟s personality and affect the driver‟s behavior, drivers were asked to fill out questionnaire during their driving sessions. The data from the questionnaires was collected from 48 persons. If the analysis with from the data support our hypothesis we can say it is true to some extent otherwise we
4.
Method
The implementation of the project was conducted by the help of four multi-user driving simulators that were located at IDA at LiU. Each experimental session lasted for approximately two and a half hours. The participants also filled out several questionnaires. These were used to examine if certain personality types correlate with PET data. The total experimentation period lasted for two weeks. The subjects were from different parts of the world having different nationalities.
4.1. Participants
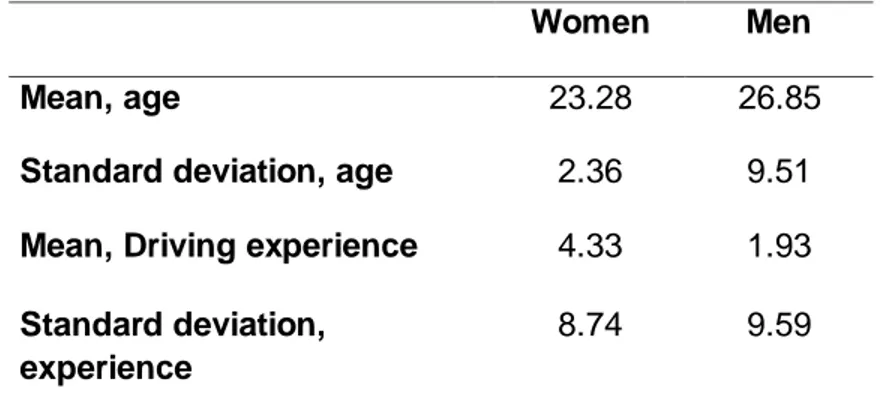
A total of 48 participants were selected through posters put up all over IDA, Linkoping University. A valid driver‟s license was a requirement for participation. T2he participants were mostly students at the Linkoping University. The mean and standard deviation of the participants‟ age and driving experience in years is also calculated.
Women Men
Mean, age 23.28 26.85
Standard deviation, age 2.36 9.51
Mean, Driving experience 4.33 1.93
Standard deviation, experience
8.74 9.59
Table 5: The mean and standard deviation of participants’ age and driving experience in years
4.2. Simulated scenario design study
The simulated scenario design study is based on the apparatus used and the mode of experimentation.
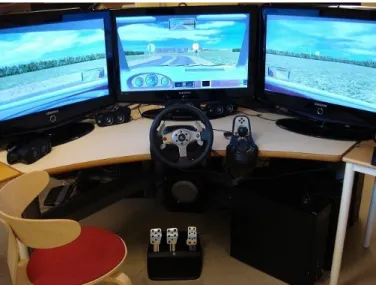
4.2.1. Apparatus
There were four driving simulators installed at the Department of Computer and Information science at Linköping University. No driver was able to see the other driver.
Method
Figure 6: The driving simulator at LiU/IDA.
Figure 7: One of the driving simulator stations.
4.2.2. The Simulator
There were four driving simulators installed and interconnected on a Local Area Network at the Department of Computer and Information science at Linkoping University. This driving simulator is able to extract and capture the driving patterns of the real and autonomous drivers.
lane position, distance to intersections and many more can be captured with the help of the scripting language.
The simulator application, the world design tool and the data processing tool was developed by the Dutch company STsim and the graphics engine was based on the Open Scene Graph high performance 3D open source graphics tool kit.
Three of the four simulators had 32” Samsung LCD screens and one had the smaller 19” Samsung LCD to display. The main application was equipped on a Dell machine which was used to control the driving environment.
The steering wheel that has force feedback, the pedals and gearbox were manufactured by Logitech and were the same for all four stations. The sound was also from Logitech and headphones for each of the driver to avoid mixing of noises.
4.2.3. The Simulated Environment
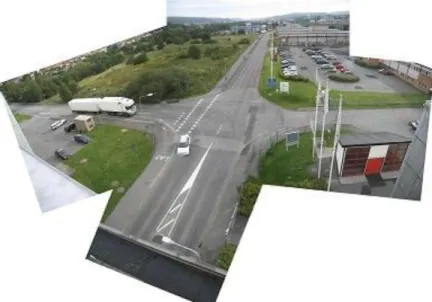
Our study involves simulated world and creation of scenarios very close to the reality. Reality involves that the driver feels comfortable with the environment, vehicles coordination and respecting the rules. The Sävenäs intersection (see figure 6) was reproduced in the driving simulator is an un-signalized T-intersection in the outer parts of Gothenburg. The reason behind selecting this intersection was due to the heavy traffic load on it causing road traffic accidents. Another major reason for selecting the Sävenäs intersection is that the buildings and vegetation around the intersection block the drivers‟ view earlier studied by Hancock and de Ritter (2003).
The road slopes around the actual Sävenäs intersection could not be implemented in the simulated world due to the limitations in the simulator. The other elements of the intersection were represented in a realistic manner.
Method
Figure 8: The Sävenäs intersection
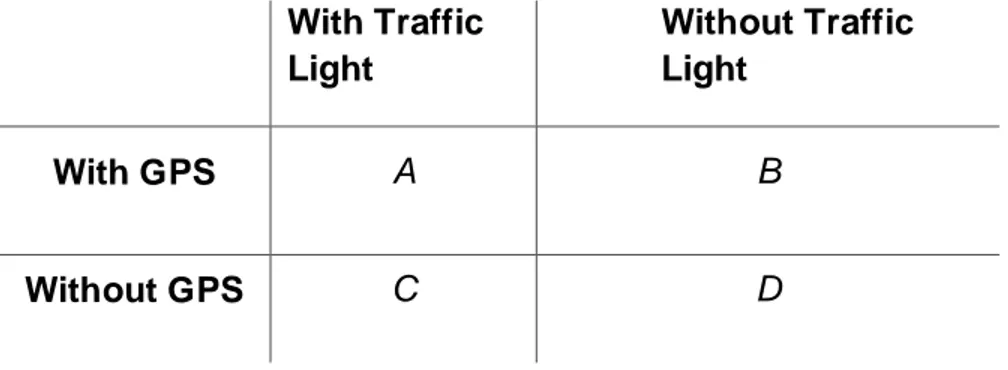
There were four different scenarios in our study, in which a driver was analyzed. There were total of four real and eight autonomous cars making a grand total of twelve cars in a single scenario. The driving speed was 50 km/h for the autonomous cars and the speed limit was the same for the real drivers. Scenarios were designed to find the changes in the behavior of the driver. The proposed scenarios were:
Scenario A: World with the Traffic Light and voice based command system
(GPS).
Scenario B: World with the Traffic Light but without the GPS.
Scenario C: World with the GPS but no Traffic Light functionality.
With Traffic Light Without Traffic Light With GPS A B Without GPS C D
Table 6: Summary of Scenarios used for experimentation
The traffic light and the voice based command (GPS) system were implemented in order to help the drivers to meet at the intersection so that we can get more relevant data. The implementation was achieved using the scripting language provided by the simulator.
The first step involved the designing the simulated world using the simulation software (stRoadDesign by STSoftware) for simulated world designing. It was important to have T-intersections in our simulated world. All the scenarios were implemented on the same world shown as under:
Method
Figure 10: Simulated World for experimentation
Although the world was same for each scenario, STScenario scripting language was used to implement Traffic Light and the GPS.
Traffic light and GPS were introduced in the world to make it possible that driver intercept each other more frequently at the T-intersection. Traffic Light was controlled with respect to the position of vehicles. Along with the STRoad Design and STScenario, STControl is used to control the environment in the simulated world on each of the simulator.
The order of scenario presentation was shuffled across all the 12 experimental groups. This was done to decrease the perplexing variable of driving the same session before another. Table 7 shows the order of the scenarios for each experimental group.
Experimental group Scenarios Order
1 ABDC 2 BCDA 3 CDAB 4 DABC 5 ACBD 6 CBDA 7 BDAC 8 DACB 9 ADCB 10 DCBA 11 CBAD 12 BADC
Table 7: The order of scenarios
4.3. Tasks
In each session the participants were assigned a task to generate a purpose for their driving and to make them more eager to explore the world. The task was different in each of the four sessions. The drivers had to collect a number of signs (words) collectively forming a sentence. The sentence is a part of a song which were tokenized randomly.
Method
Sentences Session A:
Meet you downstairs in the bar and heard Your rolled up sleeves and your skull t-shirt. Session B:
Hey baby, when we are together, doing things that we love. Every time you're near I feel like I‟m in heaven, feeling high. Session C:
Every night in my dreams i see you, i feel you that is how I know you go on far across the distance and spaces between us.
Session D: "I'm Alive"
When you call on me When I hear you breathe.
Table 8: The sentences
Figure 12: One of the signs
The signs were placed randomly in each of the world. The drivers had to drive through the world according to the requirements of the session and collect the signs. They had to pull off the road, giving way to other traffic, on the side walk to stop and write down each of the sign.
4.4. Questionnaires
0 1 2 3 4 5 6 7 8 9 10 11 Personal Information Demographic Neo – FFI
Schwartz value survey part 1 Schwartz value survey part 2 Time Horizon
Tolerance for uncertainty Conflict avoidance
Locus of control Driver style Driver behavior Debriefing
Table 9: The fixed order of questionnaires
4.5. Procedure
A group of four participants were called upon on a single occasion. Four experimenters were there during the experiment sessions. The experimenters loaded the correct scenarios and helped the subjects in case of any problems. The experiments also monitored the subjects for careless driving.
The participants when arrived for the experimentation, they were asked to take a simulator. The set of printed instructions along with the consent form was given to all of the participants. One of the experimenters‟ read the instructions loud about the experiments and the sessions. The written instructions in English were also being provided to each of the participant. The participants were then asked to fill in the personal information questionnaire.
The participants had to start off with a practice session lasting 10 minutes so that they can get familiar with the driving environment. Experimenters helped each participant during the practice session so that they can drive properly. After the practice session the regular sessions were started along with a series of questionnaires to fill in.
4.5.1. The Cycles
The main experimental trial consisted of 4 sessions as described earlier in Table 6. Each cycle was followed by a series of questionnaires. The participants were given instructions about the upcoming sessions verbally by the experimenter. The participants had to listen to the instructions about the specific session using scripting within the session.
Method
The participants were not allowed to talk between the sessions although they could ask the experimenter if they had any problems related to the sessions. A short coffee break was given after the second cycle. The length of the break varied between 15 to 25 minutes. The participants had to drive two more sessions after the coffee break. The total time of all the sessions was about 2 hours and 30 minutes. The participants were provided with a cinema ticket as thank you gift in the end.
4.5.2. Pilot Study
A pilot study was conducted with the first four participants before calling on other participants. There were a number of flaws identified in the time of the practice session and the instructions for driving the car. The errors were then fixed for the next experiments. As a result the practice session was prolonged for 10 minutes in total whereas the instructions for driving a car were provided in black and white.
4.6. Data Collection
The Data Analyzer was developed using Java in order to collect the relevant PET, speed, acceleration and lane position variables from the data collected. The chosen data from the sessions contained statistics from within 30 meters of the Sävenäs based intersections.
The PET was calculated if two vehicles were both within 30 meters of the centre point of the intersection at the same time. The PET algorithm worked only when one of the vehicles made a left turn, a right turn and when those vehicles had entered the intersection in different lanes. The predetermined threshold for calculating PET -values was set to 10 seconds i.e. we are not analyzing PET values above 10 seconds (Patrik 2007).
5. Analysis and Discussion
5.1. Correlation between Schwartz’s Value Surveys and
Questionnaires
Schwartz‟s Value Survey (Appendix C), consists of 57 human values that are formed into ten broader types. These reflect three universal human requirements: 1) biological needs, 2) needs for social coordination, and 3) need for group welfare and maintenance (Smith et al., 2006). During the experiments drivers were asked to fill Schwartz‟s value surveys, which will help us to have an insight view of personality traits. Other questionnaires related to the participant‟s personal driving behavior and style, were also used to collect information. Based on that qualitative data, a correlation analysis was performed between Schwartz‟s value survey and other questionnaire variables. Correlation is a measure of the strength of relationship between pair of variables. This section explains the results and analysis based on the correlation between Schwartz‟s value survey and Questionnaires.
In our thesis we are correlating Schwartz 10 motivational value types with NEO Five Factor Inventory, conflict avoidance, time horizon, tolerance of uncertainty, Locus of control, Driver Style and Driver Behavior. The ten different value types of the Schwartz‟s value survey are presented in X-axis. These values represent preference of values in life. The Y-axis denotes the correlation value from different questionnaires such as time horizon. Here is the regression parameter that shows different questionnaires with their respective peak values of the Schwartz‟s Model.
Analysis and Discussion
Scale / Measure Questionnaire Type B0 B1 SD B1
Phase Angle
Peak Value
Type r^2
conflict Avoidness conflict Avoidness -0.01359 0.231628 0.038423 289 CO 0.78
Impatient DBQ 0.016447 0.216158 0.038818 188 AC 0.76 Hostile DBQ 0.006 0.173 0.036 221 PO 0.70 Open DSQ -0.012 0.188462 0.040109 342 BE 0.69 Cautious DSQ -0.01771 0.211192 0.046364 293 BE 0.67 Tolerance for Uncertanity Tolerance for Uncertanity 0.019639 0.257515 0.061208 77 SD 0.64 Authentic OTS -0.01923 0.241695 0.063166 294 CO 0.59 Frequency of behavior DRP -0.00138 0.142224 0.040514 218 PO 0.55 Obedient DSQ 0.010352 0.18572 0.05965 55 UN 0.49 1 / Neuroticism NEO-FFI -0.001 0.166 0.055 242 SE 0.49 Openness NEO-FFI 0.013618 0.157609 0.051372 105 ST 0.48 Difficulty OTS -0.01229 0.172446 0.062896 294 CO 0.43
Side View OTS 0.013607 0.09237 0.040759 173 AC 0.34
Extraversion NEO-FFI 0.009233 0.170733 0.077316 106 ST 0.33 E omission DBQ -0.00395 0.157877 0.076405 239 SE 0.30 Real OTS -0.02382 0.151837 0.076013 279 CO 0.29 E commission DBQ -0.01458 0.137625 0.071226 289 CO 0.27 Forgetful DBQ -0.0022 0.067182 0.0358 309 TR 0.26 Agreeableness NEO-FFI 0.004293 0.148 0.08663 45 UN 0.23 Likelihood of Accident DRP 0.010364 0.129779 0.083031 356 BE 0.20
Time Horizon Time Horizon 0.000338 0.117097 0.079247 264 CO 0.18
Other DBQ -0.012 0.134773 0.096752 234 PO 0.16
Steering OTS -0.00479 0.08665 0.066585 165 AC 0.14
concienciouness NEO-FFI -0.00296 0.079771 0.063144 47 UN 0.14
Plan DSQ 0.005605 0.053402 0.04537 47 UN 0.12
Front View OTS 0.001568 0.110237 0.102025 31 UN 0.10
Gear OTS 0.003083 0.055944 0.051804 252 SE 0.10
Likelihood of
Citation DRP 0.00616 0.057348 0.056105 8 BE 0.09
Clam DSQ 0.024475 0.094403 0.106044 83 UN 0.07
Paddle OTS 0.015395 0.054428 0.063785 123 ST 0.07
Rear View OTS 0.007393 0.002856 0.052248 285 CO 0.00
In table 10, Scale/ Measure represent the Y-axis components that we correlate against Schwartz Values. B0 is the vertical offset of the model from the zero correlation baselines. If the data are well-behaved, its value is close to zero. B1 is the amplitude of the sine wave defined as the peak value of correlation in the best-fit model to the observed data. The statistical significance of this parameter determines the utility of the model as a predictor and descriptor of the data. Phase angle of the best-fit model defined as the distance in degrees from the left side of the correlogram to the zero intercept of the rising limb of the sine wave. The phase angle determines the location of the peak and is central to the interpretation of the patterns of correlation captured by the model. Peak Value Type represents the highest point of the Schwartz‟s value on the graph for the Y-axis measures in the correlation. The R^2 value indicates that the model explains more than three-quarters of the variance (noise) in the observed data. (Smith, Lindgren, Granlund 2005-2006).
Here in this report we will only discuss those values of r^2 which are closer to 1, because when r^2 value is close to 1 we get a nearly a perfect sine wave, giving a result which fits the Schwartz‟s and other models.
5.1.1. Correlations between Schwartz’s value and Conflict Avoidance
Here in this graph Schwartz‟s value is correlated with Conflict Avoidance. In the graph given below the peak value is Conformity=1 (CO) against the measure Conflict Avoidance. So Schwartz‟s value has a strong positive correlation with Conformity (CO) for the users which like to avoid conflicts in their life.
Figure 13: Correlation between Schwartz’s Value Survey and Conflict Avoidance Value -1.0 -0.5 0.0 0.5 1.0 CO TR BE UN SD ST HE AC PO SE Conflict Avoidance Observed Model
Analysis and Discussion
This represents that people who are more conventional or follow their traditions are those people who like to avoid conflict in the way of life, they like to make such decisions or they spend their life in such a way that they prevent arguments or clashes. And also it has a negative correlation with Stimulation= -1 (ST), which suggests that people who don‟t like to face challenges are those people who like to avoid clashes or conflicts in their lives. This particular correlation gives a perfect picture of the behavior of the people who like to stay away from troubles or conflicts are usually good followers of tradition and they usually they don‟t like to face challenges in every day of their life. 5.1.2. Correlations between Schwartz’s value and Impatient Value
In the figure 12, the impatient value from the driver‟s behavior questionnaire has a positive correlation with Achievement= 0.990 (AC) and a negative correlation with Benevolence= -0.990 (BE).
Figure 14: Correlation between Schwartz’s Value Survey and Impatient Value
This positive correlation with achievement of impatient people shows that impatient people have more desire for accomplishment in life. People with these personality traits want to achievement things in fast or impatient way.
-1.0 -0.5 0.0 0.5 1.0 CO TR BE UN SD ST HE AC PO SE Impatient Observed Model
5.1.3. Correlations between Schwartz’s value and Hostile Value
In the figure 13 below we have Hostile value from driver‟s behavior questionnaire has a positive correlation with Power= 0.997 (PO) and a negative correlation with Universalism= -0.997 (UN).
Figure 15: Correlation between Schwartz’s Value Survey and Hostile Value
In daily life people who have desire for getting power are aggressive. To acquire the power people sometime leave all the understanding and care for others. Also this trait of hostility in human is opposite to the people which have an understanding and tolerance for other people. They only think about their own welfare and well-being. These results show obvious view of people which have desire for taking power and don‟t bother about other people. -1.0 -0.5 0.0 0.5 1.0 CO TR BE UN SD ST HE AC PO SE Hostile Observed Model
Analysis and Discussion
5.1.4. Correlations between Schwartz’s value and Open to suggestions
Here Benevolence= 0.952 (BE) has a strong positive correlation with Open which is a driver‟s style questionnaire value, stating that people who are more open to suggestions during driving are more benevolence. People, who value suggestions or comments while driving, are more into kindness or munificence.
Figure 16: Correlation between Schwartz’s Value Survey and Open to suggestion
So this driving habit or style gives an important insight of the driver‟s personality. Whereas it has negative correlation with Achievement= -0.952 (AC). This correlation suggests that, drivers who listen to other people advice or comments don‟t much believe in obtaining the social approval or getting the social esteem in their life.
-1.0 -0.5 0.0 0.5 1.0 CO TR BE UN SD ST HE AC PO SE
Open to suggestions while driving
Observe d
5.1.5. Correlations between Schwartz’s value and Cautious Value
We have Cautious value from driver‟s style questionnaire has a positive correlation with Conformity= 0.995 (CO) and a negative correlation with Stimulation= -0.995 (ST).
Figure 17: Correlation between Schwartz’s Value Survey and Cautious Value
This result depicts very clearly aspects of life. We can see from an example like youngster try to follow their instinct when doing illegal car racing on public roads they don‟t bother about the norms, social values and traffic rules. This shows a negative correlation with cautiousness. If a person is cautious enough in daily matters of life, it is expected that he/she should follow the norms and traditions of society and restraint from doing things which can be annoying to other people.
-1.0 -0.5 0.0 0.5 1.0 CO TR BE UN SD ST HE AC PO SE cautious Observe d
Analysis and Discussion
5.1.6. Correlations between Schwartz’s value and tolerance of Uncertainty
The graph shows the strong positive correlation between the Self direction= 0.996 (SD) and Tolerance for Uncertainty reflecting that, people who have more tolerance for uncertainty are more independent or they have high beliefs of self governing. People with self-determining attitude can do much better in decision making situation with incomplete information or in an unfamiliar situation. Inspection of Figure also reveals that it has a negative correlation with Power= -0.751 (PO) which means that people who don‟t want them self to be in unclear or ambiguous situations have less desire for social status and prestige.
Figure 18: Correlation between Schwartz’s Value Survey and Tolerance for Uncertainty -1.0 -0.5 0.0 0.5 1.0 CO TR BE UN SD ST HE AC PO SE
Tolerance for Uncertainty
Observed Model
5.1.7. Correlations between Schwartz’s value and Frequency of behavior
We have Frequency of behavior value from driving risk perception questionnaire which has a positive correlation with Power= 0.999 (PO) Schwartz‟s value and a negative correlation with Universalism= -0.999 (UN) Schwartz‟s value.
Figure 19: Correlation between Schwartz’s Value Survey and frequency of behavior
This result shows that a person who has a tendency of gaining power in life will indulge into different things quite often. They have a high frequency of changing behavior. We can take an example a person who wishes to have power in life may over speed on road to be in the first position on every traffic signal. And the frequency of this behavior will be big. And a negative correlation with universalism shows no care for other people. We can say a person with these traits only focus on his own intentions.
-1.0 -0.5 0.0 0.5 1.0 CO TR BE UN SD ST HE AC PO SE Frequency of behavior Observe d
Analysis and Discussion
5.1.8. Correlations between Schwartz’s value and Obedient
Obedient value is taken from driver‟s style questionnaire, with Schwartz‟s value types it has a positive correlation with Universalism= 0.944 (UN) and a negative correlation with Power= -0.994 (PO).
Figure 20: Correlation between Schwartz’s Value Survey and Obedient value
Results show a fact that people who are obedient in parts of life are not keen of taking power. People tends to be obedient to the rules then to gain control over them. So for people who are obedient in life will drive safely as they will follow the rules and less accidents will occur.
5.2. Post Encroachment Time (PET) Analysis
This section presents the simulator data containing PET, Speed and Acceleration. There were a total of 244 PET meetings at an intersection in total within all the four sessions (mention fig). The data for PET values above 10 seconds is not being included in this analysis because they considered as a safe distance between the two cars. Here we will only discuss the results in a brief detail because our other group was working on this research study.
-1.0 -0.5 0.0 0.5 1.0 CO TR BE UN SD ST HE AC PO SE obedient Observe d
Figure 21: Total Number of PET Meetings in all four sessions 5.2.1. Results
1. There is no indication in obtained data that the experimental manipulations influenced in the drivers PET.
2. There are considerably more PET values than expected in Scenario B at 5 and 6 seconds, in Scenario C at 1 second, and in Scenario D at 3 seconds. In fact, in Scenario A and B, PET values were larger (times were longer, cars were further apart) than in Scenario C and D.
3. There is no indication in obtained data that the experimental manipulations influenced the drivers‟ speed.
4. There is no indication in obtained data that the experimental manipulations influenced the drivers‟ acceleration.
6. Conclusion
The main issue of this study has been to examine driving behavior in intersections. The results discussed in this report are derived from observations and experiments performed in the lab. Different people from different countries participated in our study and we do not claim that these results generalize to every individual from these countries. No claim is made that our participants are representative of the full diversity of their cultures. Indeed, our participants are largely drawn from a self-selected pool of
0 20 40 60 80 100 120 GPS + TL TL GPS Baseline Experimental Condition N