The Impact of FIFA
World Cup on Sponsoring
Companies and the Host
Country Stock Market
Index
MASTER THESIS WITHIN: Business Administration NUMBER OF CREDITS: 15
PROGRAMME OF STUDY: International Financial Analysis AUTHOR: Anas Alsaadi & Sayan Banerjee
Master Thesis in Business Administration
Title:
The Impact of FIFA World Cup on Sponsoring Companies and the Host Country Stock Market IndexAuthors:
Anas Alsaadi & Sayan BanerjeeTutor:
Michael OlssonDate:
2020-05-18Abstract
We investigate if the FIFA affects the sponsoring companies’ stock returns more than that of the host countries’ securities indices, we have presented the findings of earlier research entities and provided some insight into the influence of FIFA and other sports on global stock index. We have also made a detailed consideration of stock market reaction for the sponsoring companies’ securities and host countries’ security indices and found some articles about country wise investor sentiment based on match outcomes because they are the one to invest in the sponsoring companies or the host country security markets. Throughout our work we have tried to verify our hypothesis and support it with year-wise and host country-wise data through regression models and an event study. In the end, we have tried to come up with coherent findings based on the proven hypothesis and discuss their interpretations along with some possible predictions for the upcoming FIFA world cup in 2022.
Contents
1
Introduction ... 1
2
Theory... 2
2.1 Findings of Goldman Sachs ... 2
2.2 An Insight to Investor Behaviour and Their Consequent Investment Decisions That Affect the Stock Market ... 5
2.3 Reason behind the impact of FIFA On Global Stock Indices and Comparison of Such Impact with That of Other Sports ... 6
2.4 Detailed consideration of the stock market reaction at various levels and their variations. ... 8
2.5 Based on the previous literature review we have framed the following two hypotheses: ... 15
3
Data ... 15
3.1 Countries research and their major indices and currencies ... 15
3.2 Sponsors ... 16
3.3 Benchmark ... 16
3.4 Data description ... 17
3.4.1 South Africa 2010 FIFA ... 17
3.4.2 Brazil 2014 FIFA ... 18
3.4.3 Russia 2018 FIFA ... 19
4
Method: ... 19
4.1 Conducting the Event Study... 20
4.2 Estimation and Event Window ... 23
5
Results ... 24
5.1 South Africa 2010 FIFA ... 24
5.2 Brazil 2014 FIFA ... 27
5.3 Russia 2018 FIFA ... 28
6
Discussion ... 29
6.1 Next event 2022 ... 30
6.2 Ethics and sustainability ... 31
6.3 Suggestions for future studies ... 32
References ... 34
Figures
Figure 1: Estimation and Event Window ... 24
Tables
Table 1: A tabulation of post-1 year and pre-1 year returns for the winners, The runner ups and host countries for the year 1974 to 2010. ... 4Table 2: Countries research and their major indices and currencies. ... 15
Table 3: Sponsors indices and currencies. ... 16
Table 4: Details of returns South Africa 2010 during FIFA. ... 17
Table 5: Correlation Matrix. ... 18
Table 6: Details of returns Brazil 2014 during FIFA. ... 18
Table 7: Correlation Matrix. ... 18
Table 8: Details of returns Russia 2018 during FIFA... 19
Table 9: Correlation Matrix. ... 19
Table 10: South Africa 2010 FIFA NR&AR calculation. ... 25
Table 11: South Africa 2010 FIFA T statistic. ... 26
Table 12: Brazil 2014 FIFA T statistic. ... 27
Table 13: Russia 2018 FIFA T statistic. ... 29
Appendix
Figures Figure A1: Excess Returns Jan-May South Africa 2010. ... 36Figure A2: Excess Returns during FIFA South Africa 2010. ... 36
Figure A3: Excess Returns Jan-May Brazil 2014. ... 37
Figure A4: Excess Returns during FIFA Brazil 2014. ... 38
Figure A5: Excess Returns Jan-May Russia 2018. ... 39
Figure A6: Excess Returns during FIFA Russia 2018. ... 39
Tables Table A1: T test South Africa 2010. ... 37
Table A2: T test Brazil 2014. ... 38
1 Introduction
The FIFA World Cup, probably the biggest international football event to be ever hosted and watched all over the world. Countries from far end corners of the world come together and lighten up the sportsmanship vibe as they participate as hosts, teams and audience. First hosted in the year 1932 and from then onwards this major sporting event has continued to fascinate millions of avid football fans. As a small example of how great the event is about 3.572 billion people (more than half of the world population) watched the event while it was being telecasted. Such an information casts light on how influential this event is. However, the influence of it has not been confined to the stadium and players only. Letting alone the sportsman spirit of the event, it has even gone to the extent of affecting the primary capital, secondary stock markets and investor predilections.
No wonder such an event would cost a fortune to host and invest in. The requisite capital for such a massive investment comes from the public offerings made by private and government sponsoring companies. To what extent would they be able to accumulate enough capital depends on the willingness preferences and speculations made by the investors. An example of this phenomena is evident if one takes a glance at the volumes of security transaction data during those times compared to other years. The onset of this major event also casts light on investors’ tendency to speculate on prospective investment projects. This behaviour can be exemplified when they are the stakeholders of the sponsoring companies and indigenous ones that deal in commodities like sports gear, FIFA merchandise and fast food. The so-called prophecies made by and convictions of these stakeholders about their companies’ performance goad them into gambling on their beliefs in the hope of attaining above-average returns and hefty capital gains during the world-cup hype.
We will focus on the following questions
•
Does the FIFA event help the sponsoring companies' stock returns to improve? • Does the FIFA event help the host countries security market return to improve?• Which one of the sponsoring companies' stock returns or host countries security market return gets improved the most by FIFA world cup which would help us know where to invest our money in. In other words, would it be better to invest our money in the equally weighted portfolio of sponsoring companies or in the host country security market indices.
By finding out the answers to these questions with the help of theory, methodology and hypothesis testing, we would eventually try to prove if that the FIFA world cup, although a major sporting event made for the purpose of entertainment and not a phenomenon that matters to the sponsoring companies’ stock prices and the host countries’ securities market indices for improvement. Later in the study, we would prove this assertion with the relevant hypothesis, equations and findings. The assertion has been proven with the help of tests of significance of the standard deviation of average abnormal returns through t-Statistic.
2 Theory
Here, we will present the earlier researches regarding the hypothesis about whether FIFA world cup influences the stock market price variations and investor activities. Based on their perspectives we would summarize and articulate their point of view.
2.1 Findings of Goldman Sachs
Goldman Sachs (2014) is of the opinion that FIFA world cup does affect the stock market, even though for a short period of time. They have found a clear pattern which shows the winning country outperforms the stock market in the upcoming weeks following the FIFA world cup final. They found the magnitude of outperformance to be 3.5 percent. Compared to the stock markets of other countries. On the downside, this outperformance lasted only for about three months, such hype maybe due to investor sentiment for the time being. The reason behind it may be due to the inability of the winner country to hold on to its gain much longer as soon as its investors get over the hype of positivity. Maybe, that is why most of the winning countries see their stock markets underperform by as much as 4 percent on average, in the following year after the world cup final. Goldman Sachs (2014) has analysed the stock market data of winner countries right from 1974 and found that all the winner countries other than Brazil (Winner of 2002) have attained outperformance in the month right after FIFA world cup final. However, the cause for Brazil’s underperformance was a little different since the country was already beset with acute recession and currency crisis. Such an undesirable situation, kind of overshadowed their victory. To cite some data about the extent of their underperformance, their equity market went down by 19 percent compared to the world index and by 13 percent over their own performance compared to the previous months. But this setback could not hold Brazil back from displaying the post-world cup feel good factor and
support the fact that FIFA does in fact influence the stock market. The country outperformed the MSCI world index in just one month after its win 1994, a time when bull market thrived. Brazil itself accounted for 21 percent outperformance in overall 38 percent outperformance by all the stock markets in the world. In the absence of economic crisis, the winner tends to make the most out of the hype of their success, even though for a brief period.
Focusing on the case of runner ups, their fans would be disappointed at losing in the final match. Similar is the case of their stock market that probably does not react well either. This again supports the fact that stock markets can be influenced by the FIFA outcomes. Compared to the winners, the runner ups experience post-final bout of the blues. This fact was verified by Goldman Sachs data which says that the runner-up stock market’s relative performance rises by two percent on average in the first month after the finals. It is an improvement but however compared to that of the winner’s market, the market reaction is not that significant. However, to contradict such findings, it would be appropriate to say this average runner-up performance is heavily inclined to Argentina, that enjoyed a 33 percent outperformance in that month. Speaking from the perspective of security markets of host nations, the pride and confidence associated with them has led to a positive impact on those markets even though such impacts last for a couple of weeks. For example, the FIFA world cup 2018 was hosted by Russia. Within one month of hosting the event, the returns of Russian security market stocks went up by 2.7 percent on average but faded quickly after the world cup was over. This backs another corollary information that while FIFA influences stock market performance, such performance is not consistent as the above-average performance gradually dies out.
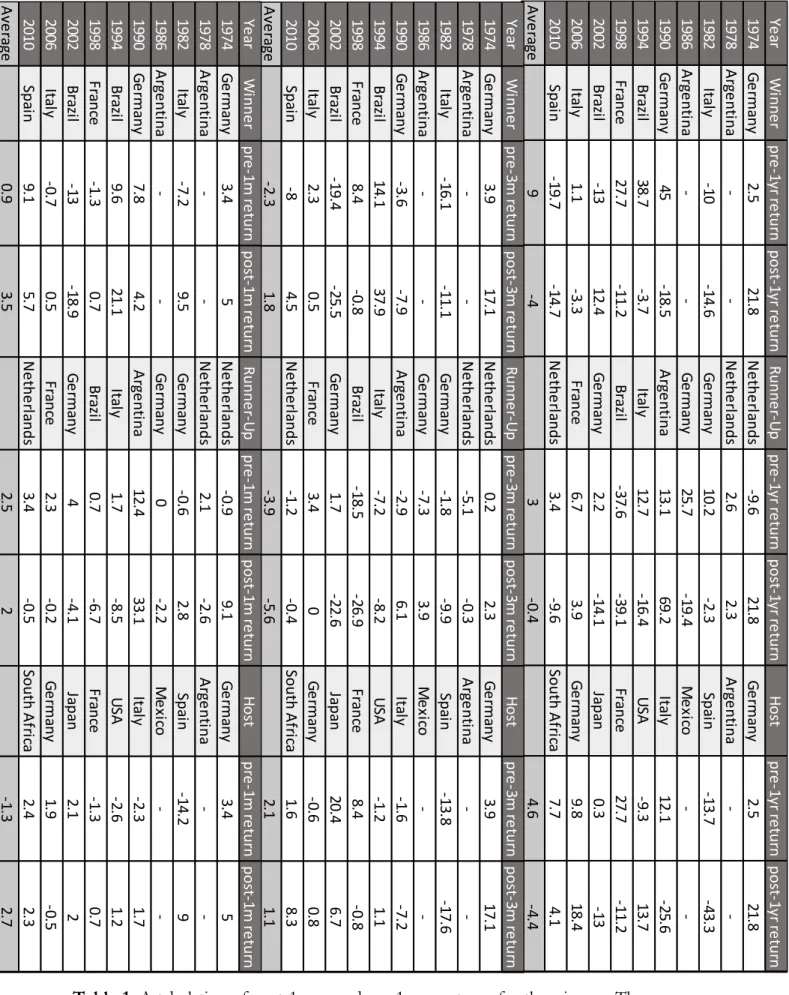
A glance at table 1 that contains recent stock market performance of the countries believed to be win the world cup in each of the years right from 1974 to 2010 would reveal the changes in stock market returns before and after the event, for example, pre-FIFA-3 months and post FIFA-3 months return. Looking at the Table 1, one would find that Brazil had reaped the benefits of one of the best stock market performances in the 3 months before and after the event in 1994 where the returns shot up from 14.1 percent to 37.9 percent. The biggest improvement made can be seen in the case of Spain in in 1982 in terms of pre-1 month and post 1-month return where the returns improved from –14.20 percent to 9 percent (Over 23 percent rise) while German stocks have underperformed relative to the world index.
Ye ar W in n e r p re -1 yr re tu rn p o st -1 yr re tu rn R u n n e r-U p p re -1 yr re tu rn p o st -1 yr re tu rn H o st p re -1 yr re tu rn p o st -1 yr re tu rn 1974 G e rma n y 2.5 21 .8 N e th e rla n d s -9 .6 21 .8 G e rma n y 2.5 21 .8 1978 A rg e n tin a -N e th e rla n d s 2.6 2.3 A rg e n tin a -1982 Ita ly -1 0 -1 4.6 G e rma n y 10 .2 -2 .3 Sp ain -1 3.7 -4 3.3 1986 A rg e n tin a -G e rma n y 25 .7 -1 9.4 M e xic o -1990 G e rma n y 45 -1 8.5 A rg e n tin a 13 .1 69 .2 Ita ly 12 .1 -2 5.6 1994 B ra zil 38 .7 -3 .7 Ita ly 12 .7 -1 6.4 U SA -9 .3 13 .7 1998 Fr an ce 27 .7 -1 1.2 B ra zil -3 7.6 -3 9.1 Fr an ce 27 .7 -1 1.2 2002 B ra zil -1 3 12 .4 G e rma n y 2.2 -1 4.1 Ja p an 0.3 -1 3 2006 Ita ly 1.1 -3 .3 Fr an ce 6.7 3.9 G e rma n y 9.8 18 .4 2010 Sp ain -1 9.7 -1 4.7 N e th e rla n d s 3.4 -9 .6 So u th A fri ca 7.7 4.1 A ve ra ge 9 -4 3 -0 .4 4.6 -4 .4 Ye ar W in n e r p re -3 m re tu rn p o st -3 m re tu rn R u n n e r-U p p re -3 m re tu rn p o st -3 m re tu rn H o st p re -3 m re tu rn p o st -3 m re tu rn 1974 G e rma n y 3.9 17 .1 N e th e rla n d s 0.2 2.3 G e rma n y 3.9 17 .1 1978 A rg e n tin a -N e th e rla n d s -5 .1 -0 .3 A rg e n tin a -1982 Ita ly -1 6.1 -1 1.1 G e rma n y -1 .8 -9 .9 Sp ain -1 3.8 -1 7.6 1986 A rg e n tin a -G e rma n y -7 .3 3.9 M e xic o -1990 G e rma n y -3 .6 -7 .9 A rg e n tin a -2 .9 6.1 Ita ly -1 .6 -7 .2 1994 B ra zil 14 .1 37 .9 Ita ly -7 .2 -8 .2 U SA -1 .2 1.1 1998 Fr an ce 8.4 -0 .8 B ra zil -1 8.5 -2 6.9 Fr an ce 8.4 -0 .8 2002 B ra zil -1 9.4 -2 5.5 G e rma n y 1.7 -2 2.6 Ja p an 20 .4 6.7 2006 Ita ly 2.3 0.5 Fr an ce 3.4 0 G e rma n y -0 .6 0.8 2010 Sp ain -8 4.5 N e th e rla n d s -1 .2 -0 .4 So u th A fri ca 1.6 8.3 A ve ra ge -2 .3 1.8 -3 .9 -5 .6 2.1 1.1 Ye ar W in n e r p re -1 m re tu rn p o st -1 m re tu rn R u n n e r-U p p re -1 m re tu rn p o st -1 m re tu rn H o st p re -1 m re tu rn p o st -1 m re tu rn 1974 G e rma n y 3.4 5 N e th e rla n d s -0 .9 9.1 G e rma n y 3.4 5 1978 A rg e n tin a -N e th e rla n d s 2.1 -2 .6 A rg e n tin a -1982 Ita ly -7 .2 9.5 G e rma n y -0 .6 2.8 Sp ain -1 4.2 9 1986 A rg e n tin a -G e rma n y 0 -2 .2 M e xic o -1990 G e rma n y 7.8 4.2 A rg e n tin a 12 .4 33 .1 Ita ly -2 .3 1.7 1994 B ra zil 9.6 21 .1 Ita ly 1.7 -8 .5 U SA -2 .6 1.2 1998 Fr an ce -1 .3 0.7 B ra zil 0.7 -6 .7 Fr an ce -1 .3 0.7 2002 B ra zil -1 3 -1 8.9 G e rma n y 4 -4 .1 Ja p an 2.1 2 2006 Ita ly -0 .7 0.5 Fr an ce 2.3 -0 .2 G e rma n y 1.9 -0 .5 2010 Sp ain 9.1 5.7 N e th e rla n d s 3.4 -0 .5 So u th A fri ca 2.4 2.3 A ve ra ge 0.9 3.5 2.5 2 -1 .3 2.7
Table 1: A tabulation of post-1 year and pre-1 year returns for the winners, The runner ups
2.2 An Insight to Investor Behaviour and Their Consequent Investment Decisions That Affect the Stock Market
From the perspective of investor behaviour and favourite national sports teams wins and losses, past studies show that FIFA world cup results significantly impact the investor mood. Investors feel positive when their country wins and depressed when their country loses. Hirt et al. (1992) Edmans et al. (2007) showed that a strong correlation exists between the results of FIFA games and excess stock returns. They have identified an asymmetric effect that leads to losses to have a far-reaching depressing effect on the losing countries’ local stock markets. They wanted to test this hypothesis i.e. if the losses depress the stock market returns. After carrying out the survey to back their hypothesis they found that it is actually the capital gains and overall range of returns that suffer the most due to the losses which ultimately affects the volume of securities traded and act as indicators of the investors’ sentiment. They labelled capital gains and returns to be investment utility components that are ultimately dependent on investor confidence on their national stock markets. So, the reference point here would be the investors’ pre-match expectations of how their national team would perform. Here it would be appropriate to say that investors not only invest their own money in security markets but also psychologically invest themselves in their desired outcomes and end up making biased positive predictions. Ultimately, when things don’t go in their favour, they tend to lose all hope and start to divest from most of their investments which lead to influential stock price depressions.
An example of this case would be Nike’s stock market situation during the 17th FIFA world
cup. Nike was the sport sponsor company of Brazil that won its first match, and Nike’s excess stock return on the opening price on the first trading day shot up by 1.3 percent but went down by 5 percent the country lost its second match. This shows that sports sentiment of investors is very quick to materialize. In the event of getting depressed about the outcome, the investors get extra cautious while regulating their investment in fear of losing money in the stock market.
2.3 Reason behind the impact of FIFA On Global Stock Indices and Comparison of Such Impact with That of Other Sports
Previous research shows that losses in the World Cup have decreased the stock market returns and volume of transactions drastically while wins did the opposite. So here it is appropriate to analyse the reasons for stock market changes. In order to look at such reasons, we might have to extend our view to include other athletic sports as well and find out whether they act as possible indicators for stock market changes. The efficient market hypothesis states that stocks always incorporate new information and its participants act in a rational manner. So, this implies that it is impossible for the stocks to be overvalued or undervalued. But over the years, certain findings have shown that certain major events and feelings are well capable influencing financial decisions at micro as well as macro levels. This has led to a new application of behavioural economics in the area sports and athletic events. A study by Edmans, Garcia and Norli (2007) looked into the effect of investor sentiment of security prices due to outcome of sporting events. Among the types of sporting events analysed international soccer matches had a strong correlation with security prices which would decrease after a loss in the game. They found that the primary reason behind the stock price influence was the effect of something called ‘Mood Variable’. The statistical research spanned across 39 countries and included next-day stock market results of wins, losses and ties after which the expectations were compared with those results (Expectations are the outcomes anticipated by the fans and investors about the sporting event). They concluded that a result that surprises impacts their investment decisions leading to purchasing and selling stocks that would make stock prices fluctuate. At the national level Ashton, Gerrard and Hudson (2003) examined the relationship between England’s national soccer team matches and the FTSE 100, a share index of the 100 largest companies, by market capitalization, listed on the London Stock Exchange.
To consider each of situations their analysis included ‘Friendly’ matches when the team was not participating, ‘qualifying’ matches when the team was attempting to qualify for a tournament, and finals matches when the team was participating in a tournament. They studied the outcome of the ‘Finals’ matches and found a stronger correlation with stock market fluctuations than either of the ‘Friendly’ or ‘Qualifying’ matches. This shows that not all ‘Wins’ and ‘Losses’ are equal in effect. A defeat in an important match seemed to have a greater psychological effect than a relatively unimportant match. They studied England to find out about this. To do away with this biasness, Kaplanski and Levy (2008) widened the research ambit by looking at FIFA world cup matches from 1950 to 2010. The developed research
focused on America’s S&P500 index. This captured loss suffered by multiple countries because of the high amount capital invested by foreign countries in US. The effect of 32 countries and 64 matches appears to be statistically significant and large. This helped the researchers to concentrate on investors’ irrationalities while they predicted their desired outcomes. This is basically called ‘Expectation Theory’ that drives the entire stock market show. As a possible underlying reason behind the stock market dropping, it is important to examine expectation theory. Mitra, Schaubroeck, Shaw and Duffy (2008) researched the effect of failing to meet and exceeding pay raise expectations on an employee’s happiness. This research was restricted to a university hospital but may be representative of a person’s general psychology. The researchers found that failing to meet expectations had an effect larger in magnitude than either meeting expectations or exceeding expectations on worker happiness. The change in turnover intentions was larger in magnitude for failing to meet expectations than meeting or exceeding expectations. They also discovered that higher expectations correlated with a larger increase in turnover intentions. These findings are important in our context because it may help explain why losses impact the stock market more than wins or draws. Another important factor to consider is the idea that people are generally overly optimistic. Schreier, Carver and Bridges (1994) found that people are generally over optimistic and that it is a pervasive human trait. While they note that not everyone is generally optimistic.
Optimism remains prevalent in a significant percentage of people. Armor and Taylor (2002) found that people are more likely to maintain optimism despite evidence to the contrary. This is important because teams that are not favoured to win still may have fans that expect them to win the match. Thus, losing the match is more likely to fail to meet expectations, while winning a game is more likely to only meet expectations. Fans are not likely to adjust expectations because of biases towards their team and tendency to ignore evidence against the bias. These findings are important in the context of this paper because it may help explain why losses impact the stock market. When such overly optimistic expectations are proven wrong by the results, people might start to sell stocks and divest investments, which might well be perceived by the investors to be negative for the economy, while being proven right has the opposite impact and lead to investing in additional stocks.
2.4 Detailed consideration of the stock market reaction at various levels and their variations.
One added feature of this thesis namely, the thesis published by Wijden, J. V. (2019) that presented studies concerning football matches and stock returns is that, along with studying the effects of match results of national football teams on stock indices during the FIFA World Cup. It also considers the effects of match results of listed football clubs on their stock price, the effects of match results on the stock price of intimately involved companies. In the end the article presents the differences in receptivity to sports sentiments and the consequent investment decisions in the Latin American and European stock market. Dohmen, Falk, Huffman and Sunde (2006) asked a representative sample of the German population about their personal economic situation, the current economic situation in their country and their expectation regarding changes in both the situations a year later. They found out that after an unexpectedly good performance of the German football team, the respondent developed a more positive outlook relating to their economic perceptions and expectations. The results were found to be convincing enough for the entire German population and the economy. The article seemed to be very interested in whether such optimistic traits has an impact on the trading behaviour of investors in domestic stock markets. The article segregated the influence of match results into three different levels. The first level is the impact of the FIFA match results on the domestic stock index which mainly include national teams, at the second level the influence of FIFA match results on stock prices of football clubs that are listed on the stock exchange (Juventus of Italy, Arsenal of England etc,) and lastly, at the third level, the influence of FIFA match results on the stock price of the sponsoring companies associated with those football clubs.
Ashton Gerrard and Hudson (2003) were the first to study this effect. They studied the effect of the performance of England’s national football team from January 6, 1984, to July 3, 2002, on the British FTSE 100 index by conducting binomial tests and found a statistically significant relationship. This study was further augmented by Bernhard Zwergel and Christian Klein (2009). They redid the binomial tests to find whether the return of the trading day following a FIFA match of England’s national football team differed from the unconditional mean returns of normal trading days. The two studies came up with different findings despite using the same data. The two different conclusions may be due to the difference in perspectives of the two studies.
To enumerate on it, first, Ashton did not consider the holiday effect. By holiday effect the article means a day when no trading takes place. Zwergel and Klein (2009) corrected this loophole by omitting all returns that fell on holidays.
Second, the studies differ between how they deal with draws in knock out matches. This difference is due to the existence of penalty matches after a draw in a knockout match. The result of a loss after penalties would be same as the result caused by a loss within the 90 minutes of a match as the team gets out of the tournament.
Third, the study by Ashton did not consider time during which a match is played that would inevitably have an impact on the magnitude of the return. Since most matches are played during the evening, the extent of abnormal returns becomes visible on the first trading day after the match. Although it is something very obvious, but the DataStream makes an error while showing the returns and stock prices if the match is played in another time zone. To clarify it further, during the World Cup 2002 that was played in South Korea and Japan. England played against Argentina on 7th of June. It was Friday and the match started at 8:30 pm (Local time) and at 12:30 pm in England. The match ended at around 22:30 pm (Local time) which was 14:30 pm in England. What Ashton did was that he took the closing price on the first trading day after the match to calculate the abnormal returns i.e. 10th June, Monday but the investors have already reacted on Friday 7th of June since the FTSE index was still open on that afternoon. Zwergel and Klein (2009) took this timing factor into account and recorded the closing on the match day to calculate abnormal return.
The conclusions were therefore very different in themselves. While Ashton found a statistically significant relationship between stock market return on FTSE 100 and the performance of England’s national team. Zwergel and Klein (2009) could not find any such relationship between them. This shows that there are many ways arising from different perspectives to study the topic that can lead to different conclusions. What is important is how vast is the area of study and how practical has the researcher been while conducting the research.
Being aware of the findings put forward by Zwergel and Klein. Ashton et al. (2011) still assert the significance of the relationship between national football matches and FTSE 100. The primary reason for their assertion was that the link between international football results and stock market returns is subject to various statistical approaches (Parametric approaches in particular) that have been ignored by Zwergel and Klein.
Edmans, Garcia and Norli (2007) surveyed the international football matches on the World Cup from 1973 to 2004. Their survey also included relevant qualification matches in their study to get a total sample of 1162 football matches played by 39 countries. Edmans, Garcia and Norli (2007) analysed the effect of international football matches on stock prices by looking at the return variation on a broad stock market index on the first trading day after the match. This method is same as that of Ashton et al. (2011) and Edmans et al (2007) knew the after effect that a part of the reaction in stock prices may have already taken place in stock prices before the measurement day. Edmans did this to get the return for an entire day when the match outcome is known. They found a robust negative stock market reaction to losses by national football teams. The size of the loss effect was found to be economically significant in terms of monthly returns, but no evidence was found of corresponding reaction after wins in football matches. The researchers relate this effect to change in investor mood after the matches. This effect is more evident in countries where football is a popular sport. The effect gets even more augmented along with the importance of the match being played. Such effect has a large impact on small stocks that are held by local investors whose mood is more affected by the performance of the national football team.
Graziano, Vicentini (2016) and Demirhan (2013) studied the effect of one single national football team on the domestic stock index. Graziano and Vicentini analysed the effect of Italian national football team results on the FIFA world cup from 2002 to 2014 on the index names FTSE MIB. Demirhan investigated into how the sporting success of Turkish national football team between January 1988 to May 2011 affected the Borsa Istanbul stock index returns. Graziano and Vicentini figured out a positive and statistically significant relationship at one percent confidence level with football match results of Italian national football team in FIFA world cup. Demirhan found no abnormal return on the Turkish stock market index after a win of the Turkish national football team but an appreciable negative effect in the event of a loss. Talking about the above-mentioned survey from a different perspective Gerlach (2011) found the pattern of returns documented in the papers by Ashton et al (2011) and Edmans et al (2007) also existed in countries whose national teams did not take part in tournament during the period of survey. This, however, casts doubt about whether the abnormal returns are because of the match results or for some another reason. To clarify the same, in the quarter final between Brazil and England on June 21, 2002, Brazil won the match by 2-1. On the following trading
day i.e., June 24th Monday, the Brazilian index rose by 1.27 percent while England’s fell by 1.33 percent and the World Market Index fell by 0.31 percent. With the help of the Global Index as the benchmark, this would provide support to the hypothesis that world cup matches affect returns through investor sentiment because Brazil had a higher return than the market index and England had a lower return. But, on June 24, 2002, the return on Argentine index (When Argentina played against Brazil) was 2.04 percent while the return on French index (When France played against England) was 3.45 percent. Both Argentina and France did not advance to the elimination round in world cup 2002, so their national team performances did not affect the returns on that day.
As concluded by Ashton, it is extremely tough to be totally certain that the event study is correct in every detail and it is rather sensible to contemplate on how academic studies can be accurately replicated. The different methods used and the difficulty of studies account for different conclusions. While some studies find a statistically significant relationship in the stock market after the wins and losses of the national football team the other studies found no such statistically significant relationship at all.
About some of the football clubs, that are listed on stock exchange Tottenham Hotspurs of England was the first football club that got listed on stock exchange in 1983 after which, the other football clubs followed. This time, the study was made a little more specialized by analysing the effect of match results on the value of the football clubs. To cite an example, in June 2018 Juventus was defeated by Ajax for 2 goals to 1 and Ajax got qualified for the semi-finals for the first time. This led Ajax’s share price to increase from 17.15 euros to 18.75 euros (about a 9.33 percent increase) on the day following the match while this outcome led Juventus’s share price to decrease by 24 percent on Milano Stock Index. From the example it can be concluded that investors are very like-minded about the effects of match results on the share value of football clubs. Dobson and Goddard (2001) showed that good match results may amount to financial rewards because success attracts media attention and avenues for sponsoring. Other financial results involve premiums associated exclusively with European competitions for example Europa league. Champions League etc. However, Zuber, Yiu, Lamb, and Gandar (2005) found that investors do not trade on information which can lead to change in cash flows, but they rather want to obtain value from their ownership stake in the clubs.
The next category of stocks that can be affected by football match outcomes are those of involved companies. Hanke and Kirchler (2013) studies the effects on the stocks of jersey suppliers like Adidas, Nike and Puma after a match of a national football teams that wear jerseys of those brands. They used data from World Cup and European championships between 1996 and 2008. They found abnormal returns at major football tournaments. Some of their findings were that matches where both the teams wore the jersey of the same supplier led to positive excess returns and effects on the share price were greater in case of knock out matches than for group matches. The loss effect in total and in knock out matches was found to be more significant when pre-match defeat probability was accounted for.
Ramezani and Mardani (2012) studied the impact and took the data of Iranian football teams that have sponsoring companies that were listed on the Tehran Stock Exchange between 2009 and 2012. Their results showed that there is 86 percent probability of a significant correlation of between the results of matches and the stock price of sponsoring companies but such effects of match results on their stock prices were not the same when it comes to intensity. Here, it would be good to find out the answer to the question if sponsoring football companies would affect company performance. Naidenova, Parshakov and Chmykhov (2016) led concluded that there is no such nexus i.e. no difference has been found in performance between sponsoring and non-sponsoring companies but the effect of sponsorship can differ among football leagues. Moreover, the success probability of a national football team does not influence the effectiveness of sponsorship contract.
Speaking about the popularity of FIFA and comparing its influence with that of other sports. Boyle and Walter (2001) studied the effects of match outcomes of New Zealand’s national rugby team on the New Zealand stock market. They came up with no evidence of any link between sporting team success and stock market return behaviour at any point of the surveyed time period. Edmans, Garcia and Norli (2007) who investigated the effect of cricket, Rugby, ice hockey and basketball matchs, while they found a strong negative stock market reaction to losses by national football teams. The effect of defeat in cricket, rugby and basketball were found to be insignificant. No evidence could be found as a corresponding reaction to wins in any of these sports. What can be fathomed from the above findings is that football is the main sport almost every country in the sample taken, while other sports were in secondary position.
Lastly, to talk about the differences in receptivity to sports sentiments and the consequent investment decisions in the Latin American and European stock market, it was found that Latin Americans were more emotional that their European counterparts and therefore are susceptible to more mood changes. There are two causes for which the stock market reacts to the sporting performance of the national football teams. There might be a ‘Feel-good’ factor with national football success fomenting greater faith in the future. Given the increasing commercial significance of international tournament finals, an effective stock market would revise speculation about possible economic benefits to be derived from national team performance in case of individual match results and the chances of the team progressing further in the tournament. It supports the fact that stock market reaction to qualifying and finals matches is greater than friendly matches. For friendly matches, a rather diluted feel good factor is likely to work and limited information is available on the prospects of the team in competitive tournament matches. A rather striking fact, the degree of team identification or fanaticism also influences the effect of football matches on stock market returns. A study by Salman (2005) shows that Turkish football teams such as Besiktas, Galatasaray and Fenerbache has the most fanatic of the supporters as reported by the Turkish police force. In 2009, Berument, Ceylan and Ogut-Eker (2009) only found a positive and a statistically significant relationship in the study that analysed the stock value reaction for Besiktas, while it was not so influential when it came to those of Galatasaray and Fenerbache. This supported the statement that a higher degree of fanaticism enhances reactions in the stock market. Compared to any other sports, a greater amount of fanaticism is existent in the case of football that leads to more extreme investor mood swings.
Maranhao (2007) elaborates the distinction between the two styles of playing preferred by the two population. He said that the Europeans prefer the ‘Apollonian Style’ which signifies a rational outlook while the Latin Americans prefer the ‘Dionysian Style’ that represents a more emotional approach. Europeans would have a rational way of playing the game due to their ‘Organization’, while Brazilians would have a unique way of playing of their own representing their Afro-Brazilian culture. Thus, the qualities associated with ‘Order’ and ‘Rationality’ in Brazilian football show the structure of the general society. The Brazilians attach a nationalist feeling that should first be created and then transmitted to the world to perceive, maybe that is why evaluations are ostensible during big football events, be it the acts of heroism or failure in the expected performance. John Clifton (2015) (2012) studied the emotional level of people in more than 150 countries and areas after asking residents about their experience during the
matches and he found that the emotional level of Latin American to be much higher than that of their European counterparts. The percentage of people who said ‘Yes’ after accepting their positive and negative emotions for FIFA matches was found to be ‘47.24 percent’ for the Europeans and ‘55.26 percent’ for Latin American countries in 2012, Football seems to have a powerful ability to provoke national unity through appealing people by going beyond traditional national boundaries. A thing to consider is that what started as a simple played a seriously important role in developing mankind, especially the Latin American countries. This issue can be traced back in 1938, when the unique sportive performance of the Brazilian national football team led to a kind of national identification. Here, it would be appropriate to say that perhaps Latin American people live and dreams football. It is their reason for hope and as well as suicide. Just to cite the level of involvement of the Latin American population in football, as per the study in the thesis by Wijden, J. V. (2019), about 100 thousand Brazilians suffered a heart attack when their countries lost to Uruguay in World Cup 1950 by a margin of 2-1. This match held the attendance record of 200 thousand, that was traumatic indeed for Brazilians. In the case of Europe too, the number of hospital admissions for a range of diagnoses shot up during England’s 1998 world cup matches, especially in matches with Argentina. The primary cases of diagnoses were of myocardial infarction compared any other types of health issues such as stroke, deliberate self-harm and road traffic injuries. The match against Argentina showed 55 extra admissions for myocardial infarctions, that led to the hypothesis that myocardial infarction can be triggered by emotions. Probably the most shocking news was the death of a Columbian footballer named Andres Escobar, who scored an own goal in World Cup, 1990 in a group match against United States that led to the country’s elimination. He was shot as a punishment and died just 10 days after the match.
The above-mentioned studies show the difference in the way of experiencing football between Europe and Latin America. Based on the above findings, it can certainly be said that Latin Americans react more to football match results of their national team that may get visible on the stock indices.
2.5 Based on the previous literature review we have framed the following two hypotheses:
H1: The FIFA world cup affects the returns of the host country stock indices significantly. H2: The FIFA world cup affects the returns of the sponsoring companies significantly. H3: The FIFA world cup event affects the returns of host country stock indices greater than
the returns of the portfolio of sponsoring companies.
3 Data
We have downloaded all the data on a daily basis (indices, stock’s prices, currency conversion and risk-free rate from investing.com. We have downloaded the stock price data of the sponsoring companies, the global index and the host countries’ stock indices from 2010 to 2018. We chose S&P500 as global index. By ‘Sponsoring companies’, we mean those companies that invest in the host countries’ sports infrastructures during FIFA world cup. As far as currency conversion is concerned, we have converted the stock prices into the currencies of the host countries. As a risk-free rate, the 10 Year US Treasury Bill-rate is taken.
3.1 Countries research and their major indices and currencies
The table 2 shows when the respective FIFA events were held (Years), which country hosted it (Country), what are the host countries’ stock market indices (Major index) and what are the host countries’ official currencies (Currency). In 2010, South Africa hosted the FIFA world cup. They have JTOPI as their major index and their currency Rand (ZAR). In 2014, we have Brazil as hosting country for the FIFA world cup. They have Bovespa (BVSP) as their major index and their currency Real (BRL) and the previous cycle, Russia hosted the FIFA world cup. They have two major indices MOEX Russia (IMOEX) and their currency Rubel (RUB).
Year Country Major index Currency
2010 South Africa South Africa Top 40
(JTOPI) ZAR
2014 Brazil Bovespa (BVSP) BRL
2018 Russia MOEX Russia (IMOEX) RUB
3.2 Sponsors
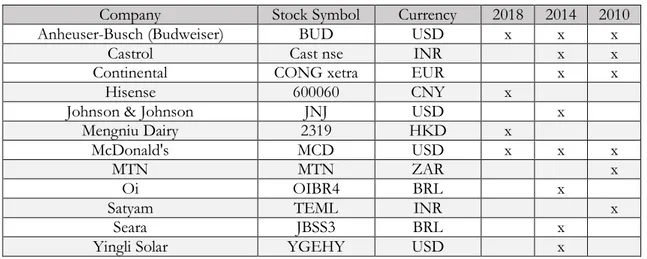
Table 3 shows which companies sponsored in FIFA (Company), in which names are sponsoring companies’ stocks traded in the stock exchange (Stock symbol) and the currencies the stocks are traded in (Currency). The ‘x’ marks under the respective years indicate which company sponsored in which of the years.
Company Stock Symbol Currency 2018 2014 2010
Anheuser-Busch (Budweiser) BUD USD x x x
Castrol Cast nse INR x x
Continental CONG xetra EUR x x
Hisense 600060 CNY x
Johnson & Johnson JNJ USD x
Mengniu Dairy 2319 HKD x
McDonald's MCD USD x x x
MTN MTN ZAR x
Oi OIBR4 BRL x
Satyam TEML INR x
Seara JBSS3 BRL x
Yingli Solar YGEHY USD x
Table 3: Sponsors indices and currencies.
3.3 Benchmark
For the event study, it is imperative to select a proper benchmark, so we have used the index to which the shares belong as a benchmark. Since the shares belong to some indices, the effects of FIFA on those indices are to be analyzed if those shares are to be studied. There are various ways to select a benchmark. The initial option might be to use a widely used global stock index such as S&P Global Inc. can be selected. The benefit of selecting a global benchmark is that it can be used for all countries. Another option is to select a country specific index as a benchmark. In this case the advantage would be that the abnormal returns will not be reduced as the host country might not be represented in that benchmark. Yet another option would be to include all other countries in the sample years and take the average of their indices as a benchmark. In this case, an own global index consisting of the countries that will be studied is created. Among the various options, we have decided to use the global index of S&P as a benchmark because of the benefit of comparing all the host country stock market indices with this one. As a result, we would be able to study the host country stock market returns based on the global index of S&P’s return. Thus, after a specific match outcome, the relevant host country stock market abnormal returns can be compared to that of the global index. For example, if the South African national football team loses a match, we would be able to
monitor, study and compare the change in the returns shown by the South African stock market index JTOPI with that of S&P. Besides, we can also compare the respective index return of the sponsoring companies’ shares that are represented in S&P.
3.4 Data description
As for the data description, we have set up two tables for each of the host countries and their sponsors during FIFA event. The columns in the first table include the average returns, the standard deviation of the returns, the maximum and minimum recorded returns and the number of observations for the host countries, the global Index of Standard & Poors and the sponsors which are mentioned in the row.
The second table shows the correlation matrix and the correlation co-efficient between the returns declared by the host countries securities indices, the index of Standard & Poors’ and sponsoring companies during FIFA.
3.4.1 South Africa 2010 FIFA
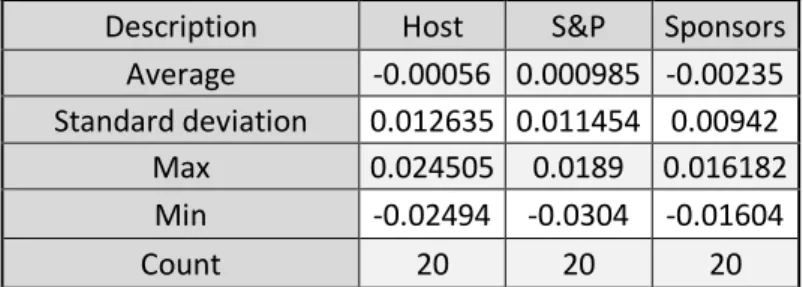
We notice that the magnitude of the average returns is small (positive and negative) for all of the indices and the portfolio of sponsoring companies' stocks (based on the return
observation of 20 trading days), while the standard deviations being 0.0126 for the host country, 0.011 for S&P and 0.00942 for the sponsors. The maximum return recorded for the host country index was 0.024, 0.018 for S&P and 0.016 for the sponsors and the minimum return recorded for the host country was -0.025, -0.03 for S& P and -0.016 for sponsors.
Description Host S&P Sponsors
Average -0.00056 0.000985 -0.00235
Standard deviation 0.012635 0.011454 0.00942
Max 0.024505 0.0189 0.016182
Min -0.02494 -0.0304 -0.01604
Count 20 20 20
Table 4: Details of returns South Africa 2010 during FIFA.
The correlation co-efficient is found to be positive for the average returns of sponsors and the host country security market returns (0.6) while it is found to be negative between average returns of sponsors and the global index of S&P Returns (-0.52). As for the correlation
co-efficient of host country stock market return and the Global index of S&P Returns, it is negative with the index of the host returns (-0.53)
Host S&P Sponsors
Host 1
S&P -0.531268114 1
Sponsors 0.641359448 -0.528454459 1
Table 5: Correlation Matrix.
3.4.2 Brazil 2014 FIFA
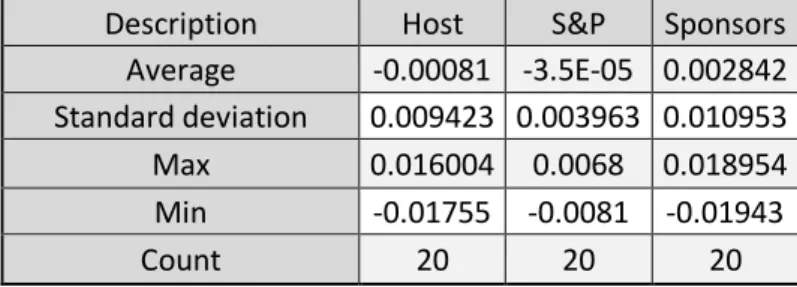
We notice that the magnitude of the average returns is small (positive and negative) for all of the indices and the portfolio of sponsoring companies’ stocks (based on the return observation of 20 trading days), while the standard deviations being 0.009423 for the host country, 0.0039 for S&P and 0.0109 for the sponsors. The maximum return recorded for the host country index was 0.016, 0.006 for S&P and 0.018 for the sponsors and the minimum return recorded for the host country was -0.01755, -0.0081 for S&P and -0.01943 for sponsors.
Description Host S&P Sponsors
Average -0.00081 -3.5E-05 0.002842
Standard deviation 0.009423 0.003963 0.010953
Max 0.016004 0.0068 0.018954
Min -0.01755 -0.0081 -0.01943
Count 20 20 20
Table 6: Details of returns Brazil 2014 during FIFA.
The correlation co-efficient is found to be negative for the average returns of sponsors and the host country security market returns (-0.017) while it is found to be negative between average returns of sponsors and the global index of S&P Returns (-0.06). As for the correlation co-efficient of the host country security market returns with Global index of S&P returns, it is negative with the index of the host returns (-0.10).
Host S&P Sponsors
Host 1
S&P -0.100385299 1
Sponsors -0.017670451 -0.065315533 1
3.4.3 Russia 2018 FIFA
We notice that the magnitude of the average returns is small (positive and negative) for all of the indices and the portfolio of sponsoring companies’ stocks (based on the return observation of 20 trading days), while the standard deviations being 0.009294 for the host country, 0.006068 for S&P and 0.011298 for the sponsors. The maximum return recorded for the host country index was 0.012, 0.008 for S&P and 0.021 for the sponsors and the minimum return recorded for the host country was -0.019, -0.013 for S&P and -0.02017 for sponsors.
Description Host S&P Sponsors
Average -0.00156 -0.00038 0.002793
Standard deviation 0.009294 0.006068 0.011298
Max 0.012422 0.0084 0.021361
Min -0.0199 -0.0137 -0.02017
Count 22 22 22
Table 8: Details of returns Russia 2018 during FIFA.
The correlation co-efficient is found to be positive for the average returns of sponsors and the host country security market returns (0.48) while it is found to be negative between average returns of sponsors and the global index of S&P Returns (0.12). As for the correlation co-efficient of host country stock market return with the Global index of S&P Returns, it is negative with the index of the host returns (-0.17)
Host S&P Sponsors
Host 1
S&P -0.1778654 1
Sponsors 0.487308078 0.128460594 1
Table 9: Correlation Matrix.
4 Method:
Here, we would analyze the security return behavior of the sponsoring companies and security returns of host countries during the FIFA world cup right from 2010 to 2018. Our motive is to look for abnormal returns in the stocks of sponsoring companies and that of the host countries around the FIFA world cup event. An important consideration to be taken into account in this aspect is the event study, which normally means the study of the time period when the analysis of securities’ return behavior concerning a particular information announcement or events, would be conducted. In this thesis, the method that will be used to analyze the existence and patterns of abnormal returns of host country security indices and the
methodology, there are two assumptions that are to be made, first, the investors are rational and the host countries’ stock markets are efficient i.e. the influence of the event is immediately incorporated in the stock prices of both the sponsoring companies and the host countries’ stock market. Some of the steps to do this has been enumerated by De Jong & De Goeij (2011) who developed a three-step model are:
• Identify the event of interest and the timing of the event
• Construct a benchmark model, to measure normal stock behavior. • Calculate and analyze abnormal returns around the event date
4.1 Conducting the Event Study
Tabulation of closing prices (CPt) of sponsoring companies’ stocks and host countries’ and
closing price indices and calculation of normal returns (Rt). Here, we have presented the closing
prices of sponsoring companies’ stocks and that of the host countries’ stock markets to conduct an estimation and event window study. What we would like to do is to calculate the returns in the following manner:
R𝑖
=
𝐶𝑃i𝐶𝑃 – 𝐶𝑃i−1i−1
.
The reason for not including the opening price is because, the opening prices are susceptible to certain factors such as match outcomes, positive earnings announcements that occur between the time span between the closing bell on one day and opening bell the next day of the stock market.
After this, we would find the daily average returns during the estimation and the event window for the equally weighted portfolio of the sponsoring companies’ indices.
RPi = 1
𝑁
∑
𝑅
𝑖𝑁 𝑖=1 .
Our next step would be to calculate the expectational regression model for both the portfolio of sponsoring companies and host countries securities markets. For this purpose, we have decided to use the Market Adjusted Model and not Capital Asset Pricing Model because the latter imposes an additional restriction that the intercept equals the risk-free rate. Because of this restriction, the variance of the error term is mostly larger in the CAPM than in the Market Model. This may result in a less powerful test. Furthermore, 79.1 percent of event studies used
this step, we would define the actual return with the help of the following market regression model
𝑅𝑖 = α𝑖 + β𝑖 𝑅𝑚𝑖 + 𝜀𝑖.
Beta has been used in the capital asset pricing model as a measure of systematic risk of a particular security or a portfolio with respect to the entire security market. It measures how the return of a particular security or portfolio responds to market return variations. It is calculated by dividing the product of the co-variance of the security or portfolio return and market return by the variance of market return for the specified period. The ‘Beta’ notation helps investors to understand the degree of systematic risk associated with the security or portfolio return movement as it changes according to the direction of the market, while a lower value implies the opposite and makes the security or portfolio good to hold or invest in. The higher the value of ‘Beta’, the riskier it will be for the investor to hold the security or the portfolio because of unpredictable market return percentage and price movements. The benchmark used to gauge the risk involved in this situation is the market return index.
Since we have applied the market model, beta would be required to find out the abnormal returns. We have used the following formula to find out the abnormal returns from which we would calculate the average, standard deviation, t-statistic and so on. The excess returns (Rm)
have been used to calculate the beta. S&P stocks has been taken as a global market. For the FIFA events, a new beta is computed for each of the host country and the sponsoring companies by taking the co-variance of the host country index excess return and the excess benchmark return of the global index and then dividing it by the variance of the market excess return var (Rm) of the estimation window.
β̂= 𝐶𝑜𝑣(𝑅𝑖;𝑅𝑚i)
𝑉𝑎𝑟(𝑅𝑚i)
.
Alpha is a term used in investment strategies to define its ability to ‘Beat the market’. In other words, it shows the return that the investor will be able to get over and above the market return by investing in securities if he or she acts as per his or her investment strategy. So, alpha is often called the ‘abnormal rate of return’. It is a measure of an investor’s performance in being able to get a return over and above that of the market’s through his or her investment strategy. The excess return of an investment relative to the return of a benchmark index is the investment’s alpha. Alpha may be positive or negative and is the result of active investing. It
often presented as single number such as +3 or -5, representing how the security or the portfolio performed compared to the market index I.e. 3 percent or 5 percent worse. Alpha and beta are used together by investment managers to calculate, compare, and analyse returns. Also, the alpha is calculated for the estimation window before each of the FIFA events with the following formula.
α̂ = R𝑖 - β̂𝑅𝑚𝑖.
Where R𝑖and Rm𝑖 are the average security return and average market return during the
estimation window for each of the FIFA events.
With the alpha and beta computed from the estimation window, we would use them to find out the normal returns during the event.
𝑁𝑅𝑖 = α̂ + β̂𝑅𝑚𝑖.
Next, we would calculate the abnormal returns (𝐴𝑅𝑖) by deducting the computed returns from
the normal returns (𝑁𝑅𝑖). The formula to calculate abnormal normal returns:
𝐴𝑅𝑖 = 𝑅𝑖 − 𝑁𝑅𝑖.
We have also calculated the average abnormal return in the event window, which is nothing, but the aggregate of abnormal returns divided by the number of observations I.e. ‘N’
AAR = 1
𝑁
∑
𝐴𝑅
𝑖𝑁
𝑖=1 .
Finding out the standard deviation and t-statistic of the abnormal returns for both the portfolio of sponsoring companies and the host countries stock markets. Next, we would find out the sample standard deviation of such abnormal returns for both the portfolio of sponsoring companies and the host countries securities markets
SD = √ 1
𝑁−1∑ (𝐴𝑅𝑖 − 𝐴𝐴𝑅) 2 𝑁
𝑖=1 .
to check such abnormal returns’ statistical significance with the help of t-Test of paired samples for each of the portfolio of sponsoring companies and host country stock market returns I.e. for the first two hypothesis.
𝑇𝑆 = √𝑁 𝐴𝐴𝑅 𝑆𝐷
However, to find out if the host country stock market returns get affected more than that of the portfolio of sponsoring companies as per the third hypothesis, we would use the T-test of independent samples, which is
𝑇𝑆 = 𝐴𝐴𝑅1− 𝐴𝐴𝑅2 √𝑆𝐷1 2 𝑁1 + 𝑆𝐷2 2 𝑁2
.
4.2 Estimation and Event Window
Here, we study the relation between the FIFA world cup with the host countries and the portfolio of sponsoring countries during FIFA by running a regression equation to prove abnormal and average abnormal returns. To gauge the effect as precisely as possible, we have considered a period of 100 working days (About 5 months I.e. from January to May) i.e. the days right before the month during FIFA world cup to monitor the effect. We would study the existence and comparison of abnormal returns between the host country and the sponsoring companies during 2010-2019 and find out if such returns are actually influenced by the FIFA event for both the host countries security indices and the equally weighted portfolio of sponsoring companies in all of the years of the event, through calculating the standard deviation and t-statistic of such abnormal returns and test for their significance. We have extended this study for the 100 working days period to the years 2010,2014 and 2018, taking into consideration, the host countries South Africa (2010-01-02 to 2010-05-31), Brazil (2014-01-02 to 2014-05-31) and Russia (2018-01-02 to 2018-05-31) respectively.
For the study above, the estimation and the event windows have to be chosen. For the estimation window, we have included 100 working days prior to the month of the event (The month of June for each of the years). Since the event normally begins in mid-June and lasts till mid-July, we have taken 100 trading days from the month of January till the end of May , to capture enough observations for the entire period so that the observations do not get influenced by the occurrence of the event and we can extend the same method of calculation to all of the 100 working days prior to the event for each of the years 2010, 2014 and 2018. For the event window, it will be the period from mid-June to mid-July for each of the years, this one month include the trading days over which the abnormal returns will be calculated.
t1
T1 T2 t2
Figure 1: Estimation and Event Window
For the period of study, we have assumed the estimation window to approximately range from 2nd or 5th of January to 31st of May (From T1 to T2) and the event window approximately
between 10th of June to 15th of July for each of the FIFA world cup years, we have intentionally
kept a gap between 31st of May to 9th of June for each of the years (From T2 to t1) to distinguish
between the estimation window of normal returns and the event window of abnormal returns (From t1 to t2) so that we are able to pinpoint the period of normal behaviour of the host countries stock market indices and the equally weighted portfolio returns of sponsoring companies and the period of abnormal behaviour for the two variables.
5 Results
After conducting the above-mentioned steps, we have come up with the following results of the host country securities market returns and the portfolio of sponsoring companies. The results have been presented in the tables mentioned down below. In the appendix, we have also presented the EViews in the appendix to support our findings.
5.1 South Africa 2010 FIFA
Detailing on the calculations part for South Africa, we have calculated the alpha and beta from the estimation window from January to May 2010. We have come up with a value of 0.000088560 for alpha and 0.702 for beta for the host country, as for the sponsoring companies the alpha is 0.000224 and the beta is 0.55705. After this, we have calculated the normal returns for the host country security markets and portfolio of sponsoring companies through NR1 =
0.000088560 + 0.702 * 0.0052 = 0.00374 and NR1 = 0.000224 + 0.55705 * 0.0052 = 0.00312.
With the normal returns calculated, we would calculate the abnormal return by deducting the normal return from the actual host country stock market returns as well as the same for the
Estimation Window
First of the year to the end of May 2010,2014 and 2018
Event Window
FIFA Event: middle of June to middle of July for 2010,2014 and 2018
- 0.00312 = -0.00334 respectively. We have done this for all of the 20 observations and calculated the average abnormal returns for each of the host country stock market and portfolio of sponsoring companies. The average abnormal returns are -0.001338597 for the host country stock market and -0.00312686 for the portfolio of sponsoring companies. Next, we would calculate the standard deviation of such abnormal returns which are 0.0182295 and 0.01389 for the host country and the portfolio of sponsoring companies, respectively. After this, we would calculate the significance of this standard deviation with the use of the t-Statistic through sqrt (20)*(-0.001338597)/0.0182295 = -0.1285 and sqrt (20) * (-0.00312686)/0.01389 = -1.00665 for the host country and the portfolio of sponsoring companies respectively. After finding out such values, we would compare the same with the critical values given in the ‘t’ table and interpret their significance. Lastly, we would end our process by finding out the t-test comparison between the two independent samples I.e the host country and portfolio of sponsoring companies through (-0.001338597 - (-0.00312686))/ sqrt ((0.0182295^2/20) +(0.01389^2/20)) = 0.3489384 and see if it is significant or not by matching it with the critical ‘t’ values.
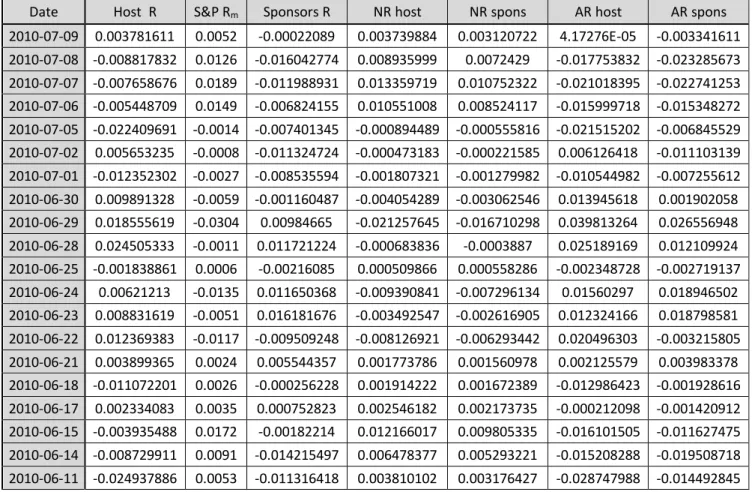
Date Host R S&P Rm Sponsors R NR host NR spons AR host AR spons
2010-07-09 0.003781611 0.0052 -0.00022089 0.003739884 0.003120722 4.17276E-05 -0.003341611 2010-07-08 -0.008817832 0.0126 -0.016042774 0.008935999 0.0072429 -0.017753832 -0.023285673 2010-07-07 -0.007658676 0.0189 -0.011988931 0.013359719 0.010752322 -0.021018395 -0.022741253 2010-07-06 -0.005448709 0.0149 -0.006824155 0.010551008 0.008524117 -0.015999718 -0.015348272 2010-07-05 -0.022409691 -0.0014 -0.007401345 -0.000894489 -0.000555816 -0.021515202 -0.006845529 2010-07-02 0.005653235 -0.0008 -0.011324724 -0.000473183 -0.000221585 0.006126418 -0.011103139 2010-07-01 -0.012352302 -0.0027 -0.008535594 -0.001807321 -0.001279982 -0.010544982 -0.007255612 2010-06-30 0.009891328 -0.0059 -0.001160487 -0.004054289 -0.003062546 0.013945618 0.001902058 2010-06-29 0.018555619 -0.0304 0.00984665 -0.021257645 -0.016710298 0.039813264 0.026556948 2010-06-28 0.024505333 -0.0011 0.011721224 -0.000683836 -0.0003887 0.025189169 0.012109924 2010-06-25 -0.001838861 0.0006 -0.00216085 0.000509866 0.000558286 -0.002348728 -0.002719137 2010-06-24 0.00621213 -0.0135 0.011650368 -0.009390841 -0.007296134 0.01560297 0.018946502 2010-06-23 0.008831619 -0.0051 0.016181676 -0.003492547 -0.002616905 0.012324166 0.018798581 2010-06-22 0.012369383 -0.0117 -0.009509248 -0.008126921 -0.006293442 0.020496303 -0.003215805 2010-06-21 0.003899365 0.0024 0.005544357 0.001773786 0.001560978 0.002125579 0.003983378 2010-06-18 -0.011072201 0.0026 -0.000256228 0.001914222 0.001672389 -0.012986423 -0.001928616 2010-06-17 0.002334083 0.0035 0.000752823 0.002546182 0.002173735 -0.000212098 -0.001420912 2010-06-15 -0.003935488 0.0172 -0.00182214 0.012166017 0.009805335 -0.016101505 -0.011627475 2010-06-14 -0.008729911 0.0091 -0.014215497 0.006478377 0.005293221 -0.015208288 -0.019508718 2010-06-11 -0.024937886 0.0053 -0.011316418 0.003810102 0.003176427 -0.028747988 -0.014492845
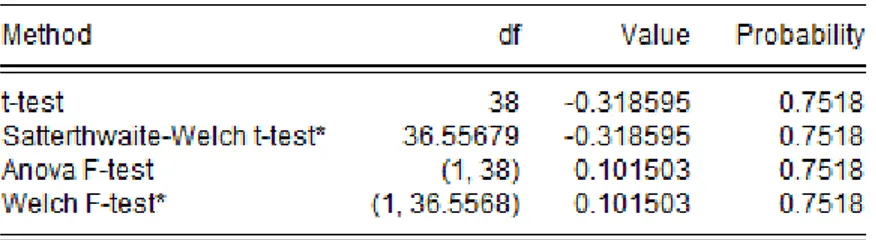
In the year 2010, the host country for FIFA world cup was South Africa and about 6 companies namely Anheuser-Busch, Castrol, Continental, McDonalds, MTN and Satyam sponsored the event. During this period, the average abnormal returns for the host country security market was –0.134 percent, which is greater than that of the above-mentioned sponsoring companies, which is –0.313 percent. This implies that the FIFA world cup has reduced the rate of average abnormal returns. Quite strikingly, some of the companies like Anheuser-Busch, McDonalds are fast moving consumer goods companies that can be associated with higher foods and beverage sales during the event. Besides, telecommunication and IT companies like MTN and Satyam were also involved in updating the digital infrastructure for better broadcasting for their subscribers. Despite that, the results have been found to be very contradictory. Moving on to the standard deviation of such returns, the standard deviation of average abnormal returns of the host country 0.01822 was found to be greater than that of the sponsors 0.01389, which implies that the former return is much more volatile than the latter. This might be due to unpredictable match outcomes for the host country football team and mixed investor sentiment along with below quality of performance of the sponsoring companies that are listed in the host country’s security market. As for the t-Statistic of the standard deviation, we have taken the absolute value and it is found to be 0.32 for the host country and 1.0066 for the sponsoring company which is less than the critical t-value of 2.086. The null hypothesis cannot be rejected with 5 percent level of significance, implying that the two average abnormal returns to be not significantly different and both are statistically zero. So, the FIFA world cup does not affect any of the returns of the host country or the portfolio of sponsoring companies. As for the t-statistic comparison, we have even conducted two t-Tests, each for one of the two independent samples namely, the host country security market and the portfolio of sponsoring companies returns, which is 0.3489, it is less than the 2.024. So, the third hypothesis is rejected as well. The FIFA world cup does not create a noticeable difference between the returns of the host country and the portfolio of sponsoring companies.
Description Host Sponsors
AAR -0.00134 -0.00313
SD.AR 0.01823 0.013891
T.statistic -0.32839 -1.00665
T.statistic 2 indpendent 0.348938401
5.2 Brazil 2014 FIFA
In the year 2014, the host country for FIFA world cup was Brazil and about 8 companies namely Anheuser-Busch, Castrol, Continent, McDonalds, Johnson and Johnson, Oi, Seara and Yingli Solar sponsored the event sponsored the event. During this period, the average abnormal returns for the host country security market was –0.028 percent, which is lesser than that of the above-mentioned sponsoring companies, which is 0.0821 percent. This implies that the FIFA world cup has reduced the rate of average abnormal returns more for the host country than that of the portfolio of the sponsoring companies. Quite plausibly, it might be because of the company Seara, which is a renowned Brazilian food company listed in the stock exchange owing brand merchandising and fast food sales along with increase in cross-country tourism. Moving on to the standard deviation of such returns, the standard deviation of average abnormal returns of the host country 0.009795 was found to be lesser than that of the sponsors 0.01198, which implies that the former return is much less volatile than the latter. This might be due to the overall stable performance of the host company security market and the support given by the quality of performance of the national companies that are listed in the host country’s stock market, than the performance of the sponsoring companies worldwide. As for the t-Statistic of the standard deviation, we have taken the absolute value and it is found to be 0.1285 for the host country and 0.3064 for the sponsoring company which is less than the critical t-value of 2.086. The null hypothesis cannot be rejected with 5 percent level of significance, implying that the two average abnormal returns to be not significantly different and both are statistically zero. So, the FIFA world cup does not affect any of the returns of the host country or the portfolio of sponsoring companies. As for the t-statistic comparison, we have even conducted two t-Tests, each for one of the two independent samples namely, the host country security market and the portfolio of sponsoring companies returns, which is 0.3185, it is less than the 2.024. So, the third hypothesis is rejected as well. The FIFA world cup does not create a noticeable difference between the returns of the host country and the portfolio of sponsoring companies.
Description Host Sponsors
AAR -0.00028 0.000821
SD.AR 0.009795 0.01198
T.statistic -0.12852 0.306449
T.statistic 2 indpendent -0.318594725