VTT notat
Nr: 42-1996 Utgivningsår: 1996
Titel: Samband mellan Flakiness och Shape Index samt flisighetstal. Resultat från VTT:s del-tagande i europeisk M & T ringanalys.
Författare: Peet Höbeda och Jerzy Chytla
Programområde: Vägteknik (Asfaltbeläggning) Projektnummer: 60351 Projektnamn: Stenmaterial Uppdragsgivare: Vägverket Distribution: Begränsad div Väg- och transport-forskningsinstitutet ä
Samband mellan Flakiness och Shape Index samt
flisig-hetstal.
Resultat från VTl:s deltagande i europeisk M&T ringanalys.
av Peet Höbeda och Jerzy ChytlaINNEHÅLLSFÖRTECKNING
1
Bakgrund/syfte
2
Undersökta material
3
Resultat
4
Kommentarer
5
Referenser
Bilaga 1. TabellerBilaga 2. Flakiness Index, prEN933-3
Bilaga 3. Shape Index, prEN933-4.
Sid
10
1 Bakgrund/Syfte
En tidigare jämförelse har gjorts av nuvarande, för beläggningssten använt flisig-hetstal (FAS 209-94), med föreslagna europastandarder Flakiness Index (prEN
933-3) och Shape Index (prEN 933-4). Resultaten har redovisats i VTI Notat
64-1995. Möjlighet till viss ytterligare erfarenhet erbjöds genom deltagande i den europeiska precisionsanalys som fn. utförs med en del föreslagna Europa-standarder inom CE DG XII Measurement and Testing Project No 134. (Tidigare har VTI deltagit i ringanalys av Los Angelesprovning enligt prEN 1097-2 för håll-fasthet hos stenmaterial). Endast Flakiness Index har ingått i precisionsprov-ningen. Shape Index och flisighetstal har dock utförts som komplement för att utöka kunskapen om sambanden mellan olika mätmetoder för komform.
2 Undersökta material
Tre utländska stenmaterial, två prov av varje, benämnda X, Y och Z, har erhållits via Sveriges Provnings- och Forskningsinstitut (SP). Komformen bestäms enligt föreslagna europametoder inte hos väldefinierade analysfraktioner såsom för flisighetstal. Provmaterialet är större än 4 mm men övre siktöppning D definieras inte.
De erhållna proven var samtliga >4 mm, men med varierande maximal stenstorlek
(dvs. 4/Dvalr för d/D). Sorteringar och petrograñsk sammansättning framgår nedan:
Prov X, 4-25 mm. Krossat berg, bestående av kalksten (tät, fossilförande). Prov Y, 4-16 mm. Krossat berg, bestående av tät vulkanit.
Prov Z, 4-12,5 mm. Krossat naturgrus.
Prov Z utgörs av flintgrus varvid den helt dominerande flintan är extremt flisig, stänglig och skarpkantig. Viss halt finns av rundade, men ofta samtidigt flisiga kom av kritkalksten.
Samtliga bergarter är täta, dvs. mycket ñnkomiga och av typer som sällan används i Sverige. Täta bergarter är, med undantag av kalksten, benägna att bilda flisig komform vid krossning.
3 Resultat
Resultaten för varje provning och medelvärden för Flakiness och Shape Index framgår av tabell 1, medan analysprotokollen gesi bilaga 1. Man kan notera att enkelvärdena ligger mycket nära varandra. Resultaten från provning av flisighets-tal ges i tabell 2. De analysfraktioner, som varit möjliga att prova enligt metoden, siktades därvid från proven (4/Dvw). Även i detta fall erhölls god samling av värdena för de två delproven. Den svenska metoden har fördelen att vara betydligt snabbare att genomföra än bestämningarna enligt de båda föreslagna europa-standarderna. De senare är inte heller begränsade till beläggningssten och vid
test-ning av obundet material med hög maximal stenstorlek (D) blir arbetsinsatsen
särskilt stor.
Tabell 1 FÖrsöksresultat och medelvärdenför Flakiness och Shape Indexför analysffaktioner 4/Dva,
Flakiness lndex, F.l.
( pr EN 933-3)
Level Test portion 1 Test portion 2 Mean value
X 7,0 8,3 7,7
Y 27,3 26,5 26,9
Z 48,9 49,1 49,0
Shape Index, S.I.
( pr EN 93134 )Level Test portion 1 Test portion 2 Mean value
X 9 10 10
Y 49 48 49
Z 56 52 54
Tabell 2 Flisighetstalför olika analysf'aktioner. Medelvärden och enskilda värden inom parentes.
Material 5 6-8 0 mm 8,0-11,2 mm 11,2-16,0 m X - 1,26 (1,25, 1,27) 1,27 (1,27;1,27) Y 1,56 (1,56;1,56) 1,54 (1,54;1,53)
-Z >1,68 -
Prov Z var alltför flisigt (>1,68) för att kunna bedömas enligt FAS-metoden för analysfraktion 5,6-8,0 mm, men även prov Y har hög flisighet för svenska förhåll-anden (man brukar dock i första hand prova flisighetstal för beläggningssten).
4 Kommentarer
För att få en koppling till tidigare försök harresultaten prickats in för hand i dia-gram från Notat 64-1995 (Man har tidigare använt sig av ett numera utgånget kal-kylprogram). Detta är dock endast möjligt att ta med två värden eftersom prov Z hamnar långt utanför diagrammen. Resultaten för Flakiness index ordnar sig väl i
sambandet med flisighetstal (figur 1 och 2), trots att endast material 4-16 mm
provats vid föregående undersökning, medan D växlar vidden föreliggande
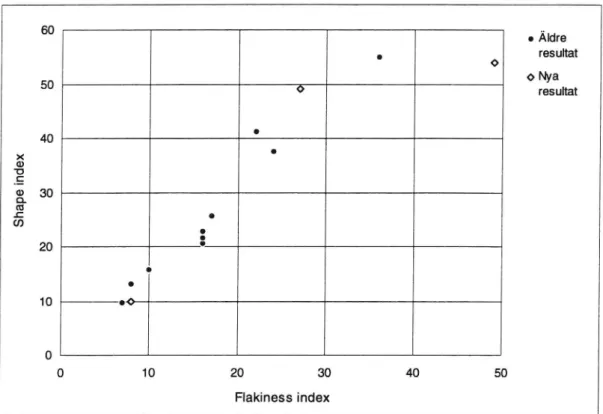
preci-sionsanalysen. Vidare bekräftas det goda sambandet mellan Flakiness och Shape
Index (figur 3 och 4).
1,80 0 Äldre resultat 1,70 = 0 Nya resultat 0 ;g 1,60 g 0
å
g 1,50 0 E*3 1,40
.C .9 ° 0 g a- 1,30
o 0 0 1,20 ' 1,10 10 20 30 40 Flakiness indexFigur 1 Samband mellan flakiness index (FI) och medelflisighetstal för jrakiion 8-16. Nya resultat från europeisk ringanalys. Aldre
resul-tatfrån VTI notat 64-1995.
1,80 .. o Aldre resultat 1,70 = 0 Nya resultat 0 A1 ,60 ä 3 O 8 ?5:150 0 'a17, 651,40 .C 0 . 'i1,30 o ' 0 0 0
1,20
'
1,10 0 10 20 30 40 Flakiness index (,,_8.16m)Figur 2 Samband mellan flakiness index för fraktion 8-16 och medel/lisig-netstal för jraktion 8-16. Nya resultat från europeisk ringanalys. Aldre resultatfrån VTI notat 64-1995.
60 0 Äldre . resultat 0 0 Nya 50 0 resultat
40
'
x 0 (D 'D .E 3 30 (6 .C 0 (I) O C 20 ' II 0 10 00 0 0 10 20 30 40 50 Flakiness indexFigur3 Samband mellan flakiness index (F1). och Shape index (SI). Nya resultat från europeisk ringanalys. Aldre resultat från VTI notat 64-1995. 60 .. o Aldre 0 resultat 0 Nya 50 0 resultat 40 ° 0 X 0 'D .E 0) 30 0. (B .C C (I) O C 20 ' O 0 10 . je 0 1,10 1,20 1,30 ' . 1,40 1,50 1,60 1,70 1,80 FHS'ghetSta' (medelvärde 8-16)
Figur 4 Samband mellan Shape Index (SI) och medelflisighetstal för
VTI notat 42- 1996
jraktion 8-16. Nya resultat kan europeisk ringanalys. Äldre
Inom CEN-arbetet med europastandardisering av stenmaterial (TC 154) har det hävdats att man mäter olika egenskaper enligt Flakiness resp Shape Index och att två separata standarder därför behövs. Detta bekräftas dock inte av denna under-sökning som visar på en bra korrelation. Samband mellan dessa två komforms-mätningar har även tidigare erhållits vid vissa utländska undersökningar (jfr. VTI Notat 64-1995). Samtidigt bör man vara medveten om att enstaka undantag alltid kan förekomma. Flisiga partiklar är som regel samtidigt också stängliga, men det
kan finnas stenmaterial, t.ex. bergarter med extremt stavformigt utbildade och till
knippen orienterade mineral, som bildar stängliga kom som samtidigt inte är påtagligt flisiga.
Sambanden mellan Shape resp Flakiness Index och flisighetstal är sämre än för europametoderna sinsemellan. Detta förmodas bero på att man enligt båda
europa-förslagen bestämmer _halÅr_ av missformade korn enligt vissa definitioner samt
dessutom för samma, ofta ganska vida sorteringar. Vid provning av flisighetstal mäter man däremot i princip det genomsnittliga förhållandet mellan bredd resp. tjocklek hos komen i en snäv analysfraktion genom sortering på först kvadratiska och sedan på spaltformade öppningar.
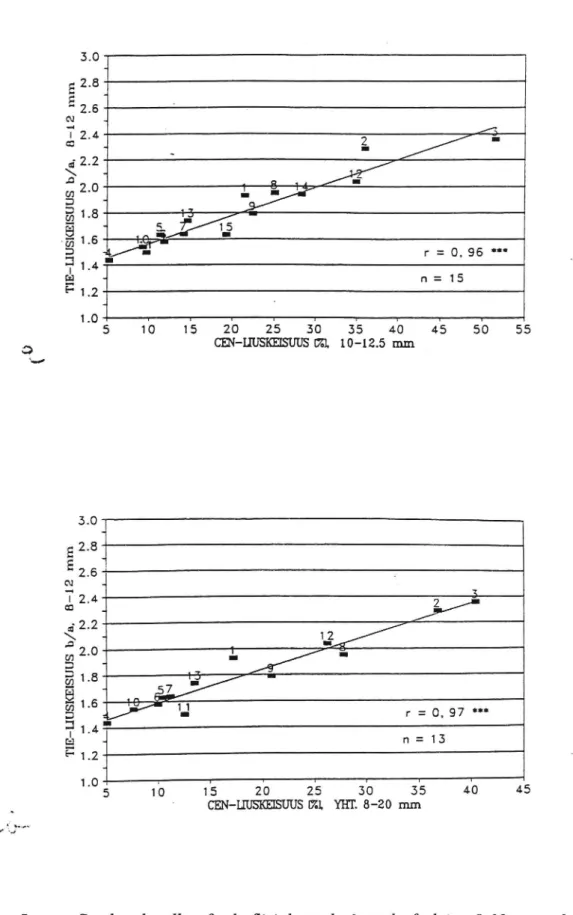
Efter det att försöken slutförts erhölls kännedom om en finsk undersökning (Vuorinen 1995) där man bl.a. jämfört Flakiness Index med ñnskt flisighetstal som dock bestäms på annat sätt än det svenska och därvid ger högre värden. (Man mäter för hand enskilda partiklars axelförhållanden i en mätlåda och räknar ut ett
medelvärde för bredd- och tjockleksförhållandet. Det är således fråga om en mer
direkt mätning av axelförhållandet än vid den indirekta svenska metoden, innebärande en dubbelsiktning). Försöksmaterialet har varit 8-20 mm och olika delfraktioner har studerats. Man har erhållit genomgående mycket goda korrela-tioner med finskt flisighetstal. Figur 5 ger resultat för analysfraktion 8-12 mm vid finskt flisighetstal, Flakiness Index korrelerar således väl både vid näraliggande ( 10-12,5 mm) och vid bredare (8-20 mm) analysfraktion.
P* o 52.8 g: 2.6 0) 12.4 en 2.2
2
m2.0
:3 81.8.§15
3 r :0.96"-?1.4
ä n: 15 E"1.2 1.0 10 15 20 25 30 35 40 45 50 55 CEN-IIUSKEISUUS m 10-12.5 mm (N 0 8 -1 2 m mN
N
m 00N
.N
N # r :0,97 'W' 13 Tl E-UU SK EI SU US b/ a. _ J ud d -L N ' o b l xm o o o 5 10 15 20 25 30 35 40 45 ' CEN-IIUSKEISUUS [7.1. YHT. 8-20 mmFigur 5 Samband mellan finsktflisighetstal på analysfi'aktion 8-12 mm och Flakiness Index för analysfi'aktioner a) 10-12,5 mm och b) 8-20 mm (Vuorinen 1995).
5 Referenser
Chytla, J mil.: En jämförelse av flisighetstal med föreslagna europastandar-der: Flakiness och Shape Index. VTI notat 64-1995.
Vuorinen, J.: Particle Shape Determination- Comparision of CEN-Standard and TIE Method (på ñnska med engelsk sammanfattning). Tielaitos. Tielai-toksen selvityksilä 6/1995.
Determination of the Flakiness Index, F.l.
Biiaoa 1 Sid 1 (.17)
(pr EN 933-3)
Laboratory N° : LEVEL N° : X Operator : a Oka-[H q. Sample N° Test Portion N° : 'I Date 13 / 3 / 1986 Test portion mass : Mass retained on 80 mm sieve = "
M0 = 41 396,4
Mass passing4mmsieve
=
59-1
Sum of discarded masses = 5 8 a 1
Sieving on test sieves Siexing om har sieves Size fraction di/Di Mass of size Nom. width of slot Mass passing bar
(mm) fraction di/Di in har sieve sieve (mi/Ri) x 100
Ri (3)
(mm)
mi (3)
63/80 40 50/63 31,5 40/50 25 31,5/40 20 25/31,5 - 1620/25
86. 8
12,5
0.0
0. 0
16/20
'3) 2,64%
10
260.2
8:1
12,5/16
6 0.2.9 6
8
?519. 5
6.3
10/12,5
4 9 26 , L,
6,3
1 31'. 5
"124
8/10
485. 3
5
38.5
'4.9
6,3/8
94.4
4
44.5
12.6
:76,3
30. 5
3,15.
2 ,1
6 .4,
4/5
|5.5
2.5
2-3
[L118
M1=ZRi=
44 936,3
M2=2mi=
8356
M 2FI = :4-1- x 100 =
"5(- . O
1OOl:Mo-(ZIRi-1-Zdisczirdedmasses) 1= 0' 0 < 1% Mo - Result with one decimal- Resultats avec une décimale
wire mesh m perforated plate D
Sieves used :
Biiaga 1 Sid 2 (17)
Determination of the Flakiness Index, FJ.
(pr EN 933-3)
Mo
Laboratory N° : LEVEL N° : X Opemtor :
EUMM*-Sample N° Test Portion N° : 2 Date 12 /lq / *216 ' Test portion mass : Mass retaincd on 80 mm sieve = "'
Mo = 'M 0 O 5. 9 Mass passing 4 mm sieve = 5 5- 5
Sum of discarded masses = 5 5. S
Sieving on test sieves Sieving on bar sieves Size fraction di/Di Mass of size Nom. width of slot Mass passing bar _
(mm) fraction di/Di in har sieve sieve (mi/Ri) x 100
Ri (g)
(mm)
mi (3)
63/80 40 50/63 31,540/50
25
31,5/40 20 25/31,5 16' 20/25
-4 o 8. 9
12,5
..
1.8
1.2
16/20
?3209.4
10
354.2
44.0
12,5/16
515293
8
366.9
1.4
10/12,5
4 812.8
6,3
125.8
6.9
3/10
11111,?
5
29.2
6.5
6,3/8
448.5
4
iH,5
42.
5/6,3
39.3
3,15.
Ali
-f6.3
4/5
'14.0
2.5
?5.4
48.2
M1=2Ri= 40 9146.1/ M2=Zrni= 910,9 M2= m. x 100 =
8 . 3
10O[Mo-(ZRi+Zdiscz1rdedmzisses) 1= <1%- Result with one decimal - Résultats avec une decimale
wire mesh
performed plate D Sieves used :
Biiaga 1 Sid 3 (1.7)
Determination of the Flakiness Index, FJ.
(pr EN 933-3)
Laboratory N° : LEVEL N° : Y Operator : ;IGM-rm.
Sample N° : Test Portion N° : 4 Date : 2% :9 '9 6 Test portion mass : Mass retained on 80 mm sieve =
'-Mo = 2 509. 8 Mass passing4 mm sieve = 4 2 2 . '3
Sum of discarded masses = 4 2 .2 a 3
Sieving on test Sieves Sieving on bar Sieves
Size fraction di/Di Mass of size Nom. width of slot Mass passing bar
(mm) fraction di/Di in har sieve sieve (mi/Ri) x 100
Ri (3)
(mm)
mi (g)
63/80 40 50/63 31,5 40/50 25 31,5/40 2025/31,5
'
16
20/25
'
12,5
16/20 1012,5/16
14+. I
8
Li H. 5
60. i
10/12,5
1115.2,
6,3
1 4.2.8
23.?
8/10
439.55
5
17-34
Ung
6,3/8
659.8
4
2415.1
31.6
376,3
344. 9
3,15.
83. 9
22.2
4/5 99. 11» 25 11.9 2.2.0M1=2m=
2325.2 M2=zmi=
45m
FI = M2- 3: 100 = 2_ 7 . 2) M1 IOO[Mo--(ZRi-i-Z'då/:ardedrnzisses) 1: 0.4 <l%- Result with one decimal - Résultats avec une de'cimale
Sieves used : wire mesh @ performed plate D
Bilaga 1
Sid 4 '17)
Determination of the Flakiness Index, FJ.
(pr EN 933-3)
Laboratory N° : LEVEL N° : Y Opcmtor :
3644-14-Sample N° Test Portion N° : 2 Date Iz /Lç 1I 99 6'
Test portion mass : Mass retained on 80 mm sieve =
'-Mo = 2_ 5 59. 5 Mass passing 4 mm sieve = 463. Z
Sum of discarded masses = 46 5.2 Sieving en test sieves Sieving en bar sieves
Size fraction di/Di Mass of size Nom. width of slot Mass passing bar
(mm) fraction di/Di in har sieve sieve (mi/R1) x 100
Ri (2)
(mm)
mi (g)
4 63/80
40
50/63 31,5 40/50 25 31,5/40 20 25/31,5 16 20/25 12,5 16/20 10L
12,5/16
59.0
8
26,2
41,1,
10/12,5
1429.4
6,3
44 3.8
26.5
3/10
5??.4
19.1%
25.9
6,3/8
?39.14
4
220.3
298
376,3
LUM. Li
3,15.
94-. 11
20. 5
.vs
11e;.3
25
118« Li
Qi4oh
M1=ZR1°=
2_ 395,3
M2=Zmi=
635. 5
FI = ü x 100 = 2 6 . 5
M1 100 [Mo-(ZRi+Zdä:ardedmasses) 1= ()|OL_1 (1%- Result with one decimal - Résulms avec une decimale
Sieves used : wire mesh m
performed plate D
Biiaga 1 Sid 5 (17)
(pr EN 933-3)
Determination of the Flakiness Index, F.I.
Laboratory N° : LEVEL N° : Z Operator : 3 cha-Ia.
Sample N° Test Portion N° : 1 Date : 20 /§ / 139 é Test portion mass : Mass retained on 80 mm sieve =
-Mo = 3 (DÅ-'4.14 Masspassing4mrnsieve = 533.5 Sum of discarded masses = 533. 5 Sieving on test sieves Sieving on bar sieves
Size fraction di/Di Mass of size Nom. width of slot Mass passing bar
(mm) fraction di/Di in har sieve sieve (mi/Ri) x 100
Ri (g)
(mm)
mi (g)
63/80 40 50/63 31,5 40/50 2531,5/40
20
25/31,5 16 20/25 12,5 16/20 10 12,5/16 8 10/12,5 4 .3 6,3 - 0:08/10
95. 9
5
2.9.0
30.2.
6,3/8
1105.2.
4
198.5
L190
5/6,3
906.4'
3,15
4696
51« 9
4/5
4426.4
2.5
SL124'
48.2
M1=2Ri=
2533.5
M2=2mi=
1238.8
M2:4-1- x 100 = 41 8, 9
100 [Mo-(ZRi+Zd;/::ardedmasses) 1: 014 < 1%- Result with one decimal
- Re'sultats avec une décirnale
Sieves used : wire mesh E]
perforated plate D
BHaga 1 Sid 6 ('17)
Determination of the Flakiness Index, F.l.
(pr EN 933-3)
Laboratory N° : LEVEL N° : Z Opemtor : aáljña_
Sample N°
:
Test Portion N° : 2_
Date
: :5/14 / | 9 9 6
*Test portion mass : Mass retained on 80 mm sieve =-Mo = 2 885. 5 Mass passing4mmsieve = 568.0
Sum of discarded masses = 56 8 . o
Sieving on test sieves Sieving om har sieves Size fraction di/Di Mass of size Nom. width of slot 'Mass passing bar
(mm) fraction di/Di in har sieve sieve (mi/PJ) x 100
R1 (8)
(mm)
mi (g)
63/80 40 50/63 31,540/50
25
31,5/40 | 20 25/31,5 1620/25
°
12,5
16/20 10 12,5/16 810/12,5
11.1
6,3
5. 3
42. 8
8/10
QHA
5
?MM
3%*
6,3/8
'3382.8
4
489.14
[195
376,3
?9h 5
3,15.
1122.?
53%:
4/5
4 032. 9
2.5
§29. 5
L411*
M1=ZRi=
23I6_.L,
M2=Zmi=
4438.0
FI = MÅ Y 100 = 4 9, 'f
100 [Mo-(ZRi-»Zdå/:ardedmasseä 1= (1%
- Result with one decimal - Résulmts avec une de'cimale
Sieves used : wire mesh
performed plate E]
P41aga 1
md7lfn
TEST DATA SHEET USED FOR DETERMINING THE SHAPE INDEX OF COARSE AGGREGATE
Laboratory : \/ T I
nLiñCaLionothcsamplc: X (TP '1)
Date:
Zl /?>/133é
Operator :
'article size fraction ' Mass of tes: portion M1 . Mass of non-cubical Shape Index SI °/o
' g mmmähü =manxwo
mm ' 8 to the nearest whole number
4 _ g
20. 2
'vn H
3?
8-16
4039.H
133.8
43
, ,- O
icnu'ñcation of the sample :
Bi1aga_1
§1'd'8 (17)
TEST DATA SHI-:ET USED FOR DRTERMINING THE SHAPE INDEX OF COARSE AGGREGATE
Laboratory: VT'I
Date: 3/L. /1994
Operator : äwb
Patrick: size fraction.. Mass of tes: portion M1 . Mass of non-cubical Shape Index SI %
' g particles M2 = (MZ/M1) x 100
mm g to the nearest whole number
4 - 8
25. :F
"9. 6
3?
8-Ié
/1 469.9
42%?
M
46-25
5:1.5
H14
8
1+ -25
4108.4
42%.6
40
Bi1aga 1 Sid 9 (10)
TEST DATA SHEET USED FOR DETERMINING THE SHAPE INDEX OF COARSE AGGREGATE
:ntiñcation ofthe sample : y (T F 4)
Laboraton': VTl
Date: zl/s/xaâé
Operator : 'KLM-We_
'article size fracu'on .Mass of test portion M1 . Mass of non-cubical Shape Index SI %
.. g particles MZ = (MZ/M1) x 100
mm _ 3 to the nearest whole number
8-46
3859
466.2
H3
A-1é
251,?
369.8
149
Bi1aga1 _
Sid 10 (17)
TEST DATA SHEET USED FOR DETERMINING THE SHAPE INDEX OF COARSE AGGREGATE
Laboratory : \( T| dcnu'ñcation of Lhe sample : y ( TP 2) Date : 'SS/L. /I 3 Sá
Operator :
Pmicle size fracu'on Mass oftes: portion M1 ' . Mass of non-Gubical Shape Index SI %
'
\
g
particles MZ
= (MZ/M1) x 100
mm g to the nearest whole number
14-2
299.0
451.3
53
8-16
336.3
458.9
A5
[_1_[6
5555.3
3:62,
BHagaI_
\
Sid 11 (17)
TEST DATA SHEET USED FOR DETERMINING THE SHAPE INDEX OF COARSE ACGREGATE Laboratory : V T I ntiñcan'on ofthe sample: Z (TP '1) Date: 11/3/lggé
Operator : B
article size fraction .Mass of tes: portion M1 . Mass of non-Gubical Shape Index SI %
g particles M2 = (MZ/MI) x 100
mm . 3 to the nearest whole number
4 - g
4 52. L.
89. 6
59
g _ '0 10( 8 2 , q 2 2
A-(O
M32
92.0
56
Bi1aga 1 Sid 12 (17)
TEST DATA SHEET USED FOR DETERMDIING THE SHAPE INDEX OF COARSE AGGREGATE
icmiñcation ofthe sample : Z (TP
Laboratory : V T1
Date: 3/11/1996 Operazor :
:EC/Lidm-"' 1
. . . - _ f b'cal Shape Index SI %
Parade szze fracnon | Mass of testgpomon M1 Måsaiådåsnäzu 1
= (111,Iz/Mn x 100
mm 8 to the nearest whole number
4 - g
4 L: 9. 5
?9. 4
5 3
4-10
458%
81. 87
52.
Bi1aga 1
Sid 13 (17)
. . Bilaga 2
FllSlghetStal (enl. FAS metod 209-94)
Prov: X 1
Använd fraktion: 11,2-16 mm
Stannar på sikten, gram
Sikt A B C D Ursprungsvikt 503,8 504,6 11,2 207,9 214,9 8 273,8 262,3 Slå 193 2%2 4 Siktrest 3,2 2,8 Summa 504,2 504,2 Diff -0,4 0,4 FLISIGHETSTAL: 1,27 1,27
MEDELVÄRDE:
1,27
Sägn. VTI notat 42-1996BiTaoa 1
s1' d 14 ( 17)
. . Bilaga 2
FIISlghetStal (enl. FAS metod 209-94)
Prov: X 1
Använd fraktion: 8-11,2 mm
Stannar på sikten, gram
Sikt A B C D Ursprungsvikt 502,6 503,9 1L2 8 217,3 210,3 5,6 23 1,5 235,1 4 5L2 553 Siktrest 2,1 2,9 Summa 502,1 503,6 IDHT (LS (13 FLISIGHETSTAL: 1,25 1,27
MEDELVÄRDE:
1,26
Eügn. VTI notat 42-1996Bi1aga l
S 1' d 15 ( 17 )
. . Bilaga 2
FIISIghetStal (enl. FAS metod 209-94)
Prov: Y 1
Använd fraktion: 8-11,2 mm
Stannar på sikten, gram
Sikt A B C D Ursprungsvikt 494,5 496,2 1L2 8 54:5 6L9 5,6 262,8 258,5 4 155,2 15 1,1 Siktrest 21,9 25,0 Summa 494,4 496,5 Diff 0,1 -O,3 FLISIGHETSTAL: 1,54 1,53 MEDELVÄRDE: 1,53 Sign. VTI notat 42-1996
BHaga 1
Sid 16 ( 17)
. . Büa a2
FllSlghetStal (enl. FAS metod 209-94)
g
Prov: Y 1
Använd fraktion: 5,6-8 mm
Stannar på sikten, gram
Sikt A B C D Ursprungsvikt 443,6 442,0 1 1,2 8 5,6 20,2 23,7 4 259,9 253,2 Siktrest 163,5 165,0 Sununa 443x3 44L9 Diff 0,0 0,1 FLISIGHETSTAL: 1,56 1,56
MEDELVÄRDE:
1,56
Eägn. VTI notat 42-1996Bi1aga 1
Sid 17 ( 17)
. . Bila a2
Fhslghetstal (enl. FAS metod 209-94)
g
Prov: Z 1
Använd fraktion: 5,6-8 mm
Stannar på sikten, gram
Sikt A B C Ursprungsvikt 355,3 357,6 11,2 8 5,6 17,9 33,9 4 148,6 120,6 Siktrest 188,7 203,2 Summa 355,2 357,7 Diff 0,1 -0,1 FLISIGHETSTAL: > 1,68 > 1,68
MEDELVÄRDE:
> 1,68
Sign. VTI notat 42- 1996uur'u l
EUROPEAN STANDARD
Biiaga 2prEN 9333513
NDRME EUROPEENNE Sid 1 (9)
EUROPÄISCHE NORM November 1992
UDC
Descriptors :
Engiish version
Tests for geometricai properties of aggregates Part 6: Determination of particie shape
-Fiakiness index
Prüfverfahren für geometrische
Eigenschaften von Gesteinskörnungen Teii 6: Bestimmung der Kornform -Piattigkeitskennzahi
Essais pour déterminer les
caractéristiques géométriques des granuiats - Partie 6: Détermination de
1a forme des granuiats - Coefficient d'apiatissement
This draft European Standard is submitted to the CEN members for CEN enquiry. It has been drawn up by Technicai Committee CEN/TC 154.
If this draft becomes a European Standard, CEN members are bound to comoiy with the CENICENELEC Interna] Reguiations which stipuiate the conditions for giving this European Standard the status of a nationai standard without any aiteration. ' This draft European Standard was estabiished by CEN in three officiai versions
(Engiish, French. German). A version in any other ianguage made by transiation under the responsibiiity of a CEN member into its own 1anguage and notified to the Centra] Secretariat has the same status as the officiai versions.
CEN members are the national standards bodies of Austria, Beigium, Denmark, Finiand, France, Germany, Greece. Iceland. Ireiand, Itaiy, Luxembourg, Netherlands, Norway, Portugai, Spain, Sweden. Switzeriand and United Kingdom.
CEN
European Committee for Standardization Comitê Européen de Normaiisation Europäisches Komitee für Normung
Centra] Secretariat: rue de Stassart 36. 8-1050 Brusseis c CEN 1992 Copyright reserved to ai] CEN members
Ref. No. prEN 933-6:1992 E
Bi1a a 2
Sid
(9)
Page 2prEN 933-gz1992
Contents Clause Foreword 1. Scope 2. Normative references 3. Definitions 4. Principle 5. Apparatus6. Preparation of test portions 7. Procedure
8. Calculation and expression of results 9. Test report 10. Precision Page C O \ J \ I C \ U 1 U T D -J > b -b ;I VTI notat 42-1996
w Bila a 2 Sid (9) Page 3
prEN 933-dz1992
;3
ForewordThis European Standard was prepared by CEN/TC 154, Aggregates. It received approval from the CEN Technical Board on ...
This Standard forms part of a series of tests for geometrical properties of aggregates. Test methods for other properties of aggregates will be covered by Parts of the following European Standards:
EN .... Tests for general properties of aggregates *
EN .,.. Tests for mechanical and physical properties of aggregates ) EN .... Tests for chemical properties of aggregates '
EN .... Tests for thermal and weathering properties of aggregates ) EN .... Tests for stone for hydraulic structuresm
No existing European Standard is superseded.
fl
(1) In course ofpreparation
Bilaga 2 Sid 4 (9)
Page 4
.3
prEN 933-éz1992
1. Scope
This Part of this European standard specifies the procedure for the determination of the flakiness index of aggregate and applies to aggregates of natural or artificial origin, including lightweight aggregates.
The test procedure specified in this Part of this European Standard is not applicable to particle sizes less than 4 mm or greater than 80 nmn
2. Normative references
This EurOpean .Standard incorporates by dated or by undated reference, provisions from other publications. These normative references are cited at the appropriate places in the text and the publications are listed hereafter. For dated references, subsequent amendments to or revisions of any of these publications apply to this European Standard only when incorporated in it by amendment or revision. For undated references, the latest edition of the publication referred to applies.
EN .... Tests for general properties of aggregates. Part .. Methods for
samplingm
EN .... Tests for geometrical properties of aggregates. Part .. Determination of particle size distribution - Granulometric
analysis (sieving method)m
EN .... Tests for geometrical properties of aggregates. Part .. Determination of particle size distribution - Test sieves
(Nominal size of apertures)m
3. Definitions
For the purposes of this standard, the following definition shall apply. Granular class d/D All particles in a sample passing a sieve of aperture size D mm retained on a sieve of aperture size d nmn
4. Principle
The test consists of two sieving operations. First, using test sieves, the sample is separated into various granular classes d/D, where D = 1.25 d. Each of the granular classes d/D is then sieved using grid sieves which have
parallel slots of width D/2. '
The flakiness index of each granular class d/D is calculated as the mass of particles passing the corresponding grid sieve, expressed as a percentage by mass of that granular class.
The overall flakiness index is calculated as the total mass of particles
passing the grid sieves expressed as a percentage of the total dry mass of
particles tested.
(2) In course of preparation
Bilaga 2 Sid 5 (9) Page 5
prEN 933%á21992
;i 5. Apparatus5.1 Test sieves, with square apertures, complying with the requirements of EN .... m with the following aperture sizes:
80 - 63 - 50 - 40 - 31.5 - 25 - 20 - 16 - 12.5 - 10 - 8 - 6.3 - 5 and 4 mm.
5.2 Corresponding grid sieves comprising parallel cylindrical bars:
40 - 31,5 - 25 - 20 - 16 - 12.5 - 10 - 8 - 6.3 - 5 - 4 - 3.15 and 2.5 mm.
For each grid. the slots formed shall comply with the following conditions: (a) No more than 10% of the total length of the slot spacing shall differ
more than 0.25 mm from nominal spacing.
(b) At no point along the slots shall the width of the slot differ more than 0.5 mm from the nominal spacing.
5.3 Balance or scale, accurate to 3 0,1% of the mass of the test portion. 5.4 'Ventilated oven thermostatically controlled to maintain a temperature of
110 : 5°C or other suitable equipment for drying the aggregates, without causing any granulometric breakdown.
6. PREPARATION OF TEST PORTIONS 6.1 Taking the test portion
I The test portion shall be prepared in accordance with the requirements of
EN 0... (5,0
Note. The mass of the test portion depends on the dimensions and the percentage of its largest components.
The test portion shall comply uüth the limits for granulometric analysis
specified in EN .... *,
6.2 Preparing the test portion
Dry the test portion at 110 1' 5°C to constant mass. Sieve the dry test portion on a 4 mm sieve and discard the particles passing. Weigh the mass
retained, Mo, to 1 0,1%.
'_A
'l
(3) EN .... Tests for geometrical properties of aggregates. Part .. Determination of particle size distribution - Test sieves
(Nominal size of apertures) (In course of preparation)
(4) EN .... Tests for general properties of aggregates. Part .. Methods for
sampling (In course of preparation)
(5) EN .... Tests for geometrical prOperties of aggregates. Part .. Determination of particle size distribution - Granulometric
analysis (sieving method) (In course of preparation)
_ s
Ri1aga 2
Page 6
L.Sid 6 (9)
prEN 9331531992
7. PROCEDURE7.1 Sieving on square aperture sieves
Sieve the dry test portion using the sieves specified in 6.] in accordance
with the requirements of EN .... *.
Recover the various fractions d/D. Weigh each granular class to 2 1 g. 7.2 Sieving on grid sieves
Sieve each granular class d/D obtained from 7.1 on the corresponding grid sieve givenin table 1. This sieving operation shall be carried out manually. Weigh the material from each granular class passing through the corresponding grid sieve to 1 1 g.
Table 1 Grid sieves
Granular class Width of slot
d/D grid sieve (mm) (mm) 63 - 80 40 50 - 63 31.5 40 - 50 25 31.5 - 40 20 25 - 31.5 16 20 - 25 . 12.5 16 - 20 10 12.5 - 16 8 10 - 12.5 6.3 8 - 10 5 6.3 - . 8 4 i 5 - 6.3 3.15 4 - 5 2.5
(6) EN .... Tests for geometrical broperties of aggregates. Part .. Determination of particle size distribution - Granulometric analysis (sieving method) (In course of preparation)
8.
Bilaga 2 Sid 7 (9)
CALCULATION AND EXPRESSION OF RESULTS
8.1 Calculations
Page 7
prEN 933-6/:1992
3
The results shall be recorded on test data sheets, an example being given.in figure 1.
record as M1.Calculate the sum of the masses of the granular classes d/D and Calculate the sum of the masses of the particles in each granular class d/D which pass through a corresponding grid sieve of slot width D/2 and record as
M2.
The overall flakiness index F] is calculated from the expression
FI = M2 X 100 M1
Record the overall flakiness to the nearest whole number.
The flakiness index for each granular class. if required, is calculated as
B; x 100
Riw '-;Ef-.vf\. _ where V \ i ' JKJJE .Ai % ?x V\_U.!/'\l\|l'1_fåmi is the mass of the material in each granular class d/D passing through the corresponding grid, as specified in table 1.
Ri is the mass of each granular class d/D. in g 8.2 Validating the results
If the sun of the masses Ri differs by more than 1% from the mass Mo (see 6.2), the test shall be repeated.
9.
TEST REPORT '
The test report shall include the information referred to in 9.1 and may include the information referred to in 9.2.
9.1 Handatory data a) b) c) d) e) f)
Reference to this European Standard
Identification of the sample
Identification of the laboratory
Mass of dry sample tested
Overall flakiness index to the nearest whole number
Date of test
.
Bilaga 2
Sid 8 (9)
:iåå 333-6:1992
9.2 Optional data
f) Name and location of the sample source
g) Description of the material and of the sampling procedure
h) Flakiness index of each granular class. 10. PRECISION
Estimates of the repeatability (r) and reproducibility (R) for values of the overall flakiness index (FI) between 8 and 20 are r = 2.8 and R = 5.
NOTE. These levels of repeatability and reproducibility may be amended after further precision trials have been completed.
H
EHagaZZ
Sid 9 (9)
Page 9 prEN 933-6:1992
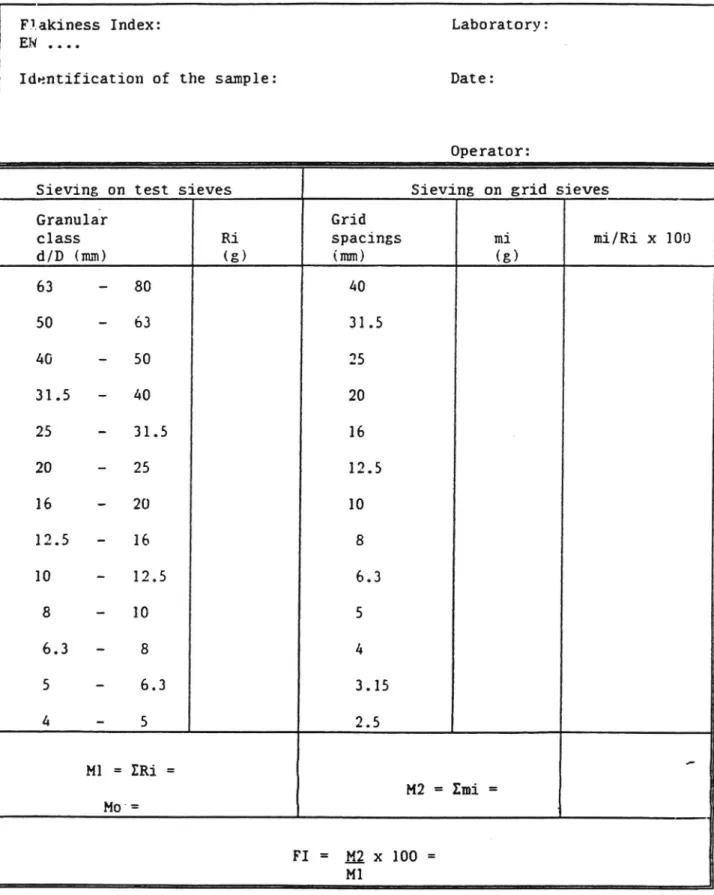
Flakiness Index: Laboratory:
.000
Identification of the sample: Date:
Operator:
Sieving on test sieves I Sieving on grid sieves
Granular Grid
class Ri spacings mi mi/Ri x 100
d/D (mm) (8) _(mm) (5) 63 - 80 40 50 - 63 31.5 40 - 50 25
31.5
-
40
'
20
25 - 31.5 16 20 - 25 1_.5 16 - 20 10 1-.5 - 16 8 10 - 12.5 6 3 8 - 10 5 6 3 - 8 4 S - 6.3 3 15 4 - 5 2 5 M1 = ZRi = ' M2 = Xmi = M0'= FI = .MZ x 100 = M1FIGURE 1 EXAHPLE.OF TEST'DATA.SHEET USED FOR DETERMINING THE FLAKINESS INDEX
Bilaga 3
DRAFT
EUROPEAN STANDARD Sid 1 (12) prEN 933-4
NORME EUROPEENNE
EUROPAISCHE NORM April 1996
ICS
Descriptors
English version
Tests for geometrical properties of aggregates -Part 4: Determination of particle shape - Shape index
Essais pour déterminer les Prüfverfahren für geometrische
caractéristiques géométriques des Eigenschaften von Gesteinskörnungen -granulats - Partie 4: Détermination de Teil 4: Bestimmung der Kornform -la granu-laritê - Indice de.forme Kornformkennzahl
This draft European Standard is submitted to the CEN members for CEN enquiry.
It has been drawn up by Technical Committee CEN/TC 154
If this draft becomes a European Standard, CEN members are bound to comply with the CEN/CENELEC Internal Regulations which stipulate the conditions for giving this European Standard the status of a national standard without any alteration. This draft European Standard was established by CEN in three official versions
(English, French, German). A version in any other language made by translation under the responsibility of a CEN member into its own language and notified to the Central Secretariat has the same status as the official versions.
CEN members are the national standards bodies of Austria, Belgium, Denmark, Finland, France, Germany, Greece, Iceland, Ireland, Italy, Luxembourg, Netherlands, Norway, Portugal, Spain, Sweden, Switzerland and United Kingdom.
CEN
European Committee for Standardization Comité Européen de Normalisation Europåisches Komitee für Normung
Central Secretariat: rue de Stassart 36, B-lOSO Brussels
c CEN 1996 Copyright reserved to all CEN members
Ref. No. prEN 933-4:1996 E
Biiaqa 3 Sid 2 (12) Page 2 prEN 933-4:1996 Contents Foreword 1 Scope 2 Normative references 3 Deñnitions 4 Principle 5 Apparatus
6 Preparation of test portion 7 Procedure
8 Calculation and expression of results
9 Test report
Annexes
A (informative) Example of a particle slide gauge
B (infonnative) Example of a test data sheet
Page U ) O O Q O N O N U I U t -h - Ä-Ä 10 11 VTI notat 42-1996
Bilaga 3
S'ld 3 (12) Page3 prEN 933-4:1996
Foreword
This European Standard was prepared by CEN/TC 154 "Aggregates the Secretariat of which is held
by BSI.
The text of the draft standard was submitted to the formal vote and was approved by CEN as
EN 933-4 on ... ..
This European Standard is one of a series of standards for tests for ' geometrical properties of
aggregates as listed below.
prEN 933-1 Determination of particle size distribution - Sieving method
prEN 933-2 Deterrnination of particle size distribution - Test sieves, nominal size of apertures
prEN 933-3 Deterrnination of particle shape of aggregates - Flakiness index
prEN 933-5 Deterrnination of cmshed and broken surfaces in coarse aggregate particles prEN 933-6 Deterrnination of texture/shape - Flow coefficient for coarse aggregates" prEN 933-7 Deterrnination of shell content - Percentage of shells for coarse aggregates prEN 933-8 Assessment of ñnes - Sand equivalent test
prEN 933-9 Assessment of ñnes - Methylene blue test prEN 933-10 Deterrnination of ñnes - Grading of ñllers
Test methods for other properties of aggregates are covered by Parts of the following European
Standards:
EN 932 Tests for general properties of aggregates
EN 1097 Tests for mechanical and physical properties of aggregates EN 1367 Tests for thermal and weathering properties of aggregates
EN 1744 Tests for chemical properties of aggregates
This European Standard shall be given the status of a National Standard, either by publication of an
identical text or by endorsement, at the latest by and contIicting national standards shall be withdrawn at the latest by .... ..
According to the CEN/CENELEC Internal Regulations, the following countries are bound to implement this European Standard: Austria, Belgium, Denmark, Finland, France, Germany, Greece,
Iceland, Ireland, Italy, Luxembourg, Netherlands, Norway, Portugal, Spain, Sweden, Switzerland, United Kingdom.
Bila a 3 Sid (12) Page 4
prEN 9334:1996
1 Scope
This Part of this Eur0pean standard speciñes a method for the determination of the shape index of coarse aggregates. It applies to aggregates of natural or artiñcial origin, including lightweight aggregates.
The test method specified in this Part of this European Standard is applicable to aggregate between 4 mm and 63 mm nominal size.
2 Normative references
This European standard incorporates by dated_ or by undated reference, provisions from other
publications. The normative references are cited at the appropriate places in the text and the publications are listed hereafter. For dated references, subsequent amendments to or revisions of any of these publications apply to this European Standard only when incorporated in it by amendment or
revision. For undated references, the latest edition of the publication referred to applies.
prEN 932-1 Tests for general properties of aggregates Part 1: Methods for sampling
prEN 932-2 Test for general properties of aggregates
Part 2: Methods for reducing laboratory samples prEN 932-5 Tests for general properties of aggregates
Part 5: Common equipment and calibration
prEN 933-1 Tests for geometrical properties of aggregates
Part 1: Deterrnination of particle size distribution - Sieving method
prEN 933-2 Tests for geometrical properties of aggregates Part 2: Deterrnination of particle size distribution Test sieves, nominal size of apertures
ISO 3310-1: 1990 Test sieves - Technical requirements and testing. Part 1. Test sieves of metal wire clorh
ISO 3310-2: 1990 Test sieves - Technical requirements and testing. Part 2. Test sieves of perforated metal plate 3 Definitions
For the purposes of this standard, the following deñnitions apply: 3.1 test portion: The sample used as a whole in a single test.
Bilaga 3
S'd5 12
1 ( ) Page5
prEN 9-33-4:1996
3.2 constant mass: Successive weighings at least 1 h apart do not differ by more than 0,1 %. NOTE: In many cases constant mass can be achieved after a test portion has been dried for a pre-determined period in a specified oven (see 5.4) at (110 :I: 5) °C. Test laboratories can determine the time required to achieve constant mass for specific types and sizes of sample dependent upon the drying capacity of the oven used.
3.3 particle length L: The maximum dimension of a particle as defined by the greatest distance apart of two parallel planes tangential to the particle surface.
3.4 particle thickness E: The minimum dimension of a particle as deñned by the least distance apart of two parallel planes tangential to the particle surface.
3.5 particle size fraction: Fraction of an aggregate passing the larger of two sieves and retained
on the smaller; the lower limit can be zero. 4 Principle
Individual particles in a sample of coarse aggregate are classiñed on the basis of the ratio of their length L to thickness E using a vemier calliper where necessary.
The shape index is calculated as the mass of particles with a ratio of dimensions L/E more than 3 expressed as a percentage of the total dry mass of particles tested.
5 Apparatus
Unless otherwise stated, all apparatus shall conform to the general requirements of prEN 932-5.
5.1 Vernier calliper, range 0 mm to 200 mm or greater, readable to 0,1 mm or better.
5.2 Test sieves, with apertures as specified in prEN 933-2 and conforming to the requirements of ISO 3310-1 and 130 331002.
5.3 Tightly ñtting pan and lid, for the sieves.
5.4 Ventilated oven, thermostatically controlled to maintain a temperature of (110 ;1; 5) °C. or other
suitable equipment for drying the aggregates, if it does not cause any particle size breakdown.
5.5 Balances or scales, accurate to 1 0,1 % of test portion mass, conforming to the requirements of prEN 932-5.
5.6 Trays, brushes.
5.7 Sieving machine, (optional). 5.8 Partide slide gauge, (optional).
Bila a 3 Sid (12) Page 6
prEN 933-4:1996
6 Preparation of test portion
The sample shall be taken in accordance with the requirements of prEN 932-1 and reduced in accordance with the requirements of 'prEN 932-2 to produce a test portion.
Sieve on appropriate test sieves with sufñcient vigour to ensure complete separation of particles
greater than 4 mm. 0
Discard the particles retained on the 63 mm test sieve and those passing the 4 mm test sieve. Record the mass of 4/63 mm fraction as Mo.
The test shall be carried out on a particle size fraction di/Di where Di < 2J1.
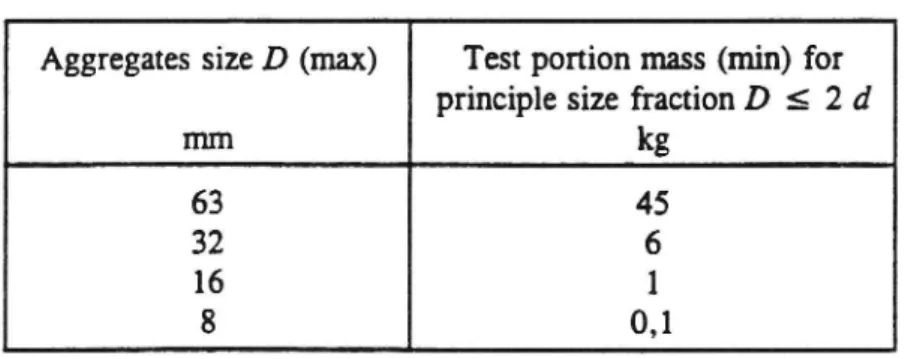
Samples for which D > 2d shall first be separated into particle size fractions di/Di where Di s 2di. The mass of each test portion shall be as speciñed in table 1.
Table 1: Mass of test portions
Aggregates size D (max) Test portion mass (min) for principle size fraction D 5 2 d
mm kg
63 45
32 6
16 l
8 0,1
NOTE: ' For other aggregates sizes D (max), appropriate test portion masses can be
interpolated from those given in table 1.
Sample reduction shall yield a test portion of mass larger than the minimum but not of an exact
predetermined value.
Record the test portion mass M,. 7 Procedure
7.1 Test portions where D S M
Assess the length L and thickness E of each particle using a vernier calliper where necessary and set
aside those particles which have a dimensional ratio L/E > 3. These particles are classiñed as
non-cubical .
NOTE 1: The number of particles requiring individual Classification using the calliper can be reduced by a preliminary separation of particles with L/E ratio signiñcantly different from 3. NOTE 2: The Classification of particles can be further assisted by the use of a particle slide guage as shown in annex A.
Weigh the non-cubical particles and record their mass as M2.
Bilaga 3 Sid 7 (12)
Page 7
prEN 9334:1996
7.2 Test portion where D > 2d
Separate the test portions into particle size fractions :ii/Di where Di s .'Zdi by sieving in accordance with prEN 933-1.
Record the mass of each particle size fraction (Mi) and calculate and record the percentage by mass
of each particle size fraction d/D to its total mass Mo between 4 mm and 63 mm as Vi.
Record the mass of the test portion for each particle size fraction d/D as Mli together with the masses of non-cubical particles in each fraction M3.
8 Calculation and expression of results
8.1 Test portions where D 5 Zd
Calculate the shape index (51) in accordance with the following equation: S] = MZ/Ml x 100
where
Ml is the mass of the test portion in grams;
M2 is the mass of the non-cubical particles in grams. Express the shape index to the nearest whole number.
8.2 Test portions where D > 2d
Calculate the weighted mean percentage of non-cubical particles in accordance with the following
equaüon:
:xxx
En
_where
Vi is the percentage by mass of particle size fraction i in the sample tested
(23 Vi = 100 %);
SIi is the percentage by mass of non-cubical particles in particle size fraction i. Express the weighted mean percentage of non-cubical particles to the nearest whole number.
NOTE FOR CEN ENQUIRY ONLY: It is h0ped to obtain an estimate of precision based on a programme of European precision trials before this draft is ñnalized for publication.
Bilaga 3
Sid 8 (12)
Page 8
prEN 933-4:1996
9 Test report
The test report shall include the information referred 'to in 9.1 and can include the information referred to in 9.2.
9.1 Mandatory data
a) reference to this European Standard; b) identification of the laboratory;
c) value of d and D of test portion;
d) mass of test portion M,;
e) mass of non-cubical particles M2;
0 shape index (SI) or weighted mean value to the nearest whole number;
g) for samples where D > 20', values of d and D of particle size fractions;
h) date of test.
9.2 Optional data
a) name and location of the sample source.
B1°1a a 3 Sid (12)
Page 9 prEN 9334:1996
Annex A (informative)
Example of a partide slide gauge
UE=3
Page 10
prEN 9334:1996
Annex B (informative)
Bilaclta 3 Sid 0 (12
)
Example of a test data sheet used for determining the shape index of coarse aggregate
EN 933-4
Identification of the sample:
Laboratory : Date : Operator : Mass of particles passing the 63 mm test sieve and retained on the 4 mm test sieve :
Mu _ g
For samples where D 5 2d
Particle size fraction oli/Dl Mass M, Mass M2 Shape index SI %
Where Di S Zdi = X
mm g g to the nearest whole number
For samples where D > 241
Weighted mean of non-cubical particles (express as a percentage)
:VixSIi
EV.
Particle size Mass of each Percentage of Mass of test Mass of non Percentage of Vi x SIi
fractions di/Di particle size each particle portion Mli cubical non-cubical where Di .<_ ?.di fraction (Mi) size fraction particles M2i particles in
Vi = (Mi/Mu) each particle
x 100 size fraction 515
= (Mai/Mn) X
100
mm 8 8 8
22Vi = 100 % EVixSIi
to nearest whole number
Bilaga 3 Sid 1 (12)
Yttrande över standardförslag
prEN 933-4 Tests for geometrical prOperties of aggregates - Part 4; Determination of particle shape - Shape index
Ti ll st yr ke r för sl ag etut an ko mm en ta r Till st yr ke rf ör sl ag et me d bi fo ga d ko mm en ta r Avs tyr ke rför sl ag et me d bi fo ga d mo ti ve ring Avs tår fr ån st äl ln in gs ta ga nd e til l för sl ag et Bör öve rs ät ta s ti ll sve ns ka
lionunenunerllj»
Företag/institution/myndighet Handläggare Underskrift Datum VTI notat 42-1996Bilaga 3 Sid 12 (12)
Kommentarer, motiveringar, ändringsförslag och övriga uppgifter bör struktureras enligt nedan. Aktuellt avsnitt i standardförslaget bör anges. .
a) Synpunkter av redaktionell natur
b) Synpunkter av teknisk natur (inklusive motiv till eventuell avstyrkan)
c) Avvikelse från svensk lag eller myndighetsföreskrift (precisering av avvikelsen samt beträffande förespråkad åtgärd; jfr missivet)
d) Avvikelse från svenska förhållanden, medförande tekniska/ekonomiska
konse-kvenser (precisering av avvikelsen samt synpunkter beträffande om nationellt avsteg bör begäras, och om så är fallet, hur länge avvikelsenbedöms behöva gälla; jfr missivet)